Summary:
- Warren Buffett’s Berkshire Hathaway has been selling shares in Bank of America and other long-term holdings, likely an effort to raise cash before a potential bear market.
- BAC has widely underperformed both the S&P 500 and financial sector since 2007, including trading over the past year.
- A subset of technical indicators is highlighting a rare sell signal, suggesting material downside risk, especially in a recession scenario.
- Limited upside potential matched against the substantial risk of loss lead me to maintain a Sell rating on Bank of America for the next 12 months.

Klaus Vedfelt
Warren Buffett‘s Berkshire Hathaway (BRK.A) (BRK.B) has been a regular seller from its large Bank of America (NYSE:BAC) stake in 2024. Last week another huge share dump was reported to the SEC. In total, about $1.5 billion in stock value has been liquidated over the past several weeks, around $10 billion since early summer.
It’s not the only stock he has been exiting. Other sell targets include his biggest holding – Apple (AAPL). I wrote a bearish article on Apple’s prospects in August here, partly the result of Berkshire’s decision to liquidate.
More than likely, Berkshire’s desire to sell shares has something to do with a goal of raising cash before a major bear market and recession hit the U.S. economy. Mr. Buffett has a history of raising cash before major market tanks, while coming to the rescue of Wall Street blue chips on the rocks during recession. At the end of June, Berkshire was managing an incredible cash position of $276 billion, earning 4%, 5% and more for essentially “risk-free” yield in Treasuries. (For context, Berkshire may soon own greater than 1% of all publicly-issued U.S. Treasury debt, the same level as many large nations!)
In Bank of America’s case, shares have declined markedly in 6 of the last 7 recessions. Only the 2001-02 experience witnessed any type of gain, which was preceded by a -50% price haircut starting in 1998.
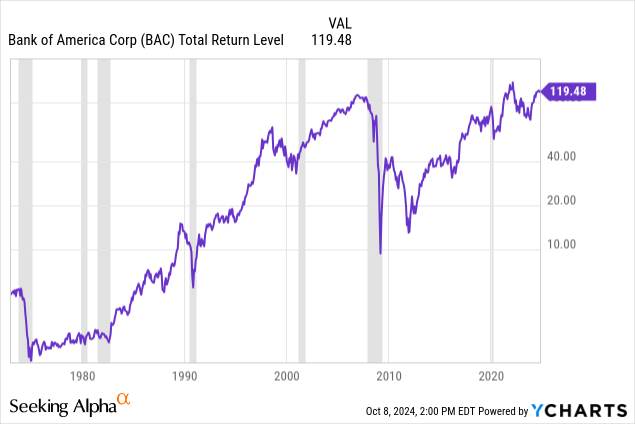
YCharts – Bank of America, Total Returns, Since 1972, Recessions Shaded
The unfortunate news for long-term Bank of America investors is the stock has been a chronic “underperformer” of both the S&P 500 index and financials in general since 2007. Below is a total return graph comparing the stock to alternatives since early 2008, with a second graph highlighting equally rotten gains since early 2022. Over the past 16 years, shares have eked out an annualized advance of just +1.7%. You would have earned a greater sum plainly by owning CDs issued by Bank of America.
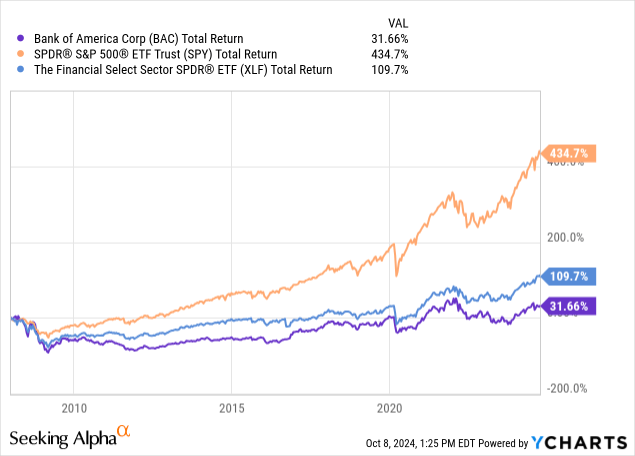
YCharts – Bank of America vs. S&P 500 and Financial Sector ETFs, Since 2008
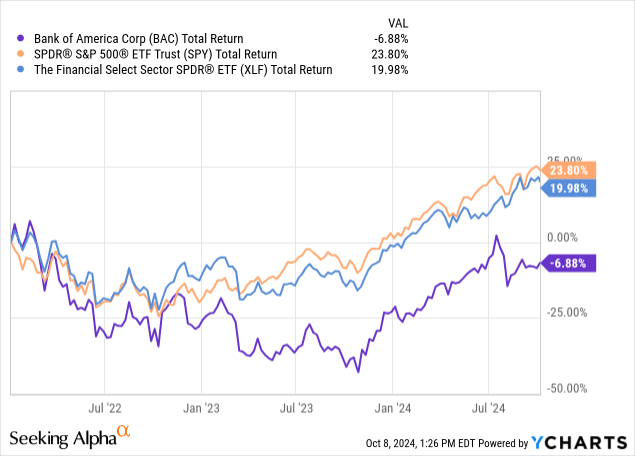
YCharts – Bank of America vs. S&P 500 and Financial Sector ETFs, Since January 2022
In addition, Bank of America has been a real laggard vs. America’s money-center banks, top lenders by loan size, and biggest brokerage equity names since its January 2022 top, pictured below. My sort list includes JPMorgan Chase (JPM), Citigroup (C), Wells Fargo (WFC), American Express (AXP), Charles Schwab (SCHW), and Goldman Sachs (GS).
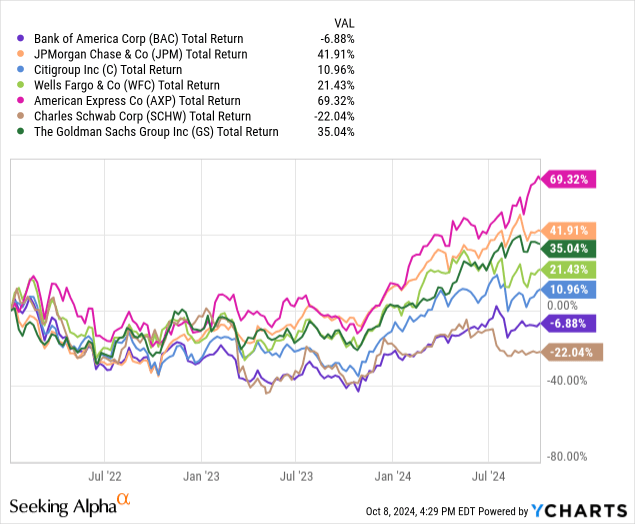
YCharts – Bank of America vs. Major U.S. Banks, Total Returns, Since January 2022
I last mentioned Bank of America as a Sell idea in late December here. The good news for shareholders is a nominal total return of +18% has been achieved, although this gain was less than experienced in alternative investments in the sector.
Honestly, Buffett’s mass liquidation spree in 2024 has served to reinforce my bearish outlook for the company and its stock quote. Plus, the appearance of a unique momentum sell signal on the charts since early August argues investors still holding the stock should seriously consider capturing any trading/investment gains this year, before tax rates likely rise next year and 2026. (An expected lower capital gains rate during 2024 could be a secondary excuse for Buffett selling.) At some point soon, the government will be forced to increase tax rates on the wealthy to reduce our spending deficit. Everybody knows it.
Let me explain my viewpoint and logic for selling/avoiding Bank of America.
Valuation Not Exactly Cheap
Sure, if Bank of America had a better valuation, I might be willing to rate the stock a Hold. However, BAC is now beholden to macroeconomic events in America with a relatively “average” valuation setup vs. other big banks and lending concerns.
The trailing P/E ratio of 14x is on the lower end of the spectrum, as current profitability rates are running quite high. We are in a kind of best-of-all-worlds banking situation, with high borrowing rates for loan originations on one hand and limited loan default stats on the other. BAC’s consumer and small business loan focus looks like a winner when times are good. Operating problems appear in a recession, as credit quality issues and loan write-offs explode.
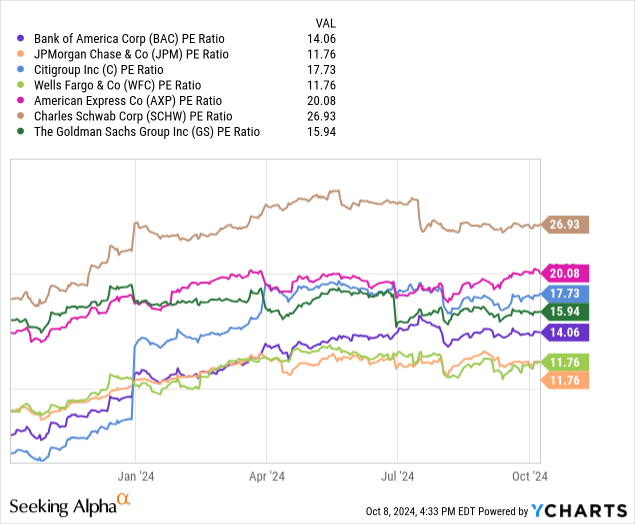
YCharts – Bank of America vs. Major U.S. Banks, Trailing P/E, 1 Year
The price to trailing sales ratio is on the high side of the scale vs. peers and competitors, as investors are currently focused on strong levels of income generation.
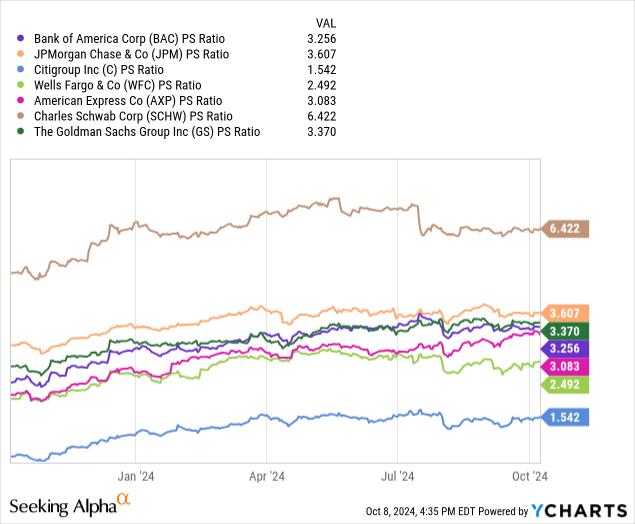
YCharts – Bank of America vs. Major U.S. Banks, Price to Trailing Sales, 1 Year
This combination has created profit margins of 24%+, a very positive level vs. the industry (and preferable for investors if margins remained elevated the whole economic cycle). Strong income levels have definitely encouraged investors to stay bullish in 2023-24.
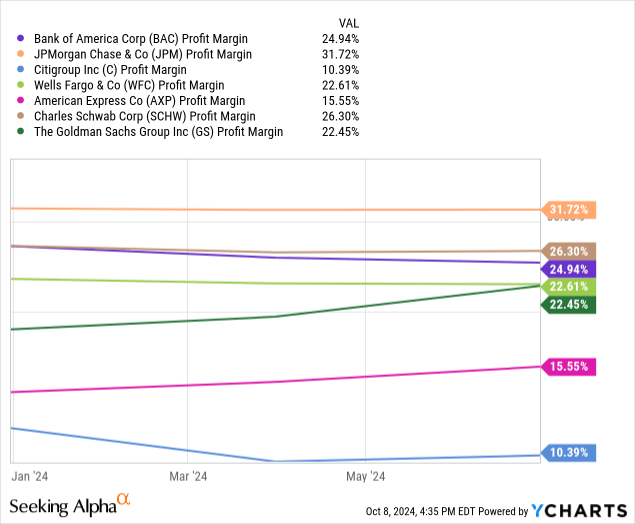
YCharts – Bank of America vs. Major U.S. Banks, Final After-Tax Profit Margin, 1 Year
Seeking Alpha’s Factor Grades are mixed at best. Again, the long-term Valuation picture for BAC-specific numbers, alongside immediate comparisons vs. the banking space support only a “C-” score. The highlight positive score comes from it peaking level of Profitability, with an “A+” reading in October 2024.
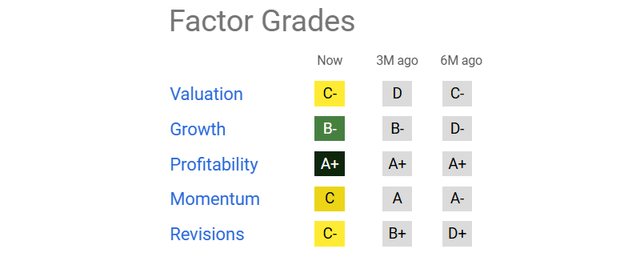
Seeking Alpha Table – Bank of America, Factor Grades, October 8th, 2024
Ugly Chart Sell Signal
My primary immediate worry about Bank of America’s share trading action comes from the wicked selloff in July-August, which included a rare warning for investors.
Basically, aggressive selling matched against an absence of buyers produced 52-week lows in three indicators of short-term momentum. I have circled in gold the problematic situation below, where the 14-day Ease of Movement, 20-day Chaikin Money Flow, and 13-day Force Index, all reached new 52-week lows at roughly the same time.
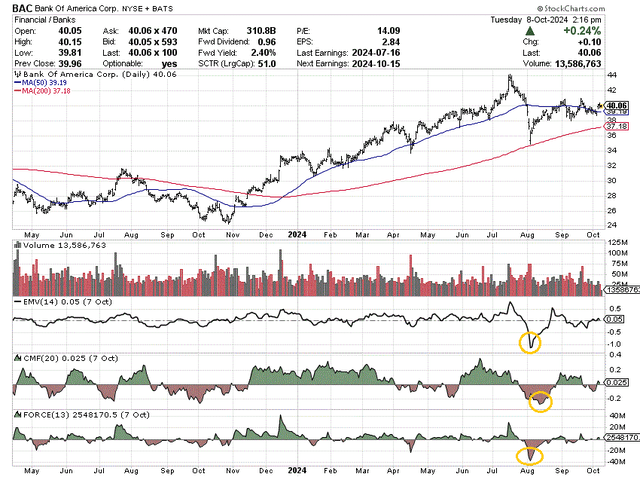
StockCharts.com – Bank of America, 18 Months of Daily Price & Volume Changes, Author Reference Points
How rare is this setup on the charts? Going back through history, I can only find three other instances of this trading pattern in Bank of America’s stock since the late 1980s.
February-April 2022
The closest recent pattern example happened in the first four months of 2022. All three trading indicators reached new 52-week lows within a 6-week period. Not exactly the same as this year’s explosion in lopsided selling volumes concurrently recorded by these indicators, but a clear shift in investor sentiment with a drop underneath BAC’s 200-day moving average was present. Afterwards, from February’s peak to October 2022’s bottom, the quote declined almost -40%.
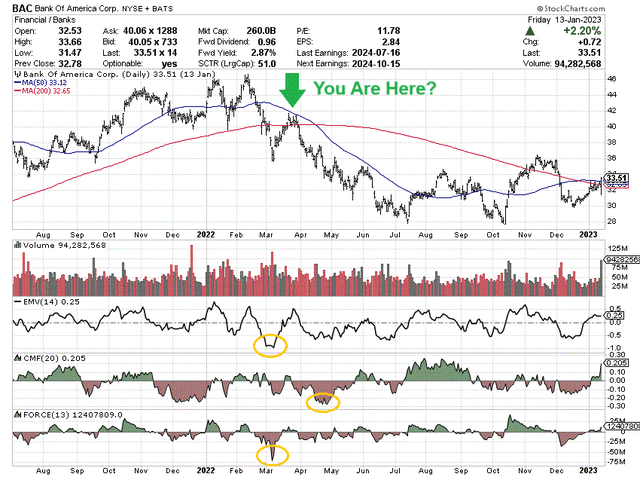
StockCharts.com – Bank of America, Daily Price & Volume Changes, July 2021 – Jan 2023, Author References
Summer 2010
To find another similar indicator setup of new 52-week lows huddled together, you have to travel back in time to 2010. Again, over roughly six weeks, all three reached new yearly lows. Measured from the March 2010 peak price to December 2011’s low, BAC would drop -75% in price. (Interestingly, this pattern did not appear during the 2007-09 Great Recession.)
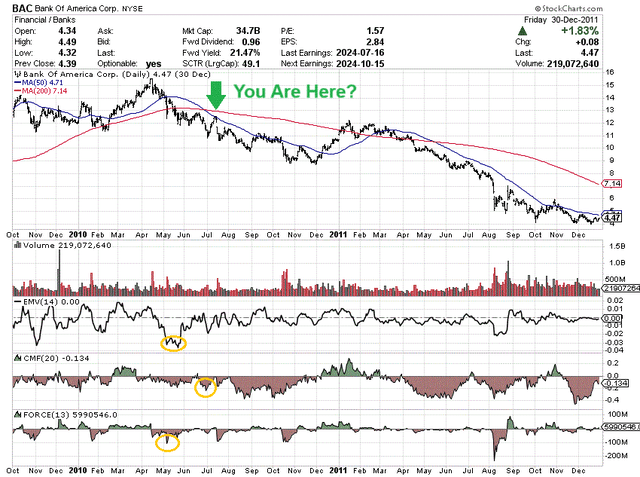
StockCharts.com – Bank of America, Daily Price & Volume Changes, Oct 2009 – Dec 2011, Author References
Spring 1993
Lastly, the only other example of all three indicators imploding together (over the past 35 years) was during April-May 1993. Had you exited BAC a few months later on the retest of its 200-day moving average, you could have repurchased the stock 20% to 25% lower at various times over the next 15 months. Measured from its March 1993 peak, the share quote would slide almost -35% into the November 1994 bottom.
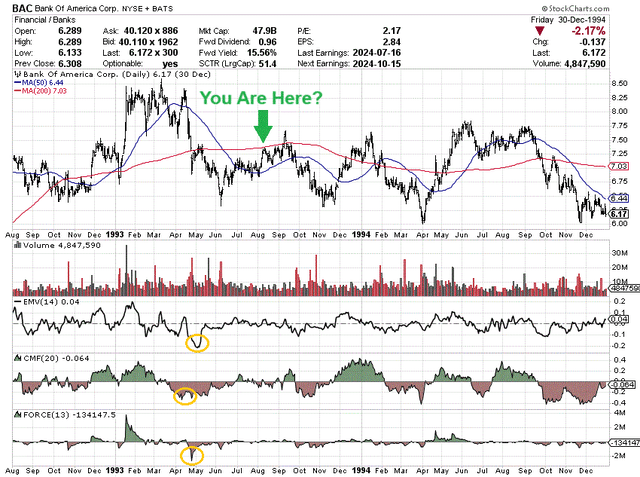
StockCharts.com – Bank of America, Daily Price & Volume Changes, Aug 1992 – Dec 1994, Author References
Final Thoughts
In my view, upside potential is sorely lacking in the stock, if earnings are peaking in 2024. When times are good and have been for a stretch of years, selling banks and financials can seem nonsensical. Yet, Warren Buffett is doing so (having liquidated much of his bank/financial holdings during 2023-24) because the industry is quite cyclical in nature. Often, you get the “cheapest” trailing valuation stats on earnings at an industry top, and the most expensive ratios in the middle to tail end of a recession when loan write-offs lead to net losses for income reporting.
The current leverage ratio of nearly 11:1 for total liabilities to equity (book value) is drawn below (0.91x liabilities to assets rephrased). Bank of America sits right in the middle of its banking peer group. In other words, if 9% of its assets including loans decrease in value closer to zero during a severe economic shock period, BAC could theoretically be bankrupt, with $0 for a share price destination (absent government intervention like 2008-09’s Great Financial Crisis).
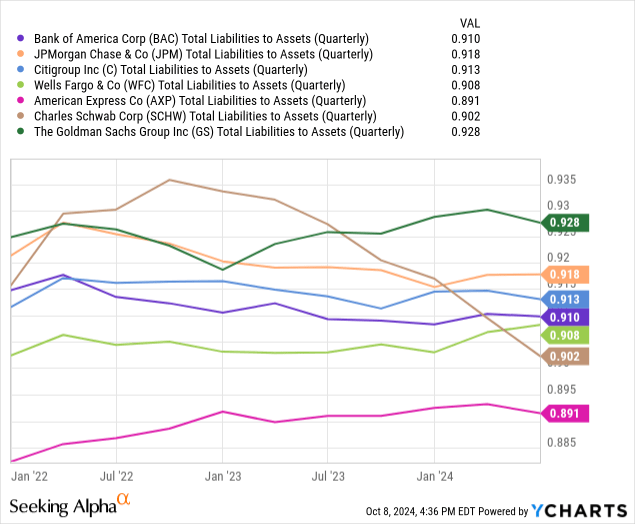
YCharts – Bank of America vs. Major U.S. Banks, Total Liabilities to Assets, 3 Years
The one positive I can find for BAC shareholders is the annual trailing dividend yield sits near 2.5% (2.6% forward indicated by management). This cash distribution rate for existing investors is on the high end of the group, and roughly double the prevailing 1.2% rate of the S&P 500 index. Nevertheless, it won’t provide much protection in a recession scenario and is still quite a distance from the risk-free yields of 4.5%+ available from short-term cash investments like CDs and Treasuries.
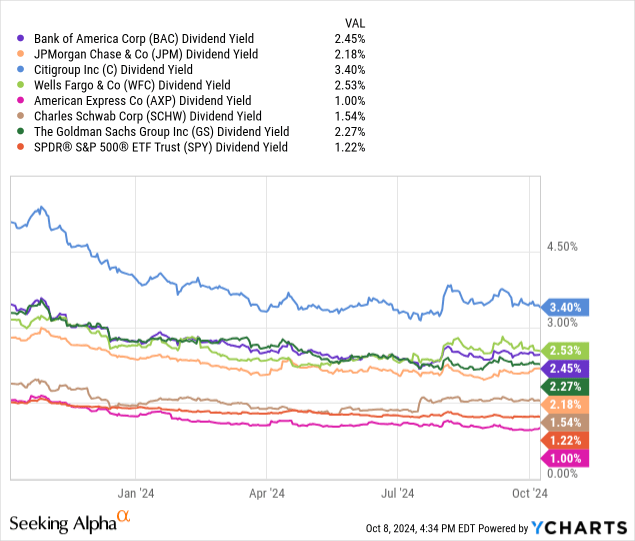
YCharts – Bank of America vs. Major U.S. Banks, S&P 500 ETF, Trailing Dividend Yield, 1 Year
What could keep Bank of America’s share quote above $40 in 2025? Well, my answer is the “Goldilocks” economy of 2024 must continue. We need to see inflation and interest rates backpedal some more. The economy cannot slow down from today’s 2%+ real GDP growth rate. And, confidence in the U.S. equity market overall must remain abnormally exuberant (based on sentiment surveys and capital flows).
If any of these three pillars for a sound economy with a boom in stocks reverses, BAC’s share price will likely suffer. Plus, if the current script is flipped, where interest/inflation rates unexpectedly jump higher (maybe in a Middle East crude oil supply shock), the economy slips into recession, and investors decide to dump stocks instead of buy them, incredible downside “risk” is inherent for all lending businesses, including Bank of America.
My thinking is even a mild recession could send BAC’s price under $30 with ease (good for a -25% price slide), while a major drop in economic activity crossed with rising inflation could tank the quote under $20 (-50% price decline). That’s the risk side of the investment equation Berkshire managers like Buffett seem to be focused on.
For sure, damage done by the technical selloff during July-August is hard to ignore. It is quite similar to the weakening performance patterns in many Big Tech names since late spring, which I have documented in my writings.
With BAC’s Q3 earnings call scheduled for October 15th, any hint of trouble from rising loan losses into early 2025 or a downward revision in guidance overall could be the catalyst for a bearish stock price phase to begin.
Limited upside potential matched against the rather significant risk of loss in a downturn are keeping me on the Sell side for a rating on Bank of America, using a 12-month outlook. I remain focused on other sectors of the market outside of banking/lending with my investment capital.
Thanks for reading. Please consider this article a first step in your due diligence process. Consulting with a registered and experienced investment advisor is recommended before making any trade.
Analyst’s Disclosure: I/we have no stock, option or similar derivative position in any of the companies mentioned, and no plans to initiate any such positions within the next 72 hours. I wrote this article myself, and it expresses my own opinions. I am not receiving compensation for it (other than from Seeking Alpha). I have no business relationship with any company whose stock is mentioned in this article.
This writing is for educational and informational purposes only. All opinions expressed herein are not investment recommendations and are not meant to be relied upon in investment decisions. The author is not acting in an investment advisor capacity and is not a registered investment advisor. The author recommends investors consult a qualified investment advisor before making any trade. Any projections, market outlooks, or estimates herein are forward-looking statements based upon certain assumptions that should not be construed as indicative of actual events that will occur. This article is not an investment research report, but an opinion written at a point in time. The author's opinions expressed herein address only a small cross-section of data related to an investment in securities mentioned. Any analysis presented is based on incomplete information and is limited in scope and accuracy. The information and data in this article are obtained from sources believed to be reliable, but their accuracy and completeness are not guaranteed. The author expressly disclaims all liability for errors and omissions in the service and for the use or interpretation by others of information contained herein. Any and all opinions, estimates, and conclusions are based on the author's best judgment at the time of publication and are subject to change without notice. The author undertakes no obligation to correct, update or revise the information in this document or to otherwise provide any additional materials. Past performance is no guarantee of future returns.
Seeking Alpha’s Disclosure: Past performance is no guarantee of future results. No recommendation or advice is being given as to whether any investment is suitable for a particular investor. Any views or opinions expressed above may not reflect those of Seeking Alpha as a whole. Seeking Alpha is not a licensed securities dealer, broker or US investment adviser or investment bank. Our analysts are third party authors that include both professional investors and individual investors who may not be licensed or certified by any institute or regulatory body.
