Summary:
- WFC’s stock price has risen significantly compared to other major banks, outperforming the S&P Bank ETF and S&P 500.
- Its net interest income and margin have contracted through the last quarters. Yet, non-interest income has partly counterbalanced the NII drop by increasing quarter over quarter.
- Despite potential tailwinds from rate cuts, the P/B stands close to its historical level suggesting a hold rating of the stock.
jetcityimage
Wells Fargo (NYSE:WFC) is the third largest commercial bank in the US by domestic assets held, with a consolidated amount of $1.7 trillion. The bank currently has $213 billion in market cap and employs more than 220,000 people. In Q1, WFC registered $19.925 billion in revenue and $4.619 billion in net income. In this analysis, I will go through their earnings evolution per business line, and discuss their provided sensitivity analysis on rate movements, risks, and business attractiveness compared to other major banks. All of these elements helped me conclude a hold rating for the stock.
Wells Fargo Company Presentation
The bank is divided into five different operating segments.
1. Consumer Banking & Lending (43%)
2. Commercial Banking (15%)
3. Corporate & Investment Banking (23%)
4. Wealth & Investment Management (18%)
5. Corporate (2%)
All these different segments help bring diversification not only in business activity but also in the mix between interest and noninterest income, with the latter being less sensitive to monetary policy. Less interest rate sensitive segments include Investment Banking, Wealth and Investment Management, and Corporate, as non-interest income constitutes the majority of their revenues. Overall, 59% of the income comes from net interest, while the remaining 41% comes from non-net interest.
Some years Wells Fargo experienced several scandals that damaged the reputation and trust of the bank. The major one occurred in 2016 when the bank was fined $185 million after several company representatives were found to be opening more than 500k fake deposit accounts without the consent of clients. This scandal continued for years and eventually, in 2017, the company reported a higher figure of 3.5 million accounts than what was initially sanctioned.
This and many other scandals made the Federal Reserve to restrict the growth of Wells Fargo, reposing to widespread concerns about consumer abuses and regulatory violations. Of course, all these events have made the stock to massively underperform the market and other peers. Since the scandals started in September of 2016, the stock has only gained 20.77% in around eight years, and now the company is on its way to improving performances and difficulties of the past.
WFC Quarterly Earnings Evolution
Q1 2024 Presentation WFC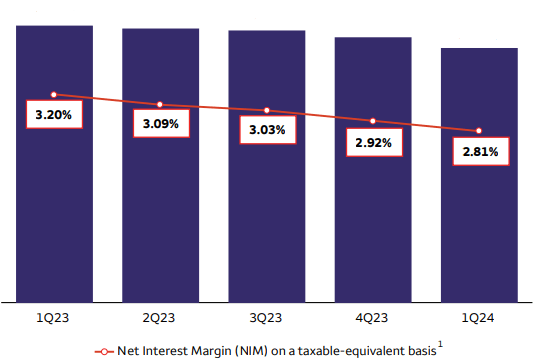
Over the recent quarters, Wells Fargo has been experiencing a decrease in its net interest margin. As non-interest-bearing deposits are withdrawn and moved towards higher-yielding accounts, the bank is more dependent on interest-bearing funding which increases the cost of funding and trims the NIM. The previous has been the scenario over the past quarters where the NIM passed from 3.20% to 2.81%. Yet, later in the analysis, you will see how this NIM of Wells Fargo is currently the highest among major banks in the US.
Above is an image that includes how the total loan book has been decreasing together with deposits, especially the deposits arriving from consumer banking. Jointly the non-interest-bearing deposits represent 26% of the total deposits which is inferior to the 32% from a year ago and 36% from two years ago, due to the aforementioned allocations. In absolute terms, the situation is more notorious as this has been the development of non-interest-bearing demand deposits,
- $529,957M in Q1 2022,
- $434,912 in Q1 2023 and,
- $356,162 in Q1 2024,
which represents a shocking drop of -48.8%.
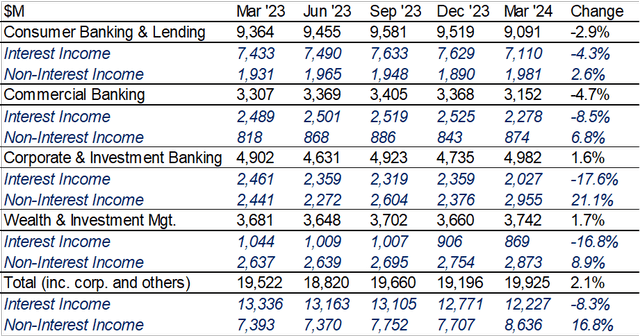
Following the NIM reduction, net interest income from all business segments has also been affected by decreasing -8.3% YoY and -4.3% QoQ. The majority of the drop is explained by changes in NII from the Consumer Banking segment (as it’s the largest NII generator), but on a relative basis, it was the segment that experienced the lowest yearly percentage change -4.3%.
On the other hand, non-interest income has been exhibiting strong momentum over the quarters, with growth from all segments in both a YoY and QoQ basis. This performance is mainly attributed to the Corporate & Investment Banking segment, which is the cause for explaining 62% of the yearly increase and 41% of the quarterly increase.
At odds, the net interest income and non-interest income brought the total revenue to a slight gain of 2.1% for the year. Yet, it demonstrated a 3.8% increase from the previous quarter, particularly driven by strong total non-interest income from the Investment Bank.
Moving on, the table above illustrates the operating profit per segment. As discussed before, Corporate & Investment Banking has been the main counterbalance of the bank’s performance, and in terms of profit before tax, it has been even more notorious after being the only segment that exhibited EBT growth from a year ago and from a quarter ago. Surprisingly, the Wealth & Investment Management division considerably reduced its contribution profit, despite the rise in markets, and growth in its segment top line. At the same time, the Consumer and Commercial Banking segments continued with an important YoY drop in EBT.
Net Interest Income Sensitivity Analysis
WFC Q1 2024 10-Q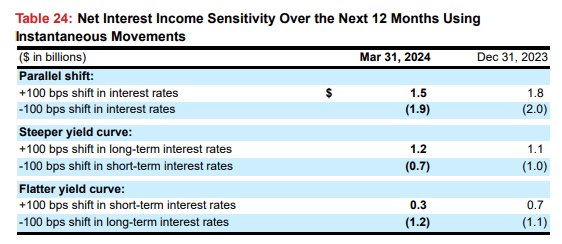
Going forward, the most likely scenario to occur in yields is probably a bull steepener caused by a reduction in the short-term yields. Yet, based on Wells Fargo NII at-risk analysis, this scenario would have a negative effect, taking away $700 million from net interest income. For banks, the ideal scenario is one with a steep yield curve and high loan demand. Nonetheless, high short-term interest rates also tend to benefit banks that have a high weight of non-interest-bearing deposits in their asset mix, which is the case for WFC. Out of the $1,730,305 million in quarterly average liabilities, $408,506 are non-interest bearing which would gain all the asset interest without funding costs. At the same time, elevated short-term interest rates induce for reductions in non-interest-bearing deposits, as clients move to money market instruments.
Even though the sensitivity analysis suggests that a bull steepener would negatively affect net interest income, it seems that the company is positioning towards mitigating losses from rate cuts as compared to Q4. From quarter to quarter, they are now mitigating $300 million in old hypothetical losses.
This analysis only takes into account net interest income. However, there could be a possibility that non-interest income could benefit from rate decreases, as it would most likely be the case for the Investment Banking and Wealth and Investment Management divisions. Also, the sensitivity analysis cited, infers an instantaneous 100 bps movement in the rates which is deeply unlikely, unless an unexpected recession occurs or if inflation ramps up to double digits immediately.
Guru Focus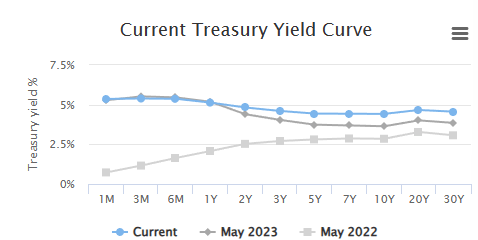
So far, even though the yield curve remains inverted, the spread of longer-term and short-term yields has decreased when compared to a year ago. Also from the sensitivity analysis, the worst outcome would be a parallel shift in the yield curve. A 100-bps parallel downside move in all maturities would cause Wells Fargo to lose $1.9 billion from net interest income. This situation could arise from rate cuts, a fly-to-quality scenario, and mid-term yields also decreasing.
Wells Fargo vs. Other US Banks
| Q1 2024 | WFC | C | BAC | JPM | Rank |
| NIM | 2.81% | 2.42% | 1.99% | 2.71% | #1 |
| Efficiency Ratio | 69 | 67 | 67 | 54 | #4 |
| ROCE (Average) | 10.5% | 6.6% | 9.4% | 17.0% | #2 |
| CET1 | 11.2% | 13.5% | 11.9% | 15.0% | #4 |
| Book Value 1Y Growth | 0.99% | 0.27% | 4.01% | 7.58% | #3 |
| Book Value 3Y Growth | -4.76% | 2.62% | 4.52% | 20.98% | #4 |
Author’s Compilations | Companies’ Q1 2024 10-Q Reports | YCharts
When comparing major US banks to relevant metrics, it is evident that JPMorgan, by far, is the best-in-class bank. They have the lowest efficiency ratio, the highest ROE, and the bank that has grown the most in its book value over the last years. Now, analyzing Wells Fargo’s business attractiveness against peers, we can see that they don’t do a great job. For example, they have been the only major bank that over the last three years have lost equity in addition to having the lowest CET1 capital adequacy ratio and experiencing the highest efficiency ratio.
Despite this, Wells Fargo is the bank with the highest net income margin and in terms of return on equity, they stand second. One would say that Wells Fargo surpasses JPMorgan in NIM because they are assuming higher risks and lending at higher rates. Well, this is not the case as in Q1 Wells Fargo paid less for interest-bearing liabilities (3.22%) and obtained less from interest-bearing assets (5.9%) than JPMorgan Chase & Co (JPM).
WFC Stock Momentum
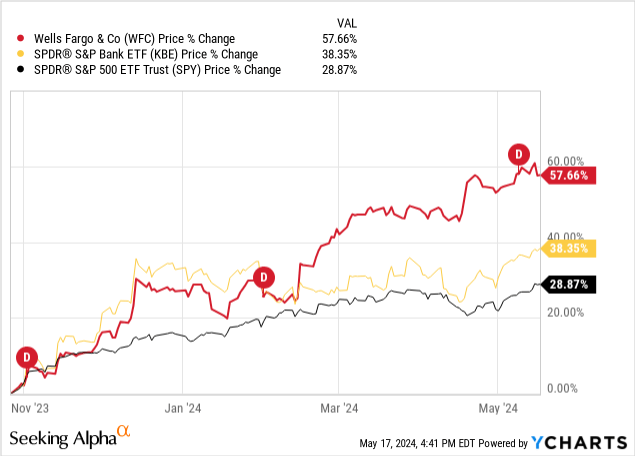
Compared to other major banks, WFC has had a ramp-up in its share price since November of 2023. In this case, on a price return basis, the stock rise has been around 57.69%, which had a clear outperformance to the S&P Bank ETF (KBE) at 38.25%, and to the S&P 500 at 28.80%. This extended rally started with optimism regarding an end of the interest rate rise cycle, after initial signals from central bank officials. With this momentum in the stock, WFC now remains 7.9% away from its all-time high of $65.93 experienced in early 2018, right before the Federal Reserve announced they would be restricting Wells Fargo’s growth due to widespread consumer abuses.
Valuation
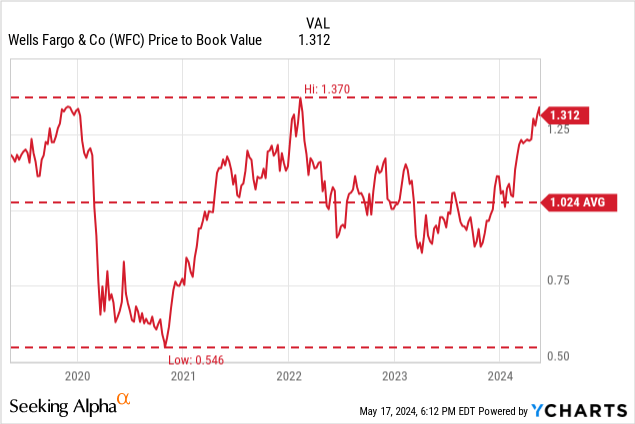
Depending on how you adjust it, the price to book of Wells Fargo might look fairly valued or over-valued to its history. For example, based on a five-year history, the stock multiple is almost situated at all-time highs at 1.312x, which represents a downside potential of -22%. Nonetheless, when tweaking the graph, the bank stands in fair value territory very close to its average history at 1.277x.
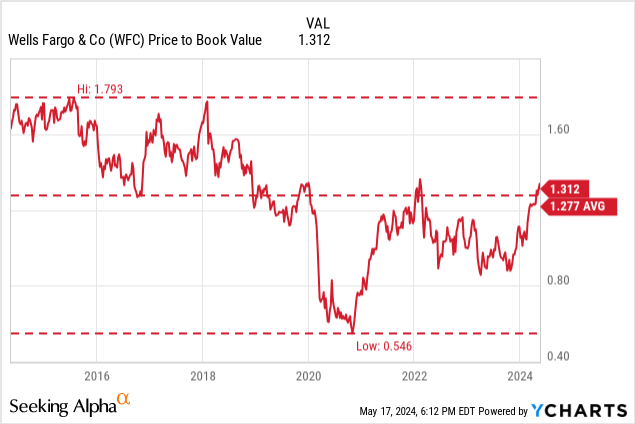
Which one should be used? In my opinion, after all the scandals and fines, Wells Fargo is not the same company so I will be opting for the shorter-term multiple history. Nonetheless, with sanctions against Wells Fargo easing, the company could reach its growth potential which couldn’t be done some years prior. Taking this into account, I am going to weigh both averages in the following matter, 60% five-year average and 40% ten-year average. Keep in mind that this will end up representing 80% of the recent data as the 10-year average includes the last 5 years, of course. With this, the results end up with a weighted average of 1.105x, which provides a downside potential of -16%. Still overvalued but has improved compared to the last five-year average.
|
WFC |
C |
BAC |
JPM |
|
| Price to Book |
1.32 |
0.65 |
1.16 |
1.90 |
| ROCE (TTM) |
10.8% |
3.5% |
9.0% |
16.7% |
Seeking Alpha
Based on a price-to-book comparison, Wells Fargo has the second highest multiple (1.32x) after JPMorgan (1.90x), and before Wells Fargo are Bank of America (1.16x), and Citi (0.65x). Yet, before saying that Citi is a bargain at this multiple, in finance not every dollar of “book” has the same value, and for that reason, the level of ROE is what justifies the multiple. As you can see, JPMorgan has the highest price to book, but at the same time, is the bank that can return the most amount of dollars per unit of book. On the other hand, Citi has a poor ROE and that’s why it’s justifiable for them to trade below book value.
I tried to use the Justified Price-to-Book formula to come up with an intrinsic value of the P/B multiple, but unfortunately, the results weren’t meaningful for all companies, and made no sense to include them in this analysis. For example, JPM had an inferior implied cost of equity than its implied sustainable growth rate, when that occurs this model can’t be used.
Seeking Alpha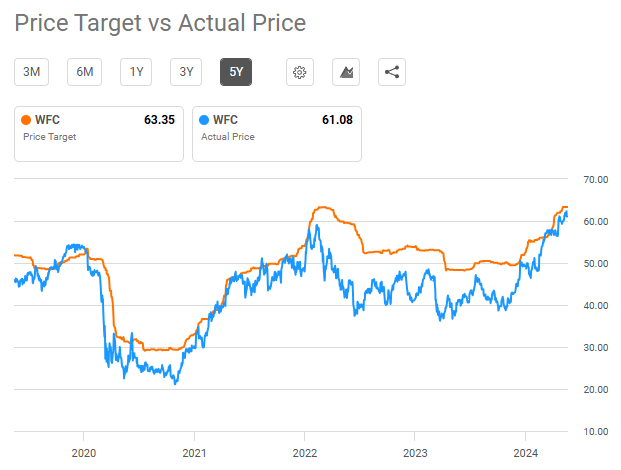
Last, Wall Street analysts, on average, seem to agree on a price target of $63.35, which is close to the current price of $61.08, suggesting a fair-valued status. This convergence in the average price targets with the current price, naturally, has led the rating distribution to concentrate more towards a hold rating, making it the majority of the ratings, as seen in the image below.
Seeking Alpha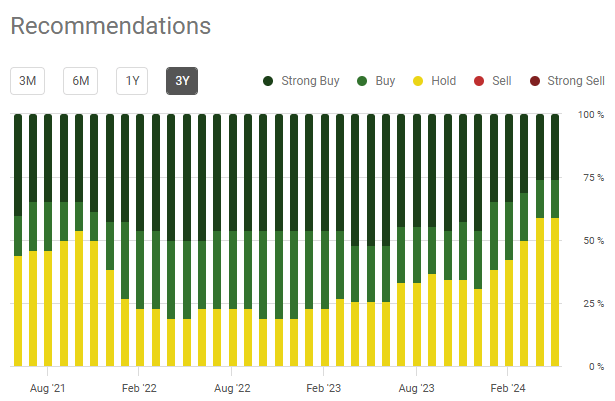
Conclusion
Even though the historical valuation stands overvalued based on my weighted average, I believe that there are some tailwinds from rate cuts that could benefit the company as a whole. Investment Banking activity and Asset Management segments would most likely benefit as lower discount rates imply higher valuations, all else constant. Also, falling consumer deposit withdrawals could see a deceleration and would help improve the liability mix with cheaper financing together with higher loan demand if things in the economy do not unfold. These tailwinds still preclude me from a buy rating as there are clearly better-positioned competitors such as JPM, and the stock has rallied severely since November, putting the historical book value at the highest levels of the last five years. Therefore, what made more sense to me in this case was to opt for a hold rating.
Analyst’s Disclosure: I/we have no stock, option or similar derivative position in any of the companies mentioned, and no plans to initiate any such positions within the next 72 hours. I wrote this article myself, and it expresses my own opinions. I am not receiving compensation for it (other than from Seeking Alpha). I have no business relationship with any company whose stock is mentioned in this article.
Seeking Alpha’s Disclosure: Past performance is no guarantee of future results. No recommendation or advice is being given as to whether any investment is suitable for a particular investor. Any views or opinions expressed above may not reflect those of Seeking Alpha as a whole. Seeking Alpha is not a licensed securities dealer, broker or US investment adviser or investment bank. Our analysts are third party authors that include both professional investors and individual investors who may not be licensed or certified by any institute or regulatory body.


