Summary:
- Amazon is the world’s 3rd largest company by revenues, and current analyst consensus is that it will surpass Walmart’s revenues by 2025.
- That said, revenue revisions been on a downtrend over the past two years, and this year’s 40% rise in Amazon’s Price/Sales ratio seems inconsistent with this.
- I see Amazon as a benchmark of large, thinly profitable, highly valued technology companies that don’t pay dividends and trade it accordingly.
- From current levels, I see a correction more likely than a continued rise, so would buy put spreads on Amazon as a hedge against market revaluation.
Teamjackson/iStock Editorial via Getty Images
My main focus is on non-US dividend paying stocks, so Amazon Inc (NASDAQ:AMZN), America’s highest-grossing non-dividend paying stock, in many ways represents the opposite of most stocks I ever consider investing in. That said, AMZN is a well-diversified business highly correlated to benchmarks like the NASDAQ 100 (QQQ) and S&P 500 (SPY), so AMZN has been on my short list of stocks whose valuation metrics I watch as a high level barometer of how cheap or expensive the broader stock market may be. I find it much easier to run a refreshed valuation on a few simple representative companies like AMZN than on all 100 or 500 stocks in QQQ or SPY respectively, and have at times even used options on stocks like AMZN as broad market hedge similar to how I would use options on SPY or QQQ. In this article, I will break down the factors likely to drive AMZN’s business and share price over the short term, the next two years, and suggest some specific option trades I am considering to capture these next possible moves in AMZN.
Using AMZN As A Partial Market Benchmark
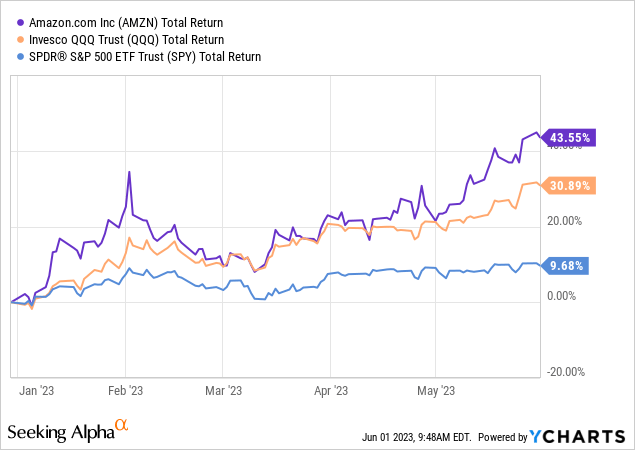
For readers who may find it questionable that I might trade AMZN almost interchangeably with part of my QQQ or SPY exposure, I refer to my 2021 article where I show how closely SPY can be tracked with just 5 stocks. This is because even though AMZN only makes up about 6.7% of QQQ and 3% of SPY, most of AMZN’s short-term moves are highly correlated to these two benchmarks. This makes sense, given that these are some of the most traded index ETFs in the world, and many of the buy and sell orders for AMZN shares are ultimately driven by flows into and out of index ETFs like these. This first chart below comparing the movement of AMZN’s share price in the first five months of 2023 versus the moves in QQQ and SPY over the same period shows one of the best examples of this relationship. This chart also shows how in periods like early 2023, when growth-tilted QQQ rose more than the more balanced SPY, AMZN rose even more than QQQ, showing how AMZN is an even more extreme manifestation of US large cap growth than QQQ.
This chart gets a little bit messier when we look back over the time horizon of this article, two years, over which time we see that AMZN fell more than QQQ, which fell more than SPY, over calendar year 2022, but unlike QQQ, AMZN shares have not recovered to their mid-2021 levels.
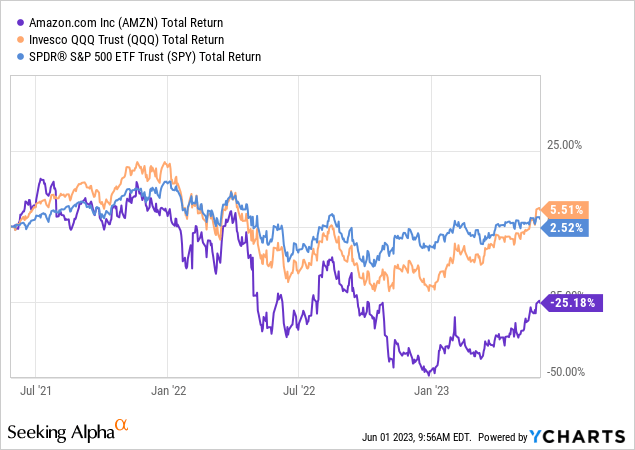
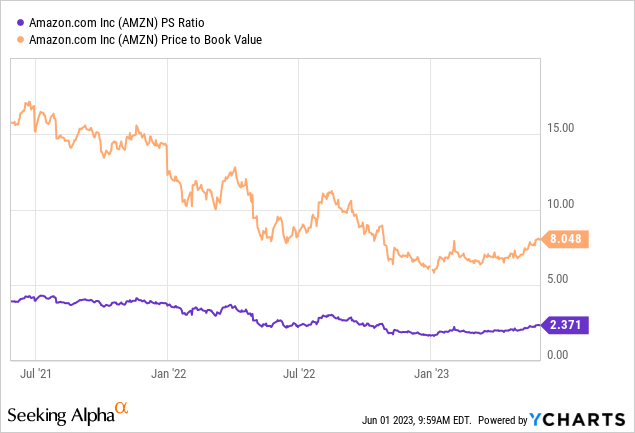
This underperformance of AMZN over the past two years, despite Amazon’s continued growth as we will see later, was simply due to the market significantly reducing how much it was willing to pay for each dollar of Amazon’s sales, earnings, or book value over the past two years. At the end of May 2021, AMZN stock was trading at around 4x Amazon’s top-line revenues or 16x book value, while today those ratios are a little over 2x and 8x respectively. Over shorter time horizons like 2 years, these changes in market valuation are much more significant drivers of your brokerage account’s market value than any actual performance of AMZN’s business. The reason I like to break down QQQ or SPY into single names like AMZN is that I have much more flexibility in how I view this “numerator” of the Price/Sales and Price/Book ratio changes over these periods. By comparison, I track the relative changes in Price/Earnings ratios in broader US stock market benchmarks like MSCI USA by looking at charts of the Barclays CAPE ratio or from Yardeni Research. Over these past two years, the CAPE ratio of the MSCI USA index declined from around 37.7 in mid-2021 to around 30 today, a roughly 20% decline that is far less than the 50% decline seen in AMZN’s valuation multiple, which explains the above chart.
So for now, I see AMZN as a benchmark for companies with a higher growth rate than the overall market, significantly more expensive valuation than its peers, and as seen above, a more volatile valuation multiple than the market. With that in mind, the next two sections will look at Amazon’s business and growth, followed by an options strategy for managing this valuation volatility.
Amazon’s Path To $1 Trillion In Revenue
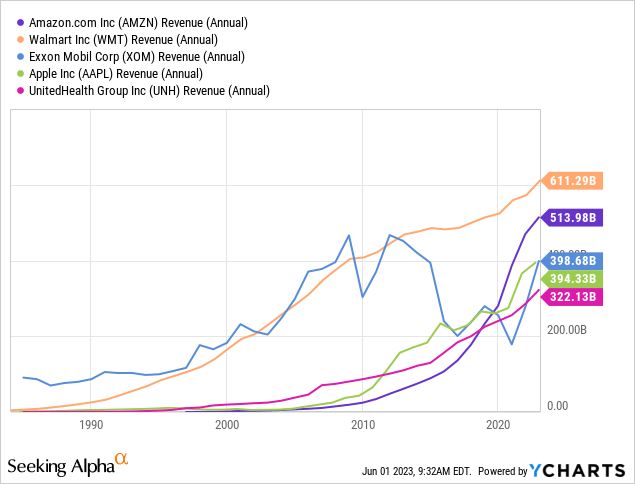
AMZN’s market cap has long been over $1 trillion, and as of this writing, there are four companies with an even larger market cap well over $1 trillion: Apple, Microsoft, Saudi Aramco, and Alphabet. As someone more interested in business fundamentals than market value, the $1 trillion number that interests me more is when we will see the first public company gross over $1 trillion per year in revenues. As of the last reported fiscal year, Amazon is the world’s third highest grossing public company with FY2022 revenues of $514 billion, following Walmart’s $611 billion and Saudi Aramco’s $603 billion. The below chart shows the past 40 years’ annual revenues of the five currently highest-grossing US-listed companies, which seems to indicate that Amazon’s revenue is catching up to Walmart’s quickly and may surpass it in the next few years.
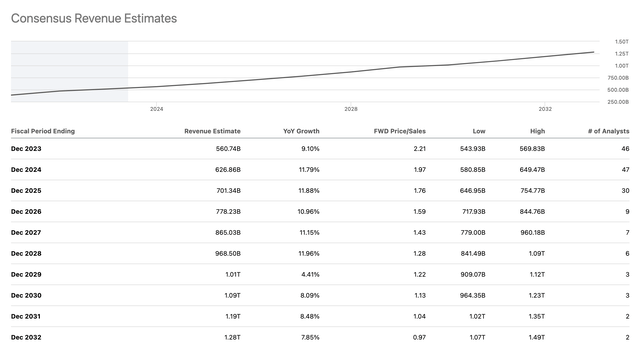
When we look at analyst estimates, the current consensus, screenshot below, is that Amazon’s revenue are expected to hit the $1 trillion mark by fiscal year 2029. The reason I find this long-term projection important is that the 30-46 analysts estimating revenues for years 2023-2025 seem to average out to a median growth rate of around 10% per year, and the 6 analysts going out to 2028 seem to have a consistent estimate of 10% growth for at least the next 5 years.
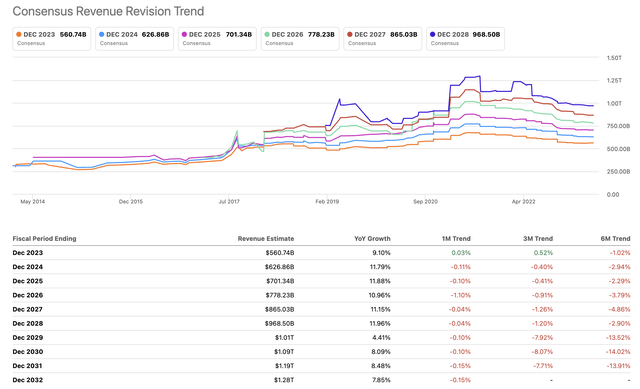
Analyst estimates aren’t perfect, but these 6-46 analysts likely each know far more amount Amazon’s business and financials than I will ever bother reading into, so I find it useful watching their revisions of these estimates as a useful data point. The below chart shows how these estimates of AMZN’s revenues have been revised downward since late 2021, when AMZN was expected to hit this $1 trillion revenue mark as soon as 2026. Focusing in on the 2 year time horizon of this article, the current analyst consensus for AMZN’s 2025 revenues is $700 billion, versus 2 years ago, when analysts expected AMZN’s revenue to hit $875 billion by 2025. One reason 2025 is a good time horizon is that this is also the year that these analyst estimates expect Amazon’s revenues to surpass Walmart’s revenues.
These downward revisions in AMZN’s revenue growth rate probably explain why the market is paying half the Price/Sales and Price/Book ratios for AMZN stock as they were 2 years ago. These revenue revisions seem to still be in a downtrend that has not yet broken, so I might be cautious even about basing my 2025 range for AMZN stock on that $700 billion sales estimate.
Readers familiar with my preference for profitable, dividend paying companies may be surprised that until this point, I have mostly talked about revenue, when of course the ultimate value of a business should be based on what cash profits it produces and can distribute. I use revenue as Amazon’s denominator because Amazon’s bottom line net income number is far more volatile, having been reported as a surprise loss of $2.7 billion last year, down from a profit of $33.4 billion in 2021. That said, as the below clip from Amazon’s 2022 annual report shows, not all revenue and not all growth is created equal. Amazon’s slowest growing and least profitable (biggest losing) segment is its “International” e-commerce and fulfilment business, while its smallest, fastest growing, and most profitable business is its Amazon Web Services cloud computing business.
Amazon 2022 Annual Report, SEC Edgar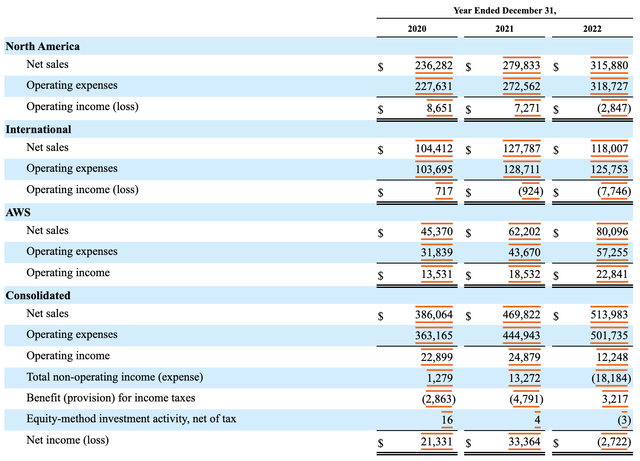
There are some who might argue that, in the long run, it is Amazon’s businesses like cloud computing that will ultimately deliver the value justifying today’s $1.25 trillion market cap. I, on the other hand, am not the kind of investor who likes to pay $1.25 trillion primarily for a small, even fast-growing, business with revenues of only $80 billion and profits of $23 billion, simply because it is bundled with much larger and much less profitable businesses. For that reason, I remain bearish, and the option strategies I recommend in the next section will revolve around buying puts.
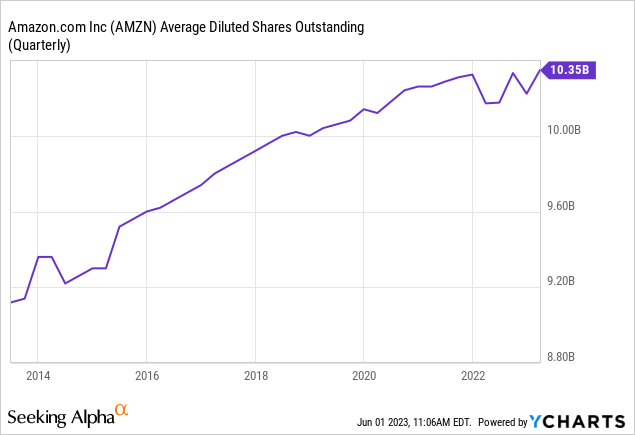
In order to estimate which strike prices of options I should be trading with 2025 expiry, I need to look at one more variable that goes into translating revenues into price per share, and that is the number of shares outstanding. AMZN’s share count has grown somewhat over the past decade, though at a relatively modest rate of only about 1% per year. This is not necessarily a bad thing for a company with a stock as expensive as AMZN’s, as issuing stock at high multiples actually helps grow AMZN’s book value over time, but this does mean I need to assume a bit more dilution between now and 2025, let’s say 10.5 billion shares outstanding.
Option Strategies For AMZN Bears
Zooming in on the chart of AMZN’s Price/Sales ratio to the period of AMZN’s year-to-date 43.5% return, we see that was due to a recovery in AMZN’s Price/Sales ratio from around 1.7 to 2.4. My option strategy will be based on the expectation that AMZN’s Price/Sales ratio will at least collapse back down to 1.7 over the next two years, and likely go even lower if the e-commerce businesses continue to struggle and AWS faces increased competition.
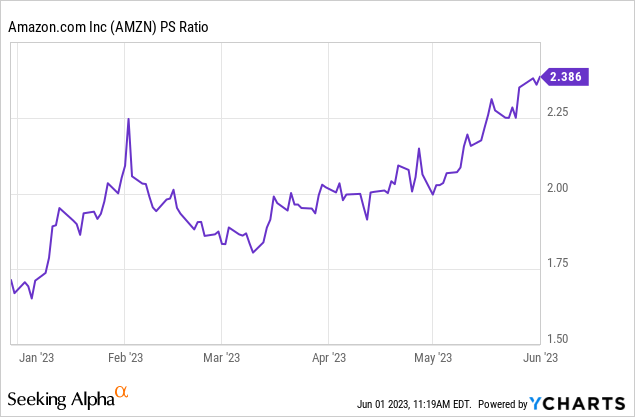
Based on the FY2025 revenue estimate of $700 billion (which as mentioned earlier, I think will more likely be revised down than up), and an assumed 10.5 billion share count, the below table calculates what different Price/Sales ratios of that FY2025 estimate would mean in terms of market cap and share price return. I am of course assuming that Amazon does not initiate its first dividend in the next two years. The rightmost column of return percentages is based on a price for an AMZN share being around $120 today.
| P/S | Market Cap | Price/Share | Return from $120 |
| 3.0 | $ 2,100 | $ 200.00 | 67% |
| 2.7 | $ 1,890 | $ 180.00 | 50% |
| 2.4 | $ 1,680 | $ 160.00 | 33% |
| 2.1 | $ 1,470 | $ 140.00 | 17% |
| 1.8 | $ 1,260 | $ 120.00 | 0% |
| 1.5 | $ 1,050 | $ 100.00 | -17% |
| 1.2 | $ 840 | $ 80.00 | -33% |
Source: Author’s calculation based on above assumptions
Amazon’s strong expected annual growth rate to that $700 billion revenue estimate is why the share price would still be flat even if the Price/Sales ratio declines from 2.4 today to 1.8 in 2025. So unless I am much more bearish than I am, I probably want to look for an option strategy that would profit from AMZN staying flat to declining mildly. After all, I’m not really expecting the market value of this stock to fall much below $1 trillion over the next 2 years, especially not now that the US debt ceiling has been suspended.
Option Strategy #1: 1×2 Put Spread
One option strategy I like for stocks I believe might be around 20% overvalued, but not 100% overvalued, is a 1×2 put spread. In this case, I am looking at the following specific options, all expiring on June 20th 2025:
- Buy 1x 125 strike put, and
- Sell 2x 100 strike puts
One big advantage of this trade is that I can currently put it on at zero up-front cost; I am basically paying for the 125-100 put spread by selling an extra 100 strike put. This means that if AMZN falls to below $100 per share, which I estimated to be around 1.5x sales, I would need to buy 100 shares at $100 per share with this trade. That said, $2,500 of the $10,000 I need to buy those shares would have been paid to me as profit from the put spread, so I am only really exposed to a net loss on this trade if AMZN is below $75 in mid-2025, which would either mean a Price/Sales ratio below 1.2x or significantly lower than $700 billion in revenues that year. In terms of current exposure, this option combination actually has close to “zero delta”, meaning the net value of these options will not move up or down much with the ups and downs of AMZN in the short term, but the value of the two short puts should decay faster than the value of the long put.
Option Strategy #2: In-the-money Put Spread
A different strategy that does have a net negative delta on day one, and more limited downside risk, but at the expense of an upfront cost, is to simply buy puts or put spreads on AMZN. The strikes I am currently looking at for the June 2025 expiration date is to buy the 140 strike put and sell the 120 strike put for a premium of around $10 per share or $1,000 total. This means that if AMZN stock stays flat or falls over the next two years, these options pay me the maximum $2,000 payout, doubling my $1,000 at risk. On the other hand, if AMZN is above 140 by mid-2025, I would lose this $1,000 premium. An equivalent version of this strategy would be to sell the 120-140 call spread, receiving $1,000 up-front with the risk that I would need to pay back $2,000 in 5 years if AMZN finishes above $140 per share. This $10 per share premium is about the same as the current premium for the June 2025 100 strike put outright, which requires a much more bearish view to profit from.
Conclusion
Amazon remains expensive relative to its current mix of its large, low margin e-commerce business and much smaller, though faster growing and higher margin, cloud computing business. I believe both downward revenue revisions, and a reversal if this year’s rise in valuation multiples, are both likely to put downward pressure on AMZN, and in turn on QQQ, over the next two years. I believe this puts AMZN shares in the range of $90-120 per share by mid-2025, and the option strategies described above should prove an effective way of capturing this with limited risk.
Analyst’s Disclosure: I/we have a beneficial long position in the shares of AMZN either through stock ownership, options, or other derivatives. I wrote this article myself, and it expresses my own opinions. I am not receiving compensation for it (other than from Seeking Alpha). I have no business relationship with any company whose stock is mentioned in this article.
My net long position is a small residual one that I've been trimming for many years, and will likely turn into a net short position with the addition of these put spread positions. We also trade SPY and QQQ as hedges, and our net position in both ETFs is currently short.
Seeking Alpha’s Disclosure: Past performance is no guarantee of future results. No recommendation or advice is being given as to whether any investment is suitable for a particular investor. Any views or opinions expressed above may not reflect those of Seeking Alpha as a whole. Seeking Alpha is not a licensed securities dealer, broker or US investment adviser or investment bank. Our analysts are third party authors that include both professional investors and individual investors who may not be licensed or certified by any institute or regulatory body.
Most of my portfolio is in non-US stocks because many foreign markets tend to be faster growing, less competitive, and often more cheaply valued. Join my journey around the world as I share my experience as a long-term expat in search of the best international stock opportunities with a free trial to The Expat Portfolio.


