Summary:
- When I last looked, Amazon management faced serious challenges in Q1 2022, but has addressed them successfully; operating income, operating margin, and cash flows are expanding rapidly.
- The company implemented strategies to address inflationary costs, labor and productivity issues, and FBA overcapacity.
- Despite the share price run-up, I will explain why AMZN stock is not overpriced.
hapabapa
I last wrote to you about Amazon (NASDAQ:AMZN) in May 2022. A link to that article, entitled “Spilling the Ink on Amazon,” is found here. Back then, I considered the stock a “Strong Buy” and despite a 68 percent gain, I remain constructive on the shares.
The underlying thesis remains the same:
- Amazon is a large-moat company that’s an undisputed industry leader, thereby giving the business a measure of pricing power
- Management is adept and effective, as evidenced by the post-pandemic operational and financial turnaround
- Amazon has a superior balance sheet and generates strong cash flow
In this article, I will recap historical context, review several key investment metrics, and offer my opinion on valuation.
The Q1 2022 Backdrop
First quarter 2022 results were not good; given the benefit of hindsight, it marked a low-water mark. Operating income, operating margin, and cash flow were all in the tank.
Back in May 2022, management identified consumer segment (Amazon North America and Amazon International) headwinds were creating incremental costs exceeding $6 billion. They said these costs needed to be wrung out of the business.
The excess costs fell into three buckets:
-
inflationary costs
-
labor and productivity problems
-
FBA (Fulfillment by Amazon) overcapacity
Each issue contributed about $2 billion.
Management Set Out a Plan
Note: charts and tables found below were taken or derived from investment data provided via Amazon’s quarterly results website.
On the 1Q22 earnings conference call, management explained how they planned to address each bucket:
Inflationary costs: Management had announced effective February 1, 2022, Prime Membership fees increased to $139 a year from $119. The move was expected to add ~$4 billion per year to the bottom line. In addition, on April 28, 2022, management instituted a 5% fuel surcharge to Amazon sellers.
Labor and productivity: Management understood they had significant ability to manage labor. Over-staffing was to be handled via attrition and / or layoffs. Automation accelerated the need for less staff.
Over the past two years, Amazon reduced the number of full-time and part-time workers to 1.52 million from 1.61 million. Meanwhile, total consumer segment sales reached $118.2 billion in the most recent quarter, versus $95.0 billion in 1Q2022.
Net consumer sales grew 24 percent, while total employee headcount fell 5.6 percent.
FBA overcapacity: To serve customers during the online pandemic boom, Amazon built out too much warehouse capacity. Total capex was cut in 2022 and further reduced in 2023. Cash paid for operating leases trended up. However, the net total clearly stepped down. Here’s a recap:
Amazon Inc. – Capital and Operating Lease Expenditures ($B)
|
FY 2022 |
FY 2023 |
2024 TTM |
|
|
Capital Expenditures |
63.6 |
52.7 |
53.4 |
|
Operating Lease Exp. |
8.63 |
10.5 |
11.3 |
|
Total |
72.2 |
63.2 |
64.7 |
Since year-end 2022, category expenditures fell by 10.3 percent. As noted earlier, through the same period, total consumer segment sales increased by well over 20 percent.
What’s The Here and Now Tells Us
It appears Amazon management addressed the three major challenges they faced in early 2022.
On a continuum, how did the 1Q2024 results stack up?
Personally, I review a battery of Amazon quarterly financial data. However, my “keep it simple” AMZN investment analysis boils it down to these metrics:
-
operating income growth
-
operating margin
-
free cash flow growth
-
SG&A (Sales, Marketing, General and Administrative) as a function of total revenue
Let’s take investigate further by looking at several 1Q2024 earnings presentation slides and supplemental data found below.
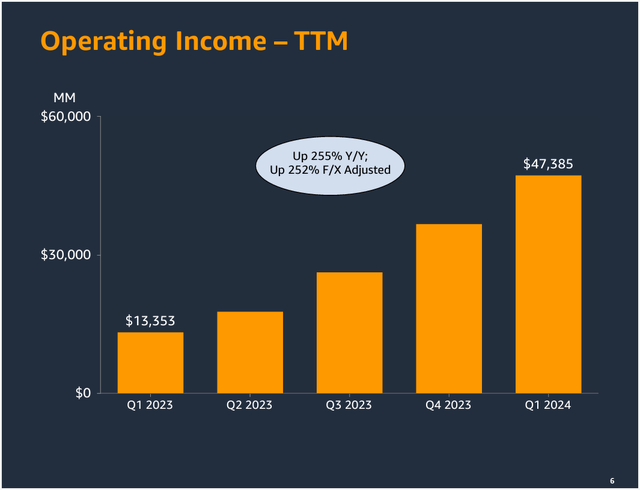
Operating Income
Amazon investor website
Since the first quarter of 2023, trailing twelve-month Operating Income rocketed up by 250 percent.
First quarter 2024 operating income exceeded full year 2022 operating income.
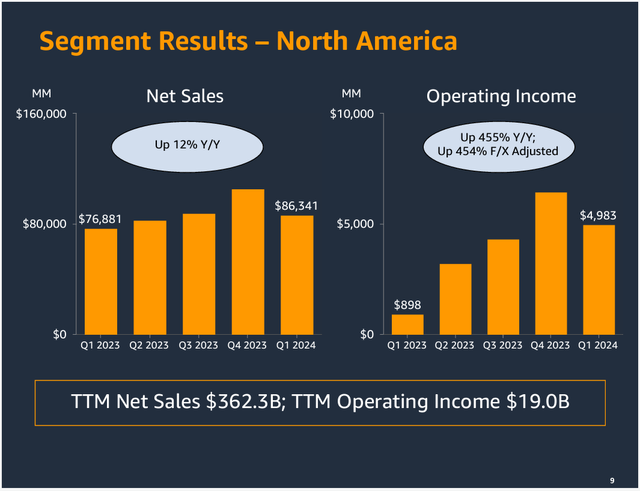
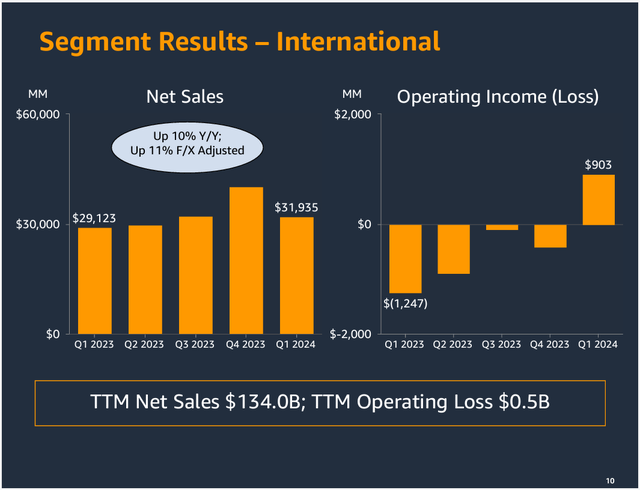
For additional color, here are charts breaking out Amazon’s consumer segment operating income results:
Amazon investor website
Amazon investor website
Year-over-year North America segment operating income more than quadrupled. International op income mirror-reversed, going from a $1.2 billion loss to nearly a $1 billion gain. This segment is a management focus: the turnaround has been remarkable.
Operating Margin
Here’s a table highlighting Amazon’s recent operating margins. I did not break out AWS data. It’s consistently solid and doesn’t alter the investment thesis. AWS margins are included in the “total company” margin results:
Amazon Inc. – Consumer Segment Margin Analysis 1Q2023 to 1Q2024 (%)
|
North America |
International |
Total Company* |
|
|
1Q2023 |
-1.2 |
-4.3 |
3.2 |
|
2Q2023 |
3.9 |
-3.0 |
5.7 |
|
3Q2023 |
4.9 |
-0.3 |
7.8 |
|
4Q2023 |
6.2 |
-0.9 |
7.8 |
|
1Q2024 |
5.8 |
2.8 |
10.7 |
*Includes AWS results
The uptrend is unmistakable. Year-over-year 1Q consumer segment margins are up by ~700 bps. Consolidated company margins tripled.
In May 2022, I modeled AMZN 1Q2022 operating margin without the identified $6 billion headwinds. The result was an 8.3% margin; comparable to the actual 8.2% operating margin from 1Q2021. In the most recent quarter, the company eclipsed that marker, recording a 10.7 percent margin.
Current Amazon margins are above pre-pandemic levels.
Free Cash Flow
Amazon investor website
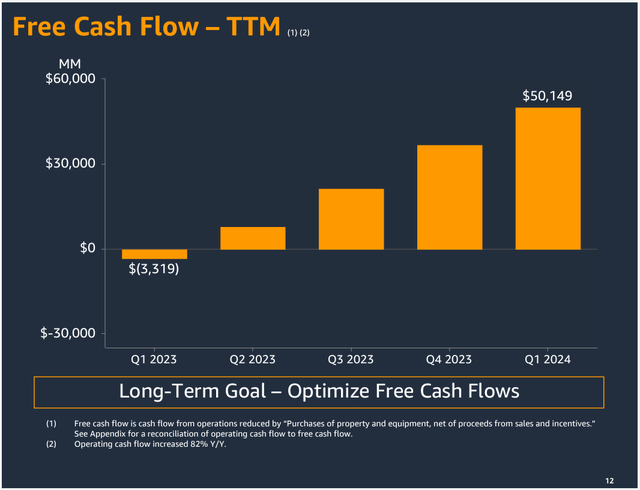
Since 1Q2023, trailing twelve-month free cash flows reversed from negative to positive.
For additional context, full-year 2022 free cash flow was negative $16.8 billion.
SG&A Expenses
In 2022, Amazon management set out to reduce costs to set the company straight again. Concurrently, I began to track total SG&A expense as a function of total revenue. I believe it provides insight as to how effectively the company has reigned in its overhead.
Here’s the bottom line:
Amazon Inc. – SG&A Expense v Revenue
|
FY 2022 |
FY 2023 |
2024 TTM |
|
|
SG&A % |
10.5% |
9.8% |
9.3% |
For additional color, in 2023, Amazon SG&A totaled $56.2 billion. 2022 SG&A was $54.1 billion. As of 1Q2024, reported TTM SG&A was $55.4 billion.
Notably, in early 2022 management made it clear that overhead had to come down. We find the promises were kept. Trailing twelve-month SG&A expenses rose just 2.4 percent between year-end 2022 through the first quarter of this year. This was in the face of significant inflation, particularly in North America. Expense management for a company of this magnitude is no small achievement.
Valuation
The title of this article indicates I believe AMZN stock remains a hot ticket. In this section, I’ll offer the rationale.
Evaluating Amazon stock prices can be tricky. GAAP earnings valuation multiples don’t seem to make a lot of sense; for years, using P/E suggests the stock is overpriced.
Over the past few years, I’ve utilized valuation metrics that appear to “work.”
These include:
-
Price-to-Operating Cash Flow
-
Enterprise Value / EBITDA
Price-to-Cash Flow
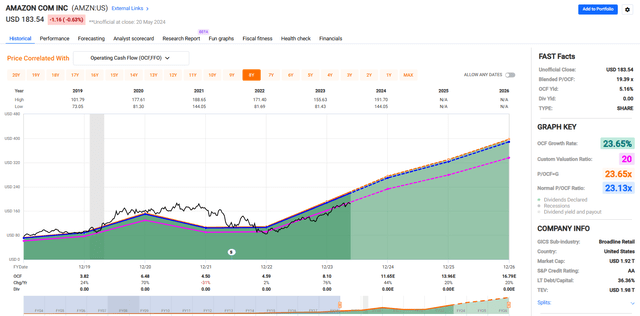
Let’s begin by viewing a long-term FAST Graph.
fastgraphs.com
I selected a chart that goes back to 2019 pre-pandemic. Given the size of the company, going too far back skews results to the high side: it’s easier to grow a smaller company versus a gigantic one.
The six-year normalized P/CF multiple was about 23x during a period when cash flow grew about 24 percent a year.
Conservatively, I placed a 20x multiple (the pink line) on, 2024 expected OCF per share; resulting in a $233 price tag. I added another $8 a share, given Amazon carries this cash per share on the balance sheet. Therefore, after backing out cash, the FVE is $241.
EV-to-EBITDA
I like using EV / EBITDA for Amazon since it incorporates enterprise value: meaning debt, market cap, and balance sheet cash are all stewed into the mix. When evaluating AMZN, I seek to exclude gains or losses from the company’s Rivian investment. Mark-to-market accounting for Rivian makes for noisy numbers.
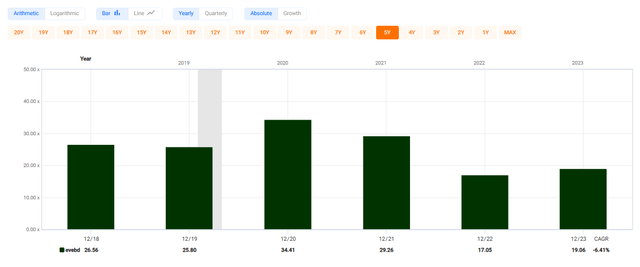
I target 20x as my Fair Value EV/EBITDA multiple and utilize recent 2024 EBITDA estimates. After mid-year, I will plug in the following years’ (FY2025) forecast.
Historically, the following Fast Graph indicates a 20x EV / EBITDA ratio isn’t aggressive.
fastgraphs.com
In 2024, I believe Amazon will generate about $119 billion total EBITDA. My forecast is based upon a year-over-year 16 percent sales increase (as aligned with the past four years’ actuals) and a full-year 18 percent EBITDA margin.
In 2023, Amazon’s EBITDA margin was 15 percent. In 1Q2024, the margin was 19 percent. I eased it to be conservative.
$575 billion 2023 sales * 16 percent increase = $667 billion net sales;
$667 billion * 18 percent EBITDA margin = $120 billion EBITDA
As a comp, CFRA (S&P Global Intelligence) consensus estimates say AMZN will record $150 billion adjusted EBITDA. My estimate does not adjust EBITDA except to exclude any gains or losses from the Rivian investment.
Running the numbers through the formula and solving for share price, Amazon common stock may have a Fair Value of about $220 a share.
Combining the results, my FVE is ~$225. Recent bids on AMZN are about $184.
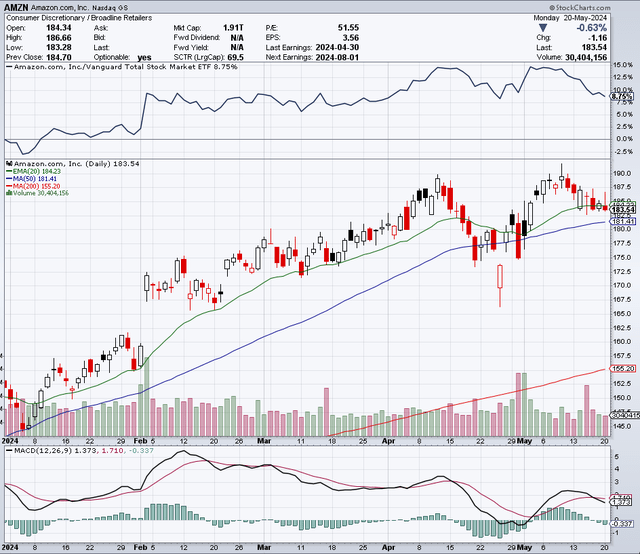
I should point out, especially for the technicians, AMZN stock has bumped its head at the $190 mark twice this year.
stockcharts.com
Such a “double-top” pattern is considered bearish. I ask chartists to opine in the comment section.
Conclusion
When I last wrote to you in May 2022, Amazon stock was facing several serious headwinds. Management identified these, then set out to fix the problems. I was constructive on the company and the stock. My opinion was management was ready to tackle the challenges.
Looking back, it appears management navigated the situation. Key financial metrics turned around along with AMZN stock prices.
Looking forward, in the face of a fine run-up, I believe Amazon shares remain an attractive investment. Currently, while I am cautious on the broad market, AMZN shares look reasonably priced on the fundamentals and are likely to continue to reward investors with good, long-term total returns.
The North America and International consumer segments are performing well. Furthermore, management is focused upon significant opportunities for incremental sales, cash flow, and margin improvement in the consumer international markets. While beyond the scope of this article, AWS remains a potent growth flywheel.
Given the cash-rich, wide-moat business model, I find Amazon represents a business that checks the boxes: a well-managed, best-of-breed company with a sound balance sheet, generates strong cash flow, and the stock currently trades at a fair price.
My current FVE is $225 a share.
Please do your own careful due diligence before making any investment decision. The article is not a recommendation to buy or sell any stock. Good luck with all your 2024 investments.
Analyst’s Disclosure: I/we have a beneficial long position in the shares of AMZN either through stock ownership, options, or other derivatives. I wrote this article myself, and it expresses my own opinions. I am not receiving compensation for it (other than from Seeking Alpha). I have no business relationship with any company whose stock is mentioned in this article.
Seeking Alpha’s Disclosure: Past performance is no guarantee of future results. No recommendation or advice is being given as to whether any investment is suitable for a particular investor. Any views or opinions expressed above may not reflect those of Seeking Alpha as a whole. Seeking Alpha is not a licensed securities dealer, broker or US investment adviser or investment bank. Our analysts are third party authors that include both professional investors and individual investors who may not be licensed or certified by any institute or regulatory body.
