Summary:
- CCL was hit hard during the pandemic, issuing $25.0B in net debt and $2.5B in equity since.
- There was a significant shift of value from shareholders to bondholders, but that process is now on the verge of being reversed.
- Carnival’s Free Cash Flow generation due to higher earnings and lower capex will lead to a better Net Debt/EBITDA ratio, with significantly lower interest expenses.
- The market is likely to take notice before this process is complete and revalue CCL’s shares soon.
Lorraine Boogich
Carnival (NYSE:CCL) (NYSE:CUK) (OTCPK:CUKPF) was hit hard during the pandemic. So hard that, to this day, it continues to struggle with a significant amount of debt, having raised a net amount of $16B in 2020, $7B in 2021 and $2.5B in 2022, while also issuing around $1.2B of Equity in both years of 2021 and 2022.
I stress these numbers to remember readers that when a company issues shares, the historical share price makes no sense anymore. Although obvious to some, mainly those that follow Carnival and remember the share issuance of the past, it may not be for a lot of you. So when you look at the price chart and see that Carnival was trading around $45~$50 before 2020, that doesn’t mean that if the company goes back to normal its share price will go back to this level and therefore the company can multiply by three its market cap.
That $50 share price translates to a Market Cap of $34B, considering the 684 million shares outstanding at the end of their FY’19. The problem lies in the fact that Carnival issued almost 600 million shares during 2021 and 2022, effectively increasing their shares outstanding to almost 1.3 billion. If we divide that $34B pre-pandemic market cap by the new 1.3 billion shares outstanding, we get a share price of $26 dollars, which is roughly 50% above where it is now.
Currently, Carnival is worth a little more than 60% of what it was worth pre-pandemic, even with Revenue of Last Twelve Months (LTM) at $23.4B compared to $20.9M in FY’19. This is because Net Income is still in recovery mode, posting $0.9B in LTM compared to $3.0B in FY’19. The focus of this article is to highlight that Carnival can continue to grow its Revenue and that it is more than capable to bring back its Net Income to a level closer to what it had in FY’19
Market Dynamics
First, I think it’s important we take a look at the market data for cruises. According to the Cruise Lines International Association (CLIA), the number of passengers in cruises is set to continue growing to almost 40 million in 2027 compared to less than 30 million in 2019.
Number of ocean cruise passengers worldwide from 2009 to 2023, with a forecast until 2027 (Statista, CLIA)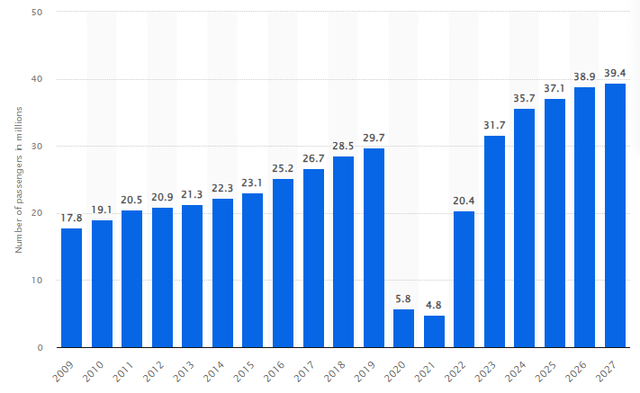
That number by itself isn’t surprising, at least for me. I always thought that as people would get older, they would prefer cruises as they offer an all-inclusive experience with little to no planning required besides booking the cabin. However, my reasoning behind it was that Baby Boomers and, maybe, Generation X were driving the growth, but it seems my initial assumption was incorrect. Based on a quarterly survey run by Statista with people who booked any kind of travel in the last twelve months, the majority of those who booked a cruise reservation were in the Millennials cohort. While “All Respondents” means the entire population of the survey, “Target Audience” means cruise bookers only.
Age of consumers in the U.S., Target Audience is Cruise Bookers (Statista)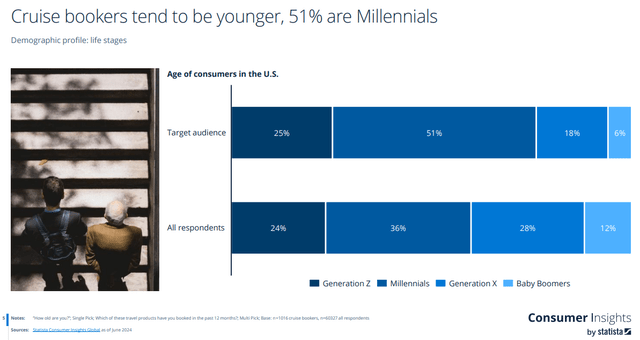
This means that considering all travel options, Millennials skew towards cruises more than Baby Boomers and Generation X, with Generation Z in line in both scenarios. Two other interesting data come from this survey. The fact that cruise bookers have a higher annual household income than all survey respondents (62% in the High bracket versus 34%) and that cruise bookers tend to highlight travel as their main hobby (46% versus 29%).
Share of consumers in the U.S. in the high, middle, and low thirds of household gross income (Statista) Top 10 hobbies and leisure activities of cruise bookers in the U.S. (Statista)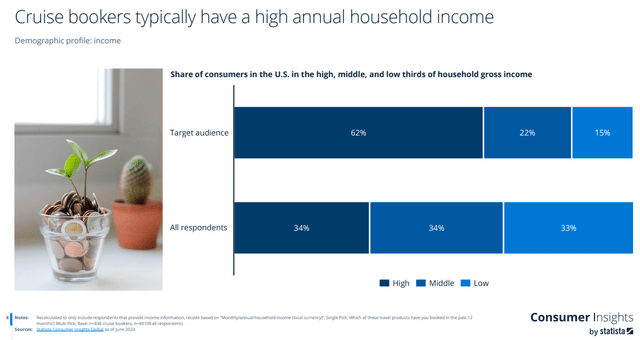
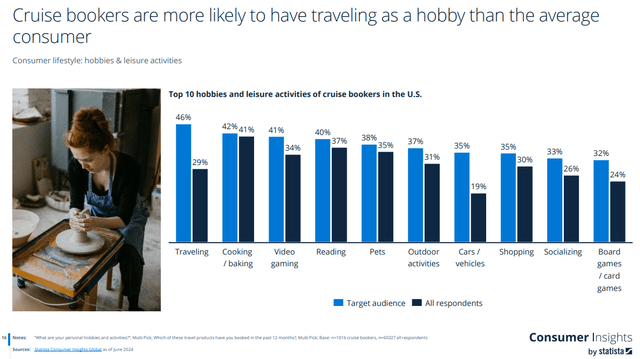
All these data give us enough confidence to believe in the initial forecast of continued market growth for cruises. But that’s not the only good thing. Besides the fact that Millennials are still far from retirement and are probably close to their earnings peak, the idea that cruise bookers have a high household income and put travel as their preferred hobby means that they will likely continue to spend and give preference to continue enjoying the experience instead of cutting down due to a recession, for example.
Enterprise Value & Covid-19
Now let’s deep dive on Carnival’s Enterprise Value and why I think it’s so relevant to understand the future of the company. As mentioned in the introduction, Carnival had to issue a lot of equity and debt during the pandemic to survive. Note from the Enterprise Value below that what happened was a transfer of value from shareholders to bondholders. Prior to 2020, Enterprise Value was around $40B to $60B (on average, $50B) and now it is still at $50B. The big difference is that while before 2019 Market Cap was responsible for 80% to 90% of Enterprise Value, now it’s less than 50%.
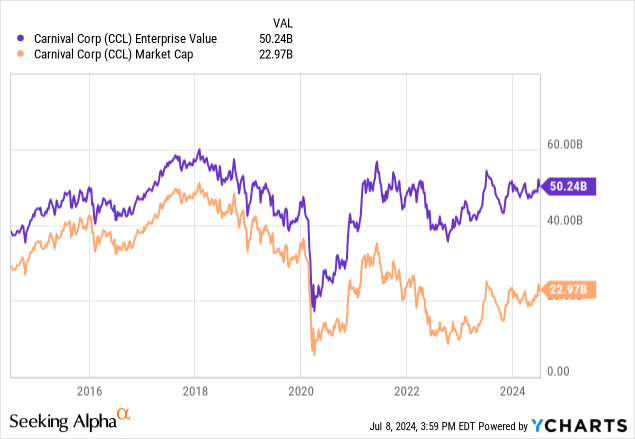
My main argument in this article is that we are at the start of a new transfer: from bondholders to shareholders. Only from recovering the percentage entitled to shareholders of Enterprise Value, this company could double its Market Cap and recover the previous +$40B Market Cap. If we take into consideration the fact that the market continues to grow, it means that Enterprise Value could move up and surpass this ceiling of $50B that it has been stuck at since prior to 2019.
So there are two engines that could propel Carnival’s future: Debt Repayment and Free Cash Flow growth. In theory, each dollar repaid to bondholders is one dollar transferred in value to shareholders. This happens because for each dollar repaid, there will be no interest expense owed related to it anymore, so that dollar can flow to Net Income instead. Debt repayment works in both ways: by transferring part of Enterprise Value back to shareholders and increasing Free Cash Flow. If the market expands, that’s another push towards higher Free Cash Flow.
Debt & Financial Projections
When evaluating Carnival’s P&L, Free Cash Flow and Debt Repayment, I think it’s more interesting to start with what happened with Net Income. After all, it was close to $3.0B in FY’19 and is now less than $1.0B LTM. First, check below the detailed P&L for these two periods, with an added perspective of Vertical Analysis on the right. Note in red the line expenses that increased in representation during these years.
Carnival’s P&L Comparison Between FY’19 and LTM’24, in $M USD (Carnival IR, Seeking Alpha)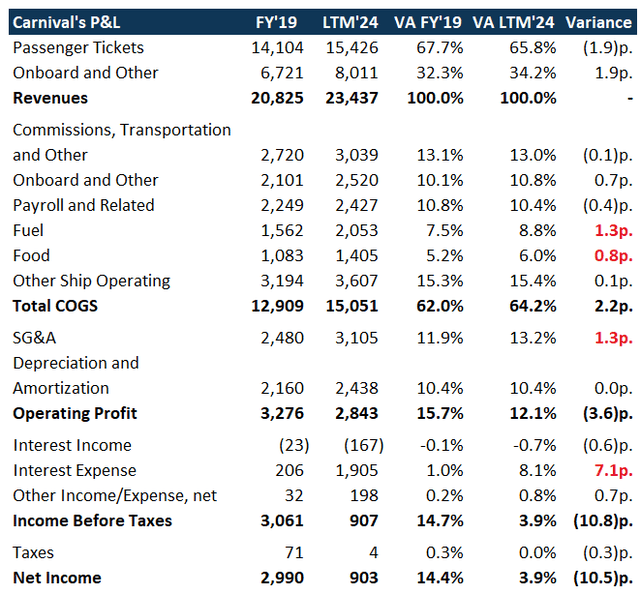
The 7.1p. percentage points increase in Interest Expense represents almost 70% of the entire (10.5)p. percentage points drop in Net Income. The remaining 30% is split between SG&A, Fuel and Food.
Net Income Walk in % FY’19 to LTM’24 (Carnival IR, Seeking Alpha)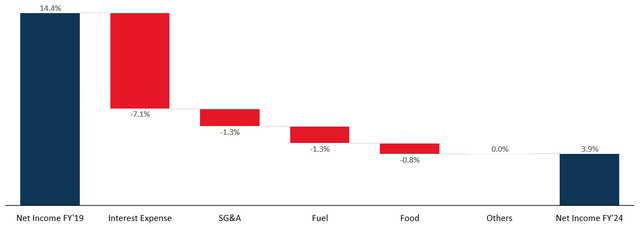
This means that the major shareholder value initiative that Carnival can take is to pay down debt. Paying down debt means that debtholder value will be transferred back to shareholder value because Net Income will significantly grow for each dollar of repayment. Almost $2.0B in Interest Expense is now being paid, versus $0.2B prior to 2020. Since Carnival’s Price to Earnings Ratio (PE) is currently at 15x, this $1.8B differential in Interest Expense is worth $27.0B.
Sure, there is still a little more than 30% (or 3.4p. in Net Income) that come from increases in SG&A, Fuel and Food. My simplistic view is that SG&A and Food will gradually recover as inflation goes down and Carnival is able to pass that on to customers with price hikes or operational leverage. Fuel is a different story, and one that Carnival can’t control. If that (1.3)p. lost is never recovered, that’s fine as long as Carnival is able to repay debt.
To take all that into consideration, we need to model a high-level Free Cash Flow for the next few years to see if Carnival will be able to meaningfully pay down debt. As you can see in the table below, my FCF forecast goes all the way to FY’27 when I believe Carnival will be back to a less than 3.0x Net Debt/EBITDA. More important than that, it shows Net Income at $2.5B, which at a PE of 15x means $37.0B – the 60% price appreciation I mentioned in the title of this article.
FCF Forecast FY’24 to FY’27, in $M USD (Carnival IR, Seeking Alpha, Author)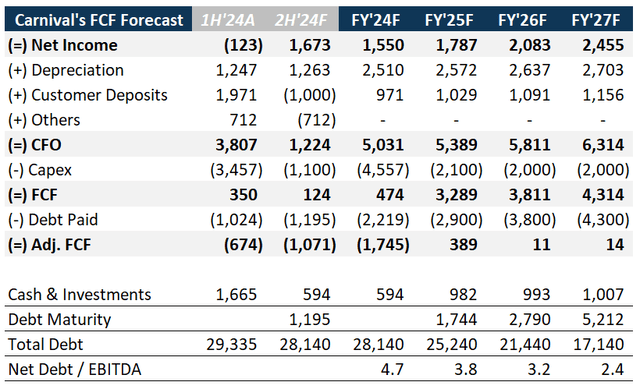
I arrive at this Net Income by estimating components of FCF in 2H’24, FY’25, FY’26 and FY’27 with the following rationale:
Net Income: Grows at 6% per year plus ~6.5% that represents what would have been paid of Interest Expense if Debt Paid in the previous period wasn’t actually paid. I assume no Operational Leverage (like SG&A staying flat with a growing Revenue), so this is an upside on my forecast.
Depreciation: Grows at 2.5% per year, aligned with historical data.
Customer Deposits: Prior to 2020, this line would grow by $0.5B per year, but since 2021 has been growing at more than $1.0B per year. I have kept this $1.0B run-rate, but note that a drop to $0.5B between FY’25 and FY’27 would only cost around $100M in Interest Expense for FY’27, so not a material impact.
Others: The sum of these lines should trend towards zero, as Deprecation and Customer Deposits are the main source of Cash Adjustments in Cash Flow from Operations.
Capex: Modeled after the company’s forecasts of slower capex towards newbuilds and expected organic Capex. It is in line with comments from the CFO in its latest earnings call:
Looking forward, we expect substantial free cash flow driven by our ongoing operational execution and the lowest newbuild order book in decades to deliver continued improvements in our leverage metrics and balance sheet, Bernstein added.
Debt Paid: This is the key component of FCF forecast and Carnival’s valuation. Higher or lower rate of Debt Repayment changes the entire market capitalization forecast. The idea here is that Carnival prior to 2020 operated with around $0.5B of Cash & Equivalents and that preference has changed to $1.0B due to high leverage, so I kept that as a constraint. Then we used almost all cash generated by the company to pay down debt. In FY’25 and FY’26 this means paying down more debt than matures, but not in FY’27. In any case, this allows the company to rapidly approach a Net Debt/EBITDA ratio of 2.0, which is closer to its pre-pandemic norm.
Risks
Since we are reviewing a highly leveraged company, risks are mainly related to its incapacity to generate meaningful cash flow to run the business, invest and pay down debt. An economic downturn, changes in consumers’ preferences and/or price weaknesses could all be a trigger for Carnival to not be able to generate the Free Cash Flow I estimated and thus pay down debt. The weak point in the analysis is simple: If Carnival can’t pay down its debt in a consistent and timely manner, then shareholders will run very fast.
Final Thoughts
As any company with significant debt, Carnival will be sensible to any change in the macroeconomic and interest rate scenario. I do expect some bumpiness in the short-term, similar to what it had during 1H’24 (going as low as $14 and as high as $18), but every quarter that passes that Carnival continues to post positive Free Cash Flow and Debt Repayments means more certainty for shareholders on the future prospect of the company. Even if my analysis shows a potential $2.5B Net Income in FY’27 with $37.0B in Market Cap, that doesn’t mean the market will take that long to value Carnival accordingly. But if it does, that still means a ~17% CAGR from here to FY’27, without including any possible future dividends.
Analyst’s Disclosure: I/we have a beneficial long position in the shares of CCL either through stock ownership, options, or other derivatives. I wrote this article myself, and it expresses my own opinions. I am not receiving compensation for it (other than from Seeking Alpha). I have no business relationship with any company whose stock is mentioned in this article.
Seeking Alpha’s Disclosure: Past performance is no guarantee of future results. No recommendation or advice is being given as to whether any investment is suitable for a particular investor. Any views or opinions expressed above may not reflect those of Seeking Alpha as a whole. Seeking Alpha is not a licensed securities dealer, broker or US investment adviser or investment bank. Our analysts are third party authors that include both professional investors and individual investors who may not be licensed or certified by any institute or regulatory body.
