Summary:
- In today’s article, I will demonstrate why I incorporated Bank of America into The Dividend Income Accelerator Portfolio.
- I will show you in detail why I selected Bank of America over competitors such as JPMorgan, Wells Fargo, and Citigroup.
- I believe that Bank of America is the most attractive pick among its peer group in terms of Valuation, and the best choice to combine dividend income with dividend growth.
- With the addition of Bank of America, The Dividend Income Accelerator Portfolio’s Weighted Average Dividend Yield [TTM] stands at 3.83%.
ProArtWork
Investment Thesis
In today’s analysis, I will dive deeper into the U.S. Banking Industry. I’ll take a closer look at Bank of America Corporation (NYSE:BAC), JPMorgan Chase & Co. (JPM), Wells Fargo & Company (WFC) and Citigroup Inc. (C) and will let you know why I currently believe that Bank of America is the most attractive choice among them.
Furthermore, I will demonstrate why I believe that Bank of America is the pick that most aligns with the investment approach of The Dividend Income Accelerator Portfolio at this moment in time.
I believe that Bank of America is particularly attractive for investors due to its currently low Valuation. The bank’s P/E [FWD] Ratio stands at 7.70, which is 34.50% below its Average from the past 5 years.
Moreover, I strongly believe that Bank of America is an excellent fit for The Dividend Income Accelerator Portfolio, given its combination of dividend income (its Dividend Yield [FWD] stands at 3.68%) and dividend growth (its Dividend Growth Rate [CAGR] over the past 5 years lies at 12.30%).
After the incorporation of Bank of America into The Dividend Income Accelerator Portfolio, the portfolio offers investors a Weighted Average Dividend Yield [TTM] of 3.83%. Moreover, it has delivered a Weighted Average Dividend Growth Rate [CAGR] of 10.15% over the past 5 years, signaling its capacity to continuously boost your income year after year.
The Performance of the 4 largest U.S. banks in 2023
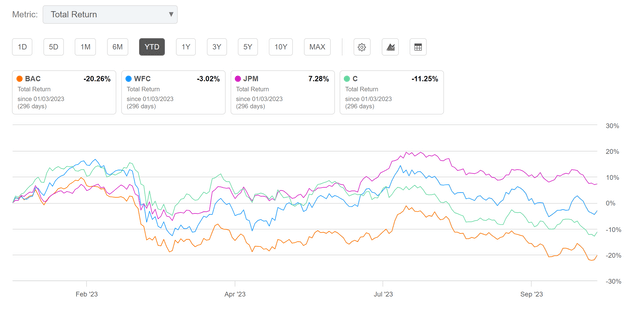
Among the four largest U.S. banks in terms of Market Capitalization, Bank of America exhibited the weakest performance among its peer group in 2023.
While JPMorgan has shown a positive performance of 7.28%, the performance of the three other banks has been negative: Wells Fargo’s performance in 2023 has been -3.02%, Citigroup’s has been -11.25%, and Bank of America’s has been -20.26%.
Bank of America’s weak performance in 2023 has contributed to its current availability at an attractive price level. Today, Bank of America has an attractive P/E [FWD] Ratio of 7.70.
The Dividend Income Accelerator Portfolio
The Dividend Income Accelerator Portfolio’s objective is the generation of income via dividend payments, and to annually raise this sum. In addition to that, its goal is to attain an appealing Total Return when investing with a reduced risk level over the long term.
The Dividend Income Accelerator Portfolio’s reduced risk level will be reached due to the portfolio’s broad diversification over sectors and industries and the inclusion of companies with a low Beta Factor.
Below you can find the characteristics of The Dividend Income Accelerator Portfolio:
- Attractive Weighted Average Dividend Yield [TTM].
- Attractive Weighted Average Dividend Growth Rate [CAGR] 5 Year.
- Relatively low volatility.
- Relatively low risk level.
- Attractive expected reward in the form of the expected compound annual rate of return.
- Diversification over asset classes.
- Diversification over sectors.
- Diversification over industries.
- Diversification over countries.
- Buy-and-Hold suitability.
Bank of America’s Dividend and Dividend Growth and the Projection of its Yield on Cost
Today, Bank of America pays shareholders an attractive Dividend Yield [TTM] of 3.45% and a Dividend Yield [FWD] of 3.68%.
It is worth noting that the bank’s current Dividend Yield [FWD] of 3.68% stands significantly above its average from the past 5 years (which is 2.43%). These numbers provide us with evidence that Bank of America is currently undervalued.
The bank has also shown strong metrics when it comes to dividend growth: it has produced a Dividend Growth Rate [CAGR] of 12.03% over the past 5 years, which is 70.32% above the Sector Median.
The bank’s strength in terms of dividend growth is further confirmed by its EBIT Growth Rate [FWD] of 7.47%, lying 81.93% above the Sector Median.
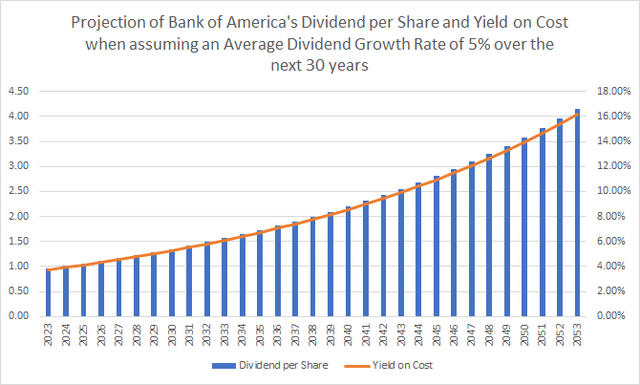
Below you can find a projection of Bank of America’s Dividend and Yield on Cost. This projection assumes that you would buy shares at its current share price of $25.65 and that the bank would be able to raise its Dividend with an Average Dividend Growth Rate [CAGR] of 5% for the following 30 years. This conservative assumption is based on Bank of America’s Dividend Growth Rate [CAGR] of 7.72% over the past 3 years.
Why I have selected Bank of America over its competitors JPMorgan, Wells Fargo and Citigroup
Given its combination of dividend income and dividend growth, I believe that Bank of America is the most attractive choice when compared to its competitors. Bank of America currently pays a Dividend Yield [FWD] of 3.68%, which is above the ones of Wells Fargo (3.53%) and JPMorgan (2.98%). Only the Dividend Yield [FWD] of Citigroup is higher (5.39%).
In terms of Dividend Growth, Bank of America also seems to be the most attractive pick for investors among the four. Bank of America has shown a Dividend Growth Rate [CAGR] of 12.03% over the past 5 years, while JPMorgan’s is 10.31%, Citigroup’s is 7.88%, and Wells Fargo’s is negative (-4.82%).
This combination of dividend income and dividend growth makes Bank of America an excellent choice to be added to The Dividend Income Accelerator Portfolio.
It can further be highlighted that, with a P/E [FWD] Ratio of 7.70, Bank of America’s Valuation is below the one of JPMorgan (P/E [FWD] Ratio of 8.46) and Wells Fargo (7.86). However, it is slightly above the one of Citigroup (6.45).
In addition to that, it should be noted that Bank of America’s P/E [FWD] Ratio of 7.70 stands 34.50% below its average from the past 5 years, further indicating that the bank is currently undervalued.
In terms of Revenue and Profitability, however, I see Bank of America as being in second place, behind JPMorgan but in front of Wells Fargo and Citigroup.
While JPMorgan has shown a Revenue Growth Rate [CAGR] of 13.32% over the past 3 years, Bank of America’s is 8.59%, Citigroup’s is 8.39%, and Wells Fargo’s is 7.95%.
In terms of Profitability, JPMorgan leads its peer group with the highest Net Income Margin and the highest Return on Equity (35.98% and 16.93% respectively) when compared to its peer group.
Bank of America also exhibits strong Profitability: its Net Income Margin and its Return on Equity (31.52% and 10.96% respectively) stand well above the ones of Wells Fargo (24.00% and 9.95%) and Citigroup (18.87% and 6.71%). Bank of America’s attractive profitability metrics make it an excellent choice for The Dividend Income Accelerator Portfolio.
I am closely monitoring JPMorgan for potential inclusion in The Dividend Income Accelerator Portfolio, due to its enormous profitability and excellent metrics in terms of growth as well as its strong competitive advantages.
However, at this moment in time, I believe that Bank of America is even more attractive for inclusion, given its attractive Valuation and synergy of dividend income and dividend growth.
|
BAC |
WFC |
JPM |
C |
|
|
Company Name |
Bank of America |
Wells Fargo |
JPMorgan |
Citigroup |
|
Sector |
Financials |
Financials |
Financials |
Financials |
|
Industry |
Diversified Banks |
Diversified Banks |
Diversified Banks |
Diversified Banks |
|
Market Capitalization |
206.96B |
144.24B |
409.06B |
75.76B |
|
P/E GAAP [FWD] |
7.70 |
7.86 |
8.46 |
6.45 |
|
Dividend Yield [FWD] |
3.68% |
3.53% |
2.98% |
5.39% |
|
Dividend Growth 5 Yr [CAGR] |
12.03% |
-4.82% |
10.31% |
7.88% |
|
Consecutive Years of Dividend Growth |
9 Years |
1 Year |
9 Years |
0 Years |
|
Payout Ratio |
25.21% |
23.09% |
24.18% |
34.86% |
|
Revenue 3 Year [CAGR] |
8.59% |
7.95% |
13.23% |
8.39% |
|
Net Income Margin |
31.52% |
24.00% |
35.98% |
18.87% |
|
Return on Equity |
10.96% |
9.95% |
16.93% |
6.71% |
|
60M Beta |
1.39 |
1.17 |
1.10 |
1.55 |
Source: Seeking Alpha
Why Bank of America aligns with the investment approach of The Dividend Income Accelerator Portfolio
- Bank of America has strong competitive advantages and is financially healthy (underlined by its A1 credit rating from Moody’s, its Net Income Margin [TTM] of 31.52%, and Return on Equity of 10.96%), aligning strongly with the approach of The Dividend Income Accelerator Portfolio.
- The bank currently pays an attractive Dividend Yield [FWD] of 3.68%, which is significantly above its average from the past 5 years (2.43%). This number indicates that it can help you generate extra income via dividend payments, fulfilling another objective of The Dividend Income Accelerator Portfolio.
- The bank’s Dividend Growth Rate [CAGR] over the past 5 years stands at 12.03%, indicating that it should be able to raise this dividend on an annual basis, aligning with another objective of The Dividend Income Accelerator Portfolio.
- Its Payout Ratio currently stands at a relatively low level of 25.21%. This number further underlines that the U.S. bank should be able to pay a sustainable dividend while being able to raise this dividend in the coming years, once again aligning with the approach of The Dividend Income Accelerator.
- With a P/E [FWD] Ratio of 7.70, which is 34.50% below its average from the past 5 years and 14.59% below the Sector Median, I believe that Bank of America is currently undervalued. Therefore, I am convinced that the reward can be attractive for investors when investing with a long-term horizon.
- For the reasons mentioned above, I believe that Bank of America is an excellent choice in terms of risk and reward, aligning strongly with the investment approach of The Dividend Income Accelerator Portfolio.
Investor Benefits of The Dividend Income Accelerator Portfolio after Investing $100 in Bank of America
After the inclusion of Bank of America into The Dividend Income Accelerator Portfolio, I strongly believe that we have further diversified our investment portfolio, while at the same time, optimizing it in regards to its risk/reward profile.
I believe that Bank of America is a pick that comes attached to a relatively low-risk level (when investing over the long term), giving us the chance of obtaining an attractive return. For these reasons, I aim to overweight the Bank of America position within The Dividend Income Accelerator Portfolio.
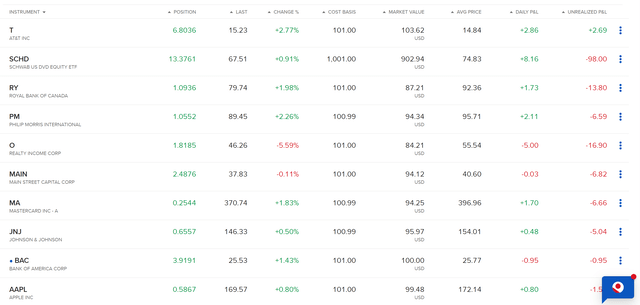
After the inclusion of Bank of America into The Dividend Income Accelerator Portfolio, the Weighted Average Dividend Yield [TTM] of the portfolio stands at 3.83%. It is also worth noting that the portfolio’s Weighted Average Dividend Growth Rate [CAGR] over the past 5 years stands at 10.15%.
Below you can find an overview of the current positions of The Dividend Income Accelerator Portfolio.
Risk Factors
While I believe that Bank of America’s current Valuation provides investors with an excellent investment opportunity, it is important to consider risk factors that come attached to an investment in the U.S. bank. Among these risk factors that you should have in mind, I would like to highlight the following:
Credit Risks
A risk factor that can have a significant impact on Bank of America’s financial performance is credit risk. Credit risk arises from the inability of a borrower to meet its obligations.
Even though Bank of America does have a long track record of risk management, the inability of a borrower to meet their obligations could have a significant impact on the bank’s financial performance over the short term, representing a risk factor for you as an investor.
Market Risks
Another risk factor that can have an impact on Bank of America’s financial performance is market risks. Changing market conditions, for example, could have a relatively strong negative impact on the bank’s earnings, representing another risk factor for investors. Additional examples of market risk are interest rate risk, foreign exchange risk, mortgage risk, equity market risk and commodity risk.
Operational Risks
An additional risk factor that Bank of America faces are operational risks, which for example, can arise from inadequate internal processes. Further examples of operational risks include model risks, conduct risks, technology risks, and legal risks.
These operational risks can also have a significant effect on the bank’s financial performance, particularly over the short term.
Risk Factors Summary
I believe that all of these risk factors can indeed have a significant impact on the bank’s financial performance over the short term.
Over the long term, however, I believe that Bank of America will be able to face these challenges, particularly due to its significant competitive advantages (such as its broad and diversified product portfolio, its large customer base, in combination with its strong brand image, etc.), and its enormous financial health (underscored by its A1 credit rating from Moody’s, and its Net Income Margin of 31.52%), in addition to its expertise in risk management.
For these reasons, I recommend investing in Bank of America over the long term, and not to speculate over the short term. This approach aligns with the investment strategy of The Dividend Income Accelerator Portfolio, which has a long-term investment horizon.
Conclusion
I am convinced that Bank of America is an excellent addition to The Dividend Income Accelerator Portfolio. With a P/E [FWD] Ratio of 7.70, which lies 34.50% below its average from the past 5 years, the bank’s Valuation is currently attractive for investors.
In addition, I firmly believe that Bank of America provides investors with a great mix of dividend income and dividend growth. The bank’s current Dividend Yield [FWD] stands at 3.68%, and its 5 Year Dividend Growth Rate [CAGR] is at 12.03%.
Therefore, I believe that Bank of America is currently even more attractive than its competitors JPMorgan, Wells Fargo, and Citigroup. Out of the banks mentioned, it aligns most closely with the investment approach of The Dividend Income Accelerator Portfolio.
However, JPMorgan, Wells Fargo, and Citigroup remain on my watchlist for potential inclusion in The Dividend Income Accelerator Portfolio. I believe that JPMorgan could be an excellent addition to due to its enormous profitability and growth perspective. Like Bank of America, I see JPMorgan as being capable of providing investors with a mix of dividend income and dividend growth.
After the incorporation of Bank of America into The Dividend Income Accelerator Portfolio, it can be highlighted that the portfolio provides investors with a Weighted Average Dividend Yield [TTM] of 3.83%. It further offers investors a 5-Year Weighted Average Dividend Growth Rate [CAGR] of 10.15%.
During this journey of wealth creation, while investing with a reduced risk level, I believe that Bank of America can play a key role in helping us generate extra income while increasing the amount annually. This will assist in ensuring that the companies we invest in help us to cover our monthly expenses.
Author’s Note: Thank you for reading! I would appreciate hearing your opinion on my selection of Bank of America as the 10th acquisition for The Dividend Income Accelerator Portfolio. I also appreciate any thoughts about The Dividend Income Accelerator Portfolio or any suggestion of companies that would fit into its investment approach!
Analyst’s Disclosure: I/we have a beneficial long position in the shares of BAC, JPM, WFC either through stock ownership, options, or other derivatives. I wrote this article myself, and it expresses my own opinions. I am not receiving compensation for it (other than from Seeking Alpha). I have no business relationship with any company whose stock is mentioned in this article.
Seeking Alpha’s Disclosure: Past performance is no guarantee of future results. No recommendation or advice is being given as to whether any investment is suitable for a particular investor. Any views or opinions expressed above may not reflect those of Seeking Alpha as a whole. Seeking Alpha is not a licensed securities dealer, broker or US investment adviser or investment bank. Our analysts are third party authors that include both professional investors and individual investors who may not be licensed or certified by any institute or regulatory body.


