Summary:
- Stocks added to the Dow Jones Industrial Average, or DJIA, often underperform, while those deleted frequently outperform, suggesting Nvidia Corporation’s inclusion may not be bullish.
- Historical DJIA changes show cyclical stocks are often added at highs and deleted at lows, cautioning against over-optimism for Nvidia.
- The S&P 500 has outperformed the DJIA since 2010, highlighting the limitations of the DJIA’s 30-stock composition in reflecting the broader market.
- NVDA’s inclusion mirrors Intel’s 1999 peak entry and subsequent decline, reinforcing a cautious stance on NVDA’s future performance.
BING-JHEN HONG
Nvidia Corporation (NASDAQ:NVDA) was added into the Dow Jones Industrial Average aka DJIA (DJI) on November 8, 2024. Many news articles cheer this as a sign of NVDA’s dominance (in particular as it is replacing Intel (INTC), which has been struggling recently). But surprisingly little has been written on how stocks perform after inclusion into the DJIA. Is being included into the DJIA really a bullish sign with earnings coming up on November 20th? Let’s find out.
1. How stocks that were added to or deleted from the DJIA actually performed
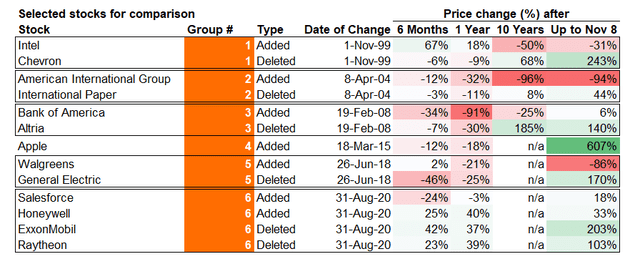
The DJIA has been around since 1896, so we’ll focus on recent history. I have selected some component changes since 1999. Note that these are not all the changes (which would be too numerous to delve into), and are on a split adjusted basis for comparability. The results are still somewhat stunning:
DJIA addition deletion comparisons (Google Finance)
Group 1 (1999 batch):
It may be surprising to learn that Intel (INTC) was included into the DJIA in 1999, near the peak of the dotcom bubble. After its inclusion, its stock price was still up 67% 6 months later, but 25 years later, its stock price is 31% lower than the day it joined the DJIA.
Chevron (CVX), which was deleted from the DJIA in the same batch (though not necessarily corresponding to INTC), has seen a 243% gain in the same period.
Group 2 (2004 batch):
In 2004, American International Group (AIG) was added to the DJIA. With hindsight, AIG was probably taking a lot of risk that culminated in big losses during the financial crisis and is still down 94% 20 years later. International Paper (IP) was deleted, but since then, has eked out a 44% gain.
Group 3 (2008 batch):
Right before the 2008 financial crisis began, Bank of America (BAC) was added to the DJIA while Altria (MO) was deleted. BAC proceeded to fall 90% within a year and is barely positive 6% after 16 years. Altria (MO), being a tobacco company, has delivered consistent returns during the period with a respectable 140% gain.
Group 4 (2015):
Apple (AAPL) was brought into the DJIA in 2015, which was probably one of the best moves among the above samples. Note that AAPL fell 6 months and 1 year after inclusion before gaining an astounding 607% up to now.
Group 5 (2018 batch)
Walgreens (WAL) was added, and the stock price is down 86% by now as the retail pharmacy business faced stiff competition from online channels, while General Electric (GE) was removed. In hindsight, these were near bottom levels for GE while WAL was entering terminal decline.
Group 6 (2020 batch):
Salesforce (CRM), a tech company was added and only managed an 18% gain up to now, while Exxon Mobil (XOM) was deleted at what apparently was near the bottom and is up 203% in barely four years.
Summary:
Strangely enough, it appears many DJIA component deletions actually outperformed the additions. This sort of mirrors the “Dogs of the Dow” strategy whereby investors would buy the Dow components with the highest dividend yield, though in this case, a more appropriate name might be “Drop-outs of the Dow.”
Of course, the above is a select sample, so there have been good decisions not reflected above (e.g., removing Kodak in 2004 (which later on went to bankruptcy in 2012) and adding Home Depot in 1999, which has gone up nearly 700% since its inclusion). But the mixed results should give the reader pause on how bullish NVDA’s inclusion into DJIA means. From DJIA’s historical track record, NVDA’s inclusion likely isn’t a bullish sign at all, in my opinion, this may be due to:
- A: Cyclical stocks being deleted at lows and added at highs.
Removing CVX in 1999, IP in 2004, XOM in 2020 and adding AIG in 2004, BAC in 2008 were good examples of this
- B: Adding “exciting” stocks and swapping out “boring” stocks.
Adding INTC and MSFT in 1999 and tech stocks in 2020, removing MO in 2008, GE in 2018 etc.
Now I’m not knocking whichever committee decides these component changes. I probably wouldn’t do much better myself. However, the results of the past 20 years show NVDA’s DJIA inclusion is not reason for excitement and may very well be room for caution. This brings me to my next point.
2. DJIA performance vs. S&P 500
If we use DJIA ETF (DIA) and S&P 500 ETF (SPY) to approximate for returns from the DJIA and S&P 500 (SP500), we see the following:
| Price on Dec. 31 2009 | Price on Nov. 8 2024 | % change | |
| DIA | 104.07 | 440.11 | 323% |
| SPY | 111.44 | 598.19 | 437% |
SPY has substantially outperformed the DIA since 2010, probably because it has 500 stocks which gives it more room to be inclusive of all sectors, while DIA only has 30 components. While 30 component stocks might have made sense in 1896 as the stock market then was mainly railroads, banks and some industrial companies, it’s likely a lot harder to reflect the US economy and stock market with 30 components.
3. Implications for NVDA
NVDA’s inclusion into DJIA is not a reason to cheer, but a reason to be cautious. I compared NVDA to INTC in my previous piece and ironically this matches INTC’s history with DJIA. INTC was included into the DJIA in 1999 near the peak and has declined 31% in those 25 years before it was unceremoniously removed from the DJIA on November 8, 2024, replaced with NVDA, the latest hot thing. INTC was included into the DJIA for CPUs and is still making CPUs when it got removed, while NVDA is making GPUs, which is really quite similar. Perhaps NVDA will follow INTC’s history with the DJIA.
NVDA has surged further since my latest bearish piece (which was published when NVDA was at $137/share, on Nov. 8 at $147/share). But the greater the euphoria, the greater the caution needed, and I continue my bearish stance. I would not advise shorting into this strong momentum but investors that are long NVDA should consider gauging how much risk is advisable for them.
Analyst’s Disclosure: I/we have no stock, option or similar derivative position in any of the companies mentioned, and no plans to initiate any such positions within the next 72 hours. I wrote this article myself, and it expresses my own opinions. I am not receiving compensation for it (other than from Seeking Alpha). I have no business relationship with any company whose stock is mentioned in this article.
Seeking Alpha’s Disclosure: Past performance is no guarantee of future results. No recommendation or advice is being given as to whether any investment is suitable for a particular investor. Any views or opinions expressed above may not reflect those of Seeking Alpha as a whole. Seeking Alpha is not a licensed securities dealer, broker or US investment adviser or investment bank. Our analysts are third party authors that include both professional investors and individual investors who may not be licensed or certified by any institute or regulatory body.
