Summary:
- Palantir surged 20%, surpassing the $64 target, with a revised price target of $89.
- Remaining Performance Obligations jumped 58% YoY to $1.57 billion, with long-term RPO surging 95%.
- Billings increased 50% YoY to $823 million in Q3 2024, showcasing efficient revenue conversion from contracts.
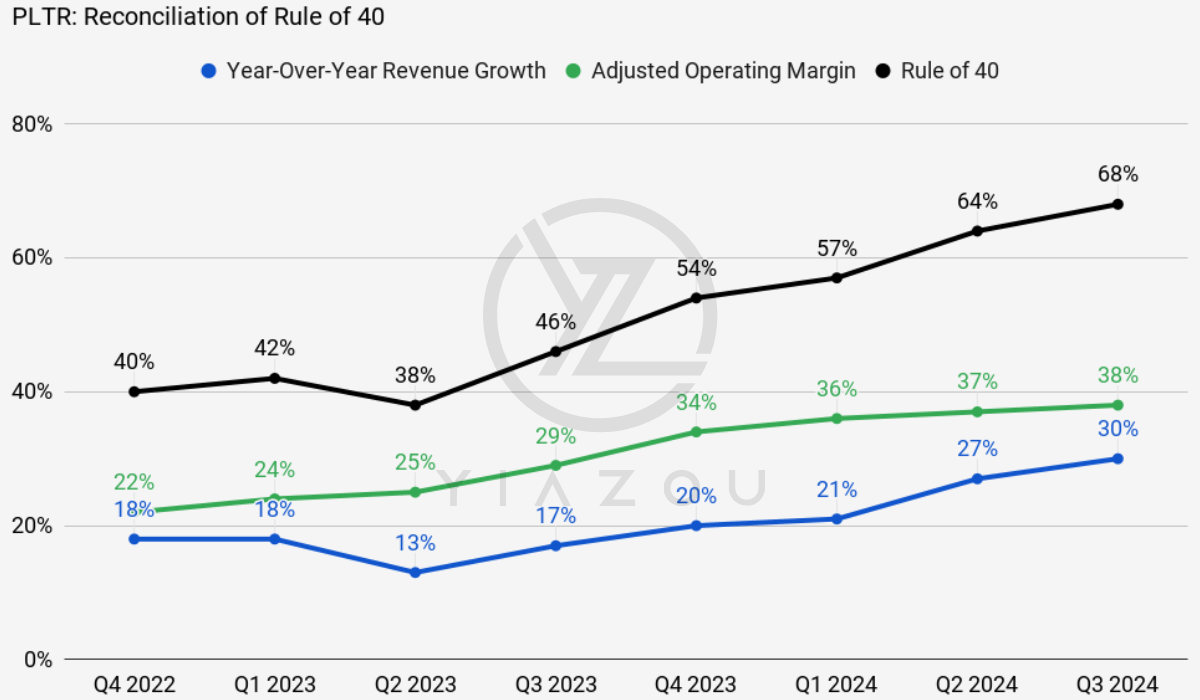
- Rule of 40 improved from 40% to 68%, driven by operating margin growth from 22% to 38%.
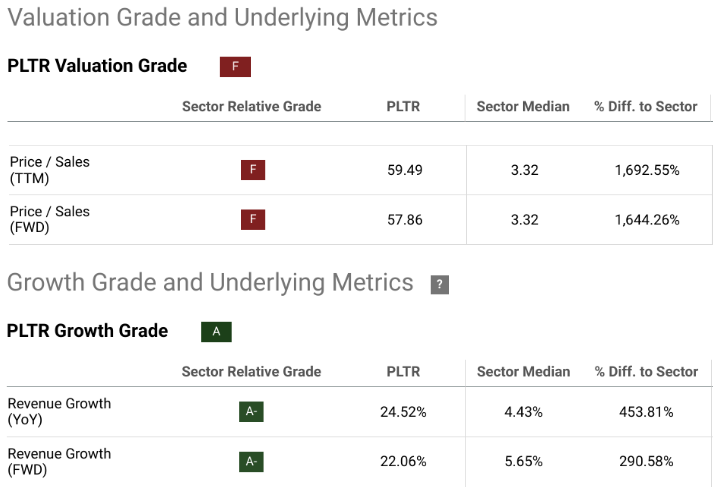
- Palantir’s P/S ratio stands at 59.49, a 1,693% premium over the sector median, highlighting speculative risks.
piranka
Investment Thesis
In our previous report, Palantir Technologies Inc. (NASDAQ:PLTR) surged 20% to our previous target of $64 with resilience. This momentum reaffirms the company’s solid foothold as a dominant force in AI-driven enterprise solutions. An expanding contract pipeline, improving profitability, and strategic focus on high-growth markets mean Palantir continues to deliver on long-term growth potential. Although some short-term volatility might persist, I am bullish on the stock with a price target revised to $89.
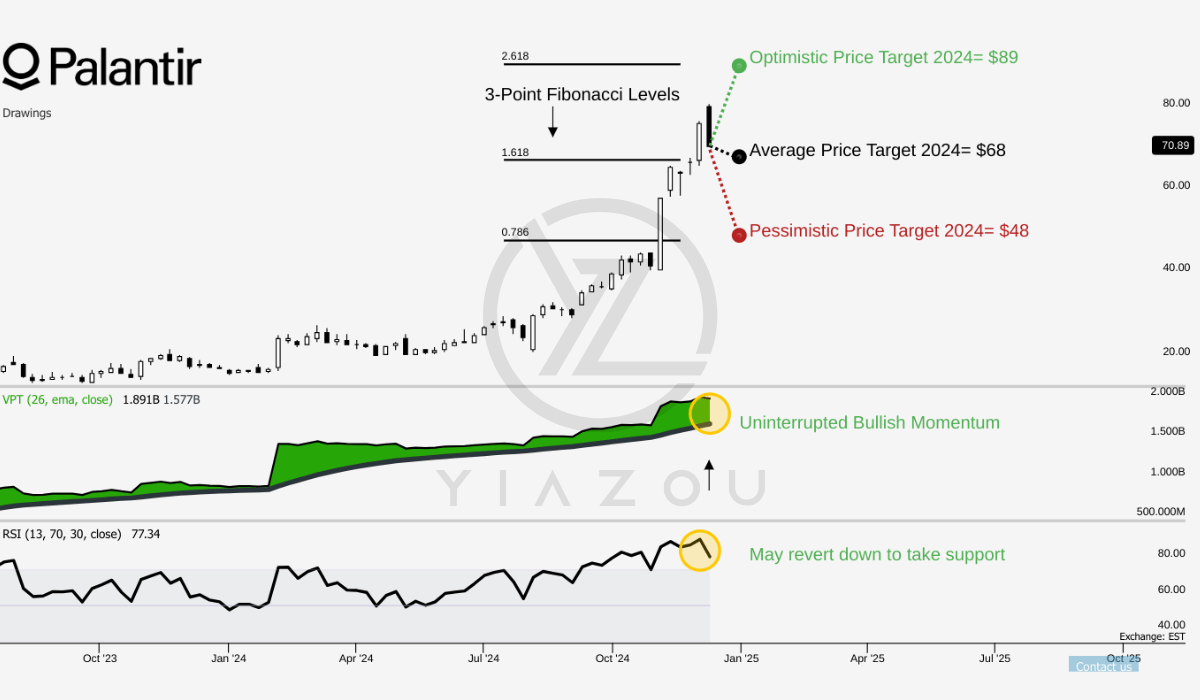
Palantir Stock: Current Overbought RSI at 77.34 and 20% December Upside Probability
PLTR currently trades at $72. The current price is marginally above the consolidated average price target of $68, which coincides with the 1.618 3-point Fibonacci extension level. This indicates that the stock is in an over-stretched phase. Optimistic projections point to $89 (2.618 Fibonacci level) and pessimistic estimates pin it at $48 (0.786 Fibonacci level).
The RSI is at 77.34, indicating an overbought condition for PLTR. But, there are no divergences and the trend of the RSI line is now down. This is a sign of an upcoming short-term consolidation or pullback. The line of VPT has reached 1.89 billion. For now, it is higher than its moving average pegged at 1.58 billion. Such a constant influx of volume can push the prices upwards. The difference between VPT and its mean could suggest some buying behind the scenes.
Yiazou (trendspider.com)
Lastly, seasonality analysis reveals a slim 20% probability of positive returns for December, which is historically a weak month for PLTR based on a four-year dataset.
Yiazou (trendspider.com)
RPO Growth Hits 58%, Billings Surge 50% Over 12 Months
Remaining performance obligations (RPO) are the value of contracts that Palantir has already signed but not yet fully executed. This gives a perspective on forward revenue by assuming all the contracts will be fulfilled. Now the RPO numbers are climbing constantly quarter-over-quarter (QoQ). Over TTM, starting at $0.99 billion in Q3 2023, this is up to $1.57 billion in Q3 2024. That’s a solid 58% increase over the TTM. It’s now clear that Palantir’s contracts are getting bigger as the company is progressively expanding its deal pipeline. As Palantir’s RPO is growing, it’s a good sign that forward revenue growth is well-supported. Entities are signing up for Palantir’s portfolio, are locking in contracts, and the revenue is going to flow in as these agreements are executed and mature.
Moreover, If we break this down into short-term versus long-term RPO states, both categories are growing. By how much? So, the short-term RPO moves from $0.56 billion in Q3 2023 to $0.73 billion in Q3 2024 with a growth of 30%. Similarly, the long-term RPO jumps from $0.43 billion in Q3 2023 to $0.84 billion in Q3 2024 with a 95% increase. Now these striking trends say the company is locking in more long-term contracts, and it is a favorable sign for top-line stability.
Now let’s talk about billings. Palantir’s Billings represents the actual revenue that the company has billed its clients in a quarter. This reflects how quickly Palantir is translating its signed contracts into revenue. Q3 2023 starts with $550 million in billings, and by Q3 2024, it hits $823 million with a big 50% increase. And against Q2 2024 it is an increase of 14.6% in just one quarter. If this trend continues, Palantir could maintain a solid pace of top-line growth through acquiring new clients and delivering high on existing contracts. The quarterly billings growth points to Palantir’s client base expanding and the company making progress in actually billing more clients at higher values. If billings tie with the increase in RPO, it means Palantir is constantly locking in more high-value contracts and translating directly into higher billings (as these deals become active).
At the bottom line, the Rule of 40 is a nice mark for Palantir that combines its revenue growth rate and adjusted operating margin. The Rule of 40 moves from 40% in Q4 2022 to 68% in Q3 2024. That’s a 70% increase over the period. A big part of that improvement comes from Palantir’s impressive adjusted operating margin which jumped from 22% in Q4 2022 to 38% in Q3 2024. That’s a 16%-point increase over the period. For Palantir’s growth, this means the company is becoming sharper at converting revenue growth into actual profits. The impressive operating margin suggests that Palantir is not just throwing money at new client acquisition. It’s doing so in a way that is increasingly profitable. With that rule of 40 figures constantly climbing, it signals that Palantir’s balance between revenue expansion and cost management is now increasingly efficient. Further, the expansion of the operating margin suggests the company is tightening its operations and reaping better returns on its Bootcamp efforts.
Yiazou (trendspider.com)
Looking forward, Palantir projects Q4 2024 revenue of ~$769 million (at the midpoint) and it represents continued +26 YoY growth. Interestingly, the street is more optimistic about the company’s top line with a $777 million revenue estimate. Adjusted income from operations may hit ~$300 million (at the midpoint) supporting margin stability. Full-year 2024 revenue guidance of ~$2.807 billion indicates 26% YoY growth, consistent with short-term performance trends. Here, US commercial revenue may hold a growth rate of at least 50%. The company focuses on expanding U.S. commercial revenue and may exceed $687 million for 2024. This reflects the strategic prioritization of high-growth markets.
1,693% Valuation Premium vs. Sector Median Contrasts 454% YoY Revenue Growth Outperformance
Palantir’s valuation is a concerning issue. With a TTM Price-to-Sales (P/S) ratio of 59.49, it towers above the sector median of 3.32. It is a staggering 1,693% divergence. Similarly, the forward P/S ratio of 57.86 stands at a 1,644% premium over the sector median of 3.32. These metrics indicate that Palantir’s stock is priced at an extreme premium relative to its direct market. While high P/S ratios can sometimes be justified for companies with disruptive tech, the gap here suggests speculative optimism. When the market sentiment shifts and top-line growth fails to set expectations. The stock’s price can face massive downward pressure.
Moreover, Palantir’s YoY revenue growth of 24.52% and forward revenue growth of 22.06% significantly outperform the sector medians of 4.43% and 5.65%. But, these growth figures reflect 454% and 291% sector outperformance. In short, its capacity to grow at a faster rate than its competitors is not enough to justify its valuation metrics. For instance, if growth slows even slightly due to market saturation, competitive pressures, and stable economic factors, the mismatch between valuation and growth premiums could spread more. Additionally, Palantir’s growth appears concentrated in specific areas, such as the US Commercial and government contracts, and experienced 54% and 40% YoY growth in Q3. Such dependency creates a risk of disruptions, like reduced government budgets and shifts in enterprise CapEx priorities.
seekingalpha.com
Finally, the company’s reliance on boot camp conversions to secure large contracts is also an operational bottleneck. While these sessions lead to seven-figure Annual Contract Value (ACV) deals within two months, their scalability is now questionable. A conversion process that depends heavily on in-depth customer engagement could obviously limit the company’s ability to expand rapidly.
Analyst’s Disclosure: I/we have a beneficial long position in the shares of PLTR either through stock ownership, options, or other derivatives. I wrote this article myself, and it expresses my own opinions. I am not receiving compensation for it (other than from Seeking Alpha). I have no business relationship with any company whose stock is mentioned in this article.
Seeking Alpha’s Disclosure: Past performance is no guarantee of future results. No recommendation or advice is being given as to whether any investment is suitable for a particular investor. Any views or opinions expressed above may not reflect those of Seeking Alpha as a whole. Seeking Alpha is not a licensed securities dealer, broker or US investment adviser or investment bank. Our analysts are third party authors that include both professional investors and individual investors who may not be licensed or certified by any institute or regulatory body.

