Summary:
- YouTube’s revenue is often underreported, I aim to fix this by calculating its subscription revenue.
- To gauge YouTube’s margins I compare its expenses to that of Netflix.
- My Free Cash Flow valuation of Alphabet suggests a value of $210, leading me to assign them a BUY.
hocus-focus
Introduction
It continues to annoy me that the majority of the time Alphabet’s (NASDAQ:GOOG) YouTube is discussed, their revenue is described by just their advertising numbers and maybe at best, as an afterthought, they shout out the subscription portion. This leads to YouTube being massively overlooked by most. In this article, I hope to fix that, first I will make a good estimate of YouTube’s real revenue over the last 4 years. Next, in an attempt to get some visibility on their margins, I will use Netflix (NASDAQ:NFLX), a company with known margins, as a comparison to gain insights into YouTube’s expenses. Then finally, I will share my Free Cash Flow valuation on Alphabet where I get a value of $210, giving me a BUY target on the stock. My main goal in every article is to make 4 or 5 interesting points in the hope that at least 1 sparks an interesting discussion with each reader, if I succeed, please join me in the comments section.
Finding YouTube’s Total Revenue
I am a fan of Alphabet and have been a shareholder for 6 years now, but they don’t make it easy to analyze them. Several multi-billion dollar businesses are partially or completely hidden in their reports, one of which is YouTube. While they report their advertising numbers as clear as day, the subscription part of their business is obscured inside their ‘Google Subscriptions, Platforms and Devices’ segment, going forward, I will just call this segment ‘other’. As the name suggests this segment includes subscriptions, like YouTube Premium and Google One, Platforms, like the Play Store, and Devices like Pixels, Nests and Chromecasts. What we are interested in teasing out, is how much of this ‘other’ segment is YouTube subs. To do that, we are going to use the scape of info that Alphabet has given us.
In the most recent earnings call Alphabet announced that, for the first time, YouTube’s total revenue for the last 12 months was over $50 billion. We can use this info, along with the trailing 12-month revenue numbers for YouTube ads and ‘other’ to calculate an upper and lower bound for what percentage of ‘other’ revenue goes to YouTube. As you can see in the table below, in Q2 2024 YouTube subs must have accounted for less than 43.28% of ‘other’ revenue and in Q3 it must have been greater than 38.29%. For my future adjustments, I will take the Q3 percentage as 40.75%.
Calculation to estimate revenue from YouTube subs (Author)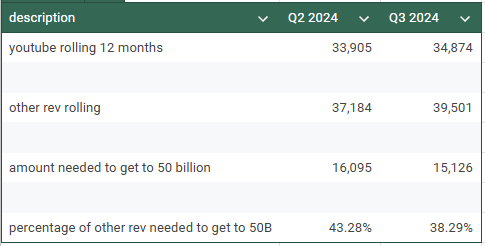
The next issue is that the revenue share in ‘other’ is not stable, based on multiple comments by management over the years we know YouTube subs have been the main source of growth in ‘other’ revenue, so we can assume that the revenue mix in ‘other’ from YouTube has grown over the last 4 years, for ease I am also going to assume that the percentage increased linearly. To help me estimate how much it has grown we can use two announcements, in September 2021 (Q3) they said they had 50 million subs and in February 2024 (Q1) they had 100 million. So let’s estimate that their subs revenue doubled in that time. This means, along with the linear growth, I can guess a percentage mix back in Q4 2020 such that the Q1 2024 ‘other’ revenue is double that of Q3 2021, this happens at a starting value of 20.59%. This gives me the estimated numbers below for total YouTube revenue, these numbers are far from perfect, but until Alphabet breaks out YouTube’s full revenue it is the best I have.
Breakdown of YouTube Revenue (Author)
Putting all that together, we can look at how this changes our view on YouTube’s revenue, below, I have a series of three graphs. First, we can see how YouTube’s revenue changed in absolute terms, instead of $8.9 billion in the latest quarter, we are looking at $13.3 billion, and instead of a mediocre CAGR of 7.15%, we have an impressive one of 11.73%. Second, YouTube’s contribution to Alphabet’s overall revenue, ad revenue has been stagnant, at about 10%. When we look at total revenue, we can see a much healthier-looking graph, with share increasing noticeably since 2022, currently sitting at 15%. The last graph may be the most telling, it shows the annual growth rate for each quarter. For 3 quarters, YouTube’s ad revenue shrank leading many to opine on their difficulties, with few pointing out, what we can see now, YouTube as a whole managed to grow every quarter bar one, no mean feat in the general post-pandemic slowdown.
Graphs of YouTube’s Revenue (Author)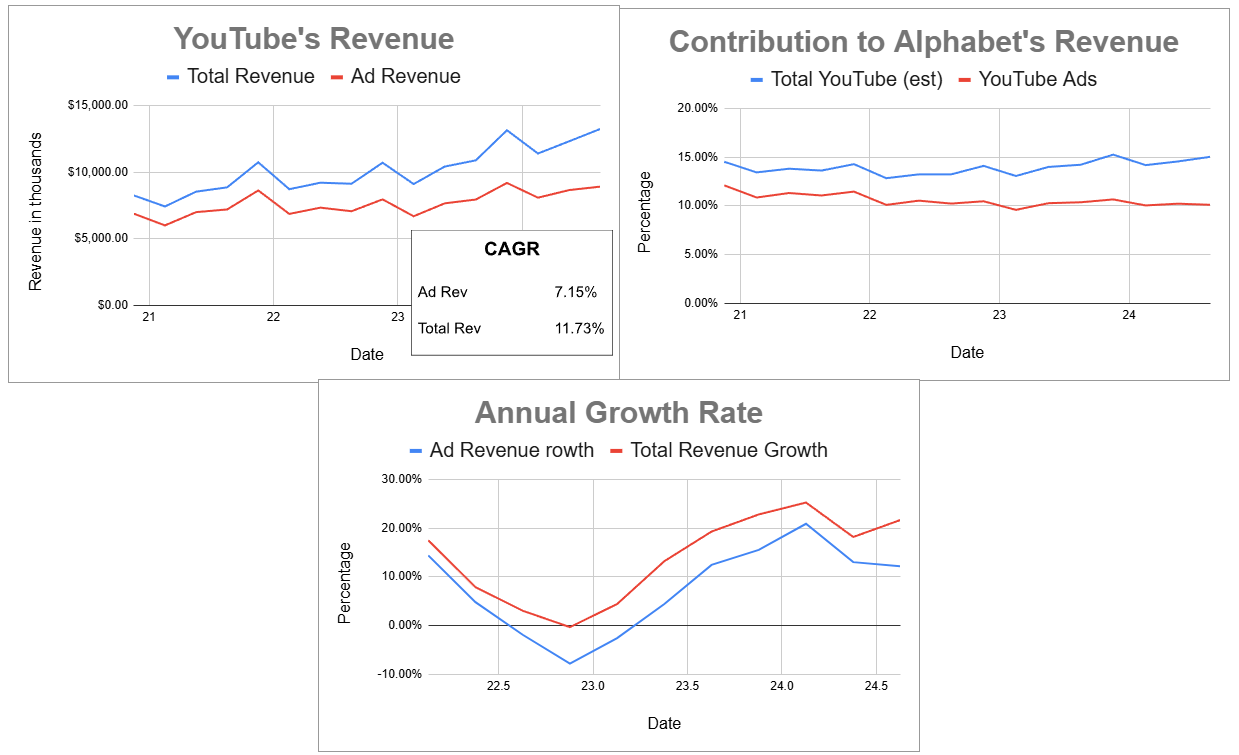
These adjusted numbers are just my best guess, and my assumption of a linear increase in the revenue mix of ‘other’ is likely off, especially given the lumpy revenue from Alphabet’s Devices, like the Pixel phones, that usually spike in a certain quarter, due to release schedules. Still, I hope you will agree that these adjusted numbers give a much better insight into the true scale and growth of YouTube, and without a clear view of its history it is hard to model a future. With any luck, with YouTube becoming 15% of Alphabets revenue, they may soon change up their segment reporting and give us a clearer picture of YouTube’s financials.
Unknowable Margins
We can get operating margins in the latest quarter for Google Services of 36.7%, this is their operating profit minus their share of alphabet-level costs. But as YouTube only makes up 17.3% of Google Services, I think this number is at best questionable. So instead of concrete margin numbers, let’s look at Netflix, a company with known margins, and use a comparison between the two to gain some insights into YouTube’s costs.
Looking at the cost of creating content my first thought, and that of some other commentators that I have seen, was that YouTube’s costs are a lot lower, this is partially correct, sure they don’t need to spend large sums on massive productions, hoping for a return 2 to 3 years later, but they still have a cost, they share advertising revenue with the creator, at a rate of 55% but the final number is likely less due to many creators not being monetized, my guesstimate is 40% to 50%. For Netflix, we can see in 2023 they amortized $14.2 billion from content spend, so out of revenue of $33.7 billion that is a cost of 42%. I would have given Netflix the win here, except the benefit of paying creators a month after the revenue is earned rather than 2 years before is massive. So let’s say, on the cost of producing content, it is a tie.
Next, I am thinking of server costs, both companies need to store and send data. Let’s think about how much data. YouTube has 2.7 billion monthly users watching on average 0.81 hours a day, for 2.2 billion hours watched, compared to Netflix’s 282 million users watching 3.2 hours, for 902 million hours a day. That is YouTube needs to stream nearly 2.5 times more content. This is less telling than you would hope, I found this source saying Netflix uses 15% of global internet traffic and YouTube uses 11.4% implying that YouTube needs to send less data than Netflix, this is likely due to YouTube videos being viewed at a much lower quality than the blockbuster movies and shows on Netflix. Taking the total internet traffic method, the ratio of data sent would have YouTube sending 0.76 times that of Netflix.
This means all being equal YouTube’s running costs should be lower, but things aren’t equal, YouTube also has access to Google Cloud and has built out custom chips and data centers to stream its videos, this vertical integration would likely give them another cost saving over Netflix which has to pay a third party, Amazon’s (NASDAQ:AMZN) AWS, for their server usage. This is a clear win for YouTube.
Finally, I always like to look at executive compensation, for me, this has always been a black mark against Netflix. In the table below, I have summed up all the money paid to the C-suite of both Netflix and Alphabet for the last 3 years and I have averaged it, mainly to break up the lumpiness of the pay of Alphabet’s CEO Sundar Pichai, he got paid $226 million in 2022 but less than $10 million in 2021 and 2023. Looking at just the averages, it costs $146 million to manage Netflix compared to $196 million to manage Alphabet, but remember YouTube only makes up 15% of Alphabet so only $29.5 million of that management cost should be assigned to them.
Executive Compensation (Author)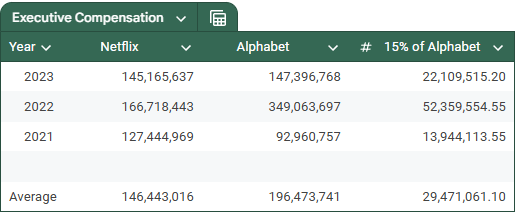
This means Netflix pays their C-suite 5 times more than YouTube, whereas Netflix’s market cap of $350 billion is about the same as 15% of Alphabet’s market cap. Either YouTube is getting a great deal on their management or Netflix is overpaying.
With YouTube’s revenue, I feel I was able to make a good estimate based on a few knowable facts, with their margins we are dealing with my guesses and opinions. With that said, I hope I have given compelling reasons to back up my opinion that YouTube can have margins higher than Netflix’s, which are currently approaching 30%.
Alphabet Valuation
YouTube is not a standalone company and combined with the fact we don’t have concrete numbers, I don’t think it is productive to do a full valuation on it. But it is a large and growing part of Alphabet, so I would like to share my valuation of them.
My general method is to model out the next ten years, starting with revenue and revenue growth then I take away expenses to get to an estimate of net income. While doing this, I capitalise R&D, so my numbers are different than Alphabet’s published net income. Once I have a net income, I take away reinvestment, this is made up of the difference in CapEx and Depreciation and the difference in reported R&D and my amortized R&D expense, as I get to the later years of my model I start to use a ratio for the return on invested capital to guide my reinvestment numbers. This method treats Alphabet’s high stock-based compensation as a real cost.
All this gives me a number for FCF, which I discount using a cost of capital, my choice of cost of capital is fairly simplistic, I adjust it in relation to my prediction for the risk-free rate and my view on the riskiness of a company. For Alphabet, I estimate the cost of capital at 10% and expect it to gradually fall back to 8% over the next 5 years. If you feel interest rates will be higher for longer, or Alphabet will need to borrow money at high rates, changing this input will significantly affect the final value.
As this article is primarily about YouTube, I will limit my discussion on the other parts of Alphabet to a few sentences, although, Search and Cloud definitely deserve articles of their own.
On Search, I don’t expect the doom and gloom from AI that many talk about, but I do acknowledge it and I have partially lowered future revenue growth due to it. I think a bigger risk is the effect of expensive AI searches on margins, so I also tempered them slightly.
My take on Cloud is a bit more interesting, I am modelling higher growth than most analysts, as I expect, with the help of their efficient TPUs, Google Cloud can rise to a market-leading position, but I am concerned that cloud computing will become commoditized and have limited margins. I have seen others expect margins to rise to match AWS’s 40%, I am modelling Google Cloud, AWS and Microsoft’s Azure to compete each other to margins somewhere around 20%. Given Cloud’s growing influence on Alphabet’s financials, adjusting this figure has a significant impact on my valuation.
I have ‘copped out’ when it comes to Other Bets by not modelling it in the FCF, I have added on a valuation of $60 billion at the end, I think this is conservative as that includes Waymo, Verily, Wing and likely others. Still, even changing this up to $100 billion doesn’t move the needle much for a company of this size.
This gives me a price target of $210, allowing me to assign it a BUY.
My FCF valuation for Alphabet (Author)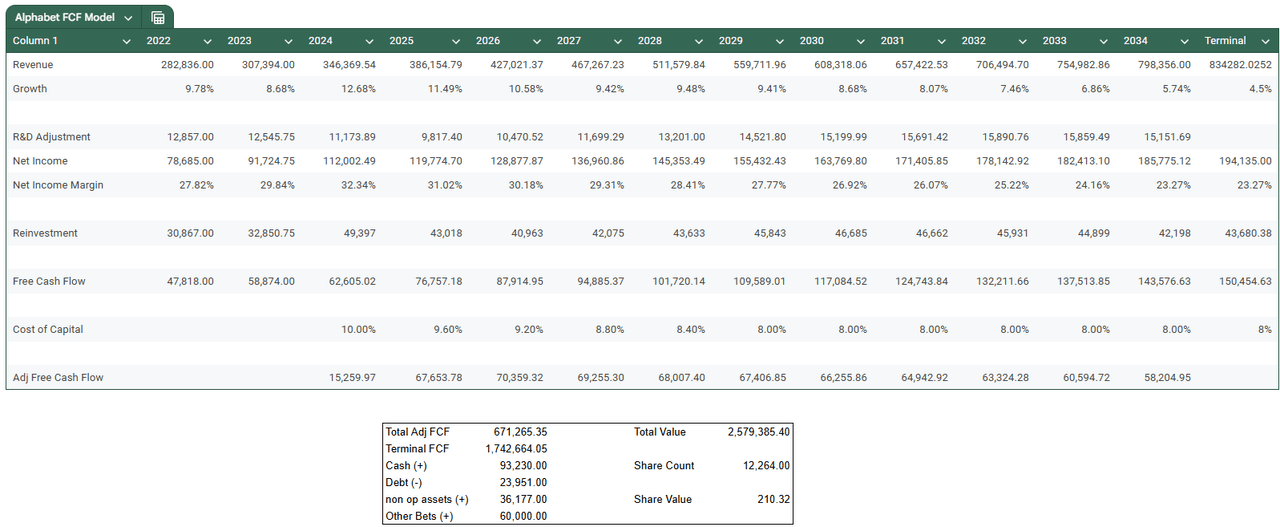
Risks
The main risk to most large established businesses is competitive disruption, YouTube is no different. I don’t see anyone specific on the horizon, but where someone is making money there are others looking to take a share.
While I think the risk of Alphabet breaking up is more of an opportunity for YouTube, the disruption caused by it could certainly be dangerous.
Regulation, as a company active in 100’s of jurisdictions YouTube has a lot of hoops to jump through, it would be easy to trip, especially given they have quite loose control over their content, a single creator could post something that ends up with, boycotts or bans, in different parts of the world.
Conclusion
YouTube is bigger and more profitable than many realize, and it may continue to be overlooked until Alphabet breaks out its revenue fully. This could be a contributing factor to Alphabet being undervalued. Remember, mispriced markets are what we are looking for.
Analyst’s Disclosure: I/we have a beneficial long position in the shares of GOOG either through stock ownership, options, or other derivatives. I wrote this article myself, and it expresses my own opinions. I am not receiving compensation for it (other than from Seeking Alpha). I have no business relationship with any company whose stock is mentioned in this article.
Seeking Alpha’s Disclosure: Past performance is no guarantee of future results. No recommendation or advice is being given as to whether any investment is suitable for a particular investor. Any views or opinions expressed above may not reflect those of Seeking Alpha as a whole. Seeking Alpha is not a licensed securities dealer, broker or US investment adviser or investment bank. Our analysts are third party authors that include both professional investors and individual investors who may not be licensed or certified by any institute or regulatory body.
