Summary:
- Micron is attracting strong attention among super-investors.
- It is currently the top 34th stock most held by these investors, very disproportionate to its size among tech stocks.
- Several high-profile money managers (such as Fairfax Financial and Guy Spier) are holding and/or buying Micron shares at around $63.
- My reading of these transactions is that now is a good time to buy a good company at a cyclical low.
vzphotos
Investment thesis
Micron Technology (NASDAQ:MU) has been attracting attention, disproportionately to its size, among big money managers lately. As you can see from the chart below, MU is now the top 34th stock most held by super-investors tracked by DATAROMA. It represents about 0.38% of the portfolio held by these investors. To provide a reference point so that readers can better contextualize such data, Apple (AAPL), which is ~40 times larger than MU by market cap, represents only about 1.14% of the portfolio held by these investors, only about 4x more than MU.
These investors are holding their shares at an average price of $63 as shown, close to its current market price of $65.2 as of this writing. And the majority of them are still adding at these price levels, according to their latest disclosures.
The thesis of this article is to explain why I agree with their decisions. I do not pretend to know the precise reason for their buying activities. I am only familiar with the style and track record of a few of them (mostly Fairfax Financial and Guy Spier). But through my own analysis (to be detailed in the remainder of this article), I will argue that a price around $63~$65 is an excellent entry point for a good company near a cyclical low.
Cyclicality – Risks and opportunities
First, let me start by stating a truism – it is not easy (or feasible at all in my view) to precisely time the cycle even for a stock like MU that has demonstrated regular cycles in the past.
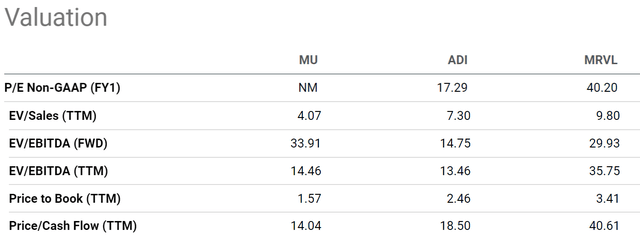
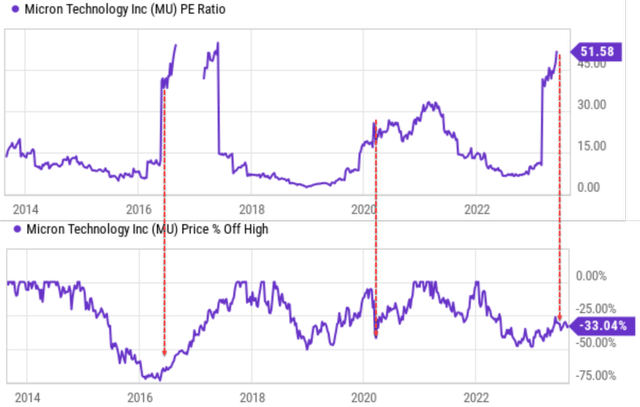
However, there are a few things that I’ve learned from analyzing and betting on cocycles over the years. First, at a philosophical level, we can make a good profit just by being directional rather than being quantitatively right. And secondly, at a more technical level, for highly cyclical stocks like MU, the cycle can be so deep that peak valuation occurs near the bottom price. As you can see from the first chart below, MU’s earnings are currently near a cyclical bottom and its FY1 P/E is not even meaningful/applicable here even when its stock price has suffered a large correction. We’ve seen this pattern multiple times before as marked by the red line arrows in the second chart below. Historically (such as in 2016 and 2020), its peak valuation occurred close to rock-bottom stock prices and vice versa.
So, I don’t recommend potential MU investors to be overly concerned about the current high valuation metrics. Furthermore, by horizontal comparison, MU’s valuation is at a substantial discount compared to other players in the sector as seen in the first chart.
Next, I will present my analysis for the next 3~5 years once we look past the short-term volatilities.
MU’s long-term profitability and growth outlook
As detailed in my blog article, in the long-term, the earnings growth of a business is determined primarily by two parameters: the return on capital employed (“ROCE”) and the reinvestment rate (RR, also known as the plow-back rate). My analysis of MU’s ROCE over the years is shown below. Note that to smooth the large fluctuations of its earnings, a three-year running average. As you can clearly see, its profitability is still very cyclical even after such averaging when compared to a more stable business such as INTC. But if we look past the cycles, the long-term average is the about same as INTC. To wit, MU’s average ROCE has been about 31% over the past decade, compared to INTC’s 37%.
Author based on Seeking Alpha data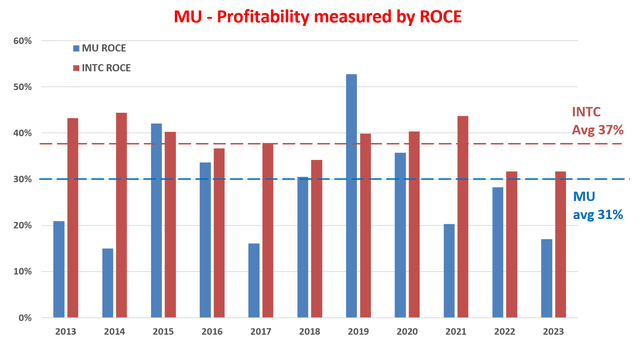
MU’s RR has fluctuated between 10% to 15% in the past few years. Looking ahead, I see both headwinds and tailwinds on this front. Tailwinds include the ongoing CHIPS Act. As detailed in my earlier analysis, I anticipate the Act could effectively boost its RR to about 20% via subsidies in the form of CAPEX projects, R&D collaboration with universities and government labs, and tax credits. But strong headwinds are also possible. A key uncertainty here involves China. MU’s products have been at the crossfire between the U.S.-China trade tension lately (more on this later). The fate of its China market (an important market) is uncertain and could limit its cash flow and RR.
With these uncertainties, I assumed an RR in the range of 7.5% to 10% only to be on the conservative side in the following projection. As seen, a 10% RR combined with an average ROCE would generate about 3.1% of real growth rate (31% ROCE * 10% RR). Adding an inflation escalator of ~2.5% would translate into an annual growth rate of around 5.5% – a pretty healthy growth rate in my view.
Author based on Seeking Alpha data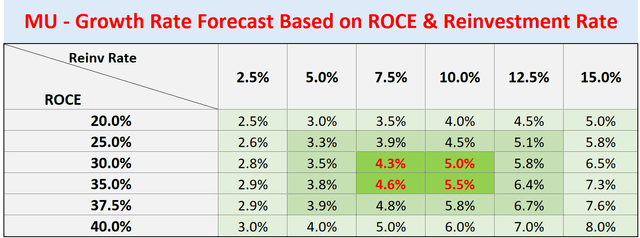
Projected returns, other risks, and final thoughts
With the above growth rates, my estimate of its cyclically adjusted EPS turns out to be around $8.9 in the next 3~5 years. To compute the cyclically adjusted EPS, I simply averaged its earnings over the past 4-years, the average cycle duration historically. The average P/E for the stock has been around 10x in the past. Assuming the average P/E multiple, my projected target price is about ~$90 in 3~5 years, representing a 38% upside potential from today’s market price.
As aforementioned, there are considerable risks afoot also. In May, China announced a ban against MU products because its products are considered part of the “critical infrastructure” of the country. As a key market to MU, such a ban could have a large impact on MU’s profit. My estimate is that such a ban has the potential to cause up to a 10% decline in its total revenue. And also, as analyzed in my earlier article, the company is still sitting on a high level of inventories (hoarded from the COVID days). Clearing the inventory will take time and can cause profitability and/or balance sheet hiccups (e.g., reduced sale prices or even write-offs).
All told, I see the stock as a high-risk and high-payoff opportunity with a favorable risk-return profile under its current price. I interpret the recent transactions of big money managers and the fact that their average holding price is close to the current market price as a good sign for such an asymmetric profile.
Analyst’s Disclosure: I/we have a beneficial long position in the shares of MU either through stock ownership, options, or other derivatives. I wrote this article myself, and it expresses my own opinions. I am not receiving compensation for it (other than from Seeking Alpha). I have no business relationship with any company whose stock is mentioned in this article.
Seeking Alpha’s Disclosure: Past performance is no guarantee of future results. No recommendation or advice is being given as to whether any investment is suitable for a particular investor. Any views or opinions expressed above may not reflect those of Seeking Alpha as a whole. Seeking Alpha is not a licensed securities dealer, broker or US investment adviser or investment bank. Our analysts are third party authors that include both professional investors and individual investors who may not be licensed or certified by any institute or regulatory body.
As you can tell, our core style is to provide actionable and unambiguous ideas from our independent research. If your share this investment style, check out Envision Early Retirement. It provides at least 1x in-depth articles per week on such ideas.
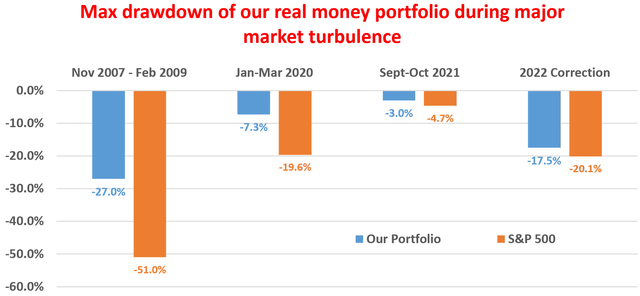
We have helped our members not only to beat S&P 500 but also avoid heavy drawdowns despite the extreme volatilities in BOTH the equity AND bond market.
Join for a 100% Risk-Free trial and see if our proven method can help you too.
