Summary:
- The Russia-Ukraine war broke out on Feb 24, 2022 and has been going on for 295 days.
- Sadly, the so-called Lindy’s Law predicts that the longer it has been going, the more likely – not less likely – it will drag on longer.
- My bull thesis on Exxon Mobil did not rely on the war (and I do not pretend that I saw the war coming).
- But after 295 days of war and still no end date in sight, the war has become a part of the thesis.
- And this article argues the current energy supply-demand imbalance will persist due to the war, which would support oil and natural gas prices, and also Exxon Mobil’s stock price.
Thomas Lohnes/Getty Images News
Thesis
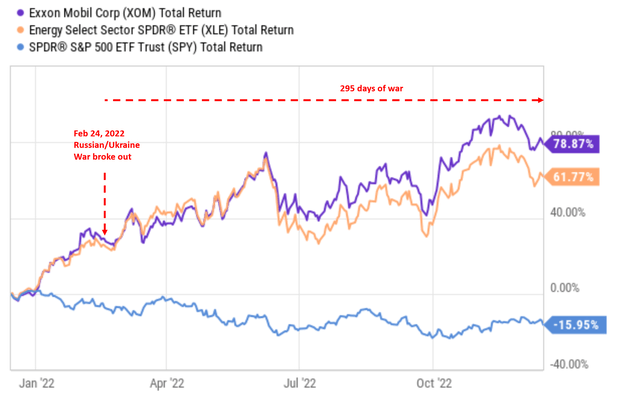
My bull thesis on Exxon Mobil (NYSE:XOM) did not rely on the Russian/Ukraine war when I wrote my first piece on the stock back in September 2021 (when the stock was trading at $55). The argument was purely based on the consideration of economics, and I certainly do not pretend that I saw the war coming. As you can see from the following chart, both XOM and the energy sector (approximated by XLE) have been outperforming the S&P 500 index before the war broke out already.
But sadly, the Russia-Ukraine war did come. And as you also can also see from the above chart, since the breakout of the war, my bull thesis was accelerated and the performance divergence between XOM and the overall market widened. Since it started on Feb 24, 2022, it has been going on for 295 days as of today. And even sadder, according to the so-called Lindy’s Law:
For nonperishable things (such as a war, an idea, or a TV show), their future life expectancy is proportional to their current age. In other words, the longer that they have been going on, the MORE likely – not less likely – that they will keep going on longer. A war that has been going on for 1 month has a good chance to end in a month. But if it has already dragged on for 5 years, its chance of ending soon actually diminishes. It now has a good chance to go on for another 5 years – exactly the opposite of what common sense would expect (which goes more or less like this: since it has been going for 5 years already, it must end soon).
But after 295 days of war and still no end date in sight, the war has become a part of the thesis, nonetheless. And this article argues the current energy supply-demand imbalance will persist due to the war, which would support oil and natural gas prices, and also Exxon Mobil’s stock price. And the argument is anchored on the following key points, which we will explore in detail one by one in the remainder of this article:
- Russia plays a key role in the global oil and natural gas market, and the war has caused immense disruptions and created a supply-demand imbalance at a global scale.
- XOM, as the world’s top integrated energy player, is one of the best-positioned companies to fill the gap created by the above imbalance. Thanks to its political alignment with EU countries, it is the top candidate to replace the void left by Russia.
- Finally, XOM is currently undervalued and offers a wide margin of safety.
Russia left a large hole
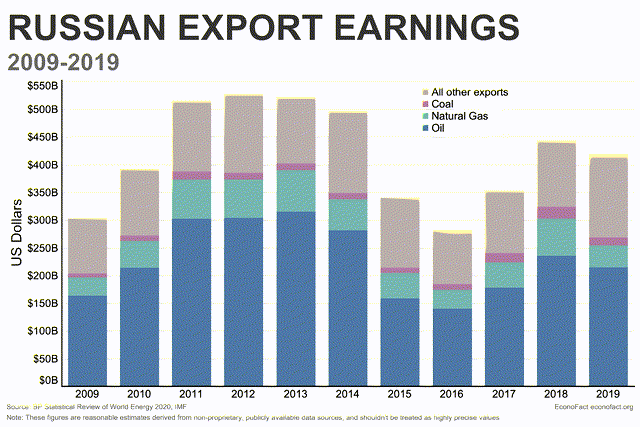
Russia is the second largest exporter in the world. As seen in the chart below, Russia used to export ~$400B worth of energy, mostly consisting of oil and natural gas (“NG”), in 2018 and 2019 before the war broke out. With the disruptions created by the war, the global supply-demand balance has been severely disturbed. Countries, mostly the European Union (“EU”) countries, which relied on Russian export now in need of alternative suppliers.
And the view of this article is that the likes of XOM and Chevron (CVX) are their top – if not only – candidates. XOM is one of the only few candidates that have all the required traits – a scale large enough to fill up a hold with a magnitude in the hundreds of $B, the political proximity with EU countries, and the ideological alignment too.
XOM best poised to fill the hole
Now, let’s examine XOM’s role closely. The EU countries will not only need crude oil and NG. They will also need other downstream products such as gasoline fuel, diesel fuels, jet fuel, and also a range of other downstream products. And XOM, as the world’s top integrated oil company, is best positioned to meet all these needs.
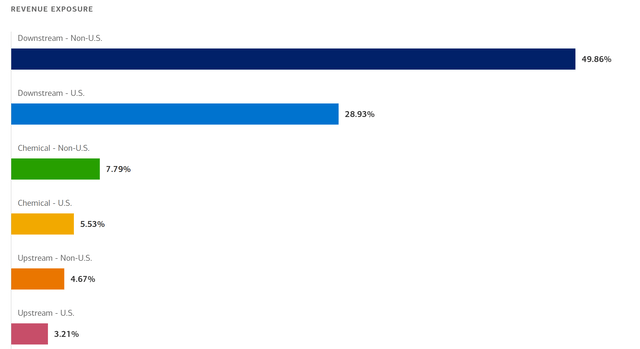
As seen from the chart below, XOM has diversification segments and also geographical exposure to mitigate the disruptions from the war. It generates 49.8% of its downstream revenue from non-U.S. operations and 28.9% from its U.S. operations. In terms of segment exposures, its largest segment is Petroleum Refineries (contributing 78.7% to its total revenues), followed by Organic and Petrochemical Products (7.8% of total revenues) and Plastic Products Manufacturing (5.5%).
Due to high prices caused partially by the war, I see XOM set for a record performance in 2022 in most of its segments. On top of high oil and NG prices, XOM has also expanded its oil and gas production, including record Permian production of nearly 560,000 oil-equivalent barrels per day in recent quarters to meet product demand amid the supply-demand imbalance. And I see its bottom line continue to reap the rewards of increased production, higher realizations and margins, and aggressive cost controls for the next 1 or 2 years at least.
Valuation is near a 10-year bottom
Despite the robust demand, favorable pricing environment, and also peak margins, the stock is undervalued both in absolute and relative terms. As seen in the first chart below, XOM is for at 7.59x FW P/E. Such a P/E multiple is substantially lower than the overall market and also its close peer CVX’s 8.95x by about 15%.
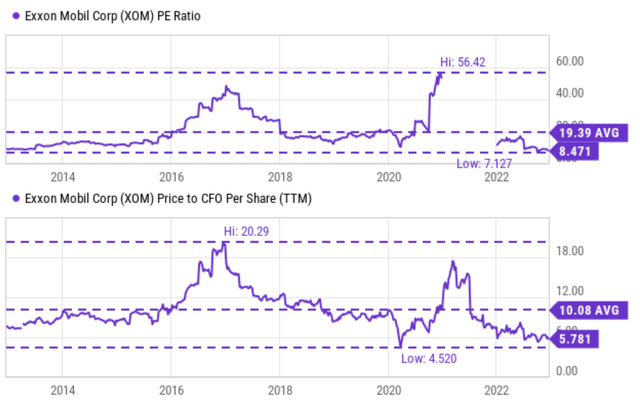
Relative to its own historical record, the P/E ratio for XOM has fluctuated in the past decade widely as seen in the top panel of the second chart below (between a bottom of 7.1x and a peak of 56x). Its current P/E of 8.47x is not only far below its historical average but also close to the bottom level in a decade.
In terms of P/CFO multiples, as seen in the bottom panel of the second chart below, the picture is about the same. Its P/CFO has fluctuated between 4.5x and 20x in the past with an average of 10.08x. And its current value of 5.7x is not only about ½ of its historical average and also the bottom level in a decade.
Source: Seeking Alpha data Source: Seeking Alpha data
Risks and final thoughts
Finally, investment in XOM (or energy stocks in general) entails some risks. In the long term, environmental concerns represent a fundamental and long-term risk. For example, the Biden Administration is pushing oil companies to conduct operations with an eye toward reducing carbon emissions. These environmental concerns could partially offset the tailwinds created by higher oil and NG prices, XOM’s ongoing efficiency initiatives, and also higher production volumes.
All told, I see XOM as the energy stock that is best poised to navigate the turbulence created by the Russian/Ukraine situation. Its geographical and segment diversification helps to minimize the risks created by the disruptions. It is one of the few candidates that can meet all the criteria to replace Russia’s supply while the war drags on – the scale, the product segments, and the political and ideological alignment with EU countries. Furthermore, XOM is currently undervalued both in absolute and relative terms. The combination of robust profitability, valuation reversion, generous dividends, and large-scale share repurchases (it just announced a new $50B buyback plan) creates favorable odds for double-digit annual total returns in the next few years.
Disclosure: I/we have no stock, option or similar derivative position in any of the companies mentioned, and no plans to initiate any such positions within the next 72 hours. I wrote this article myself, and it expresses my own opinions. I am not receiving compensation for it (other than from Seeking Alpha). I have no business relationship with any company whose stock is mentioned in this article.
As you can tell, our core style is to provide actionable and unambiguous ideas from our independent research. If your share this investment style, check out Envision Early Retirement. It provides at least 1x in-depth articles per week on such ideas.
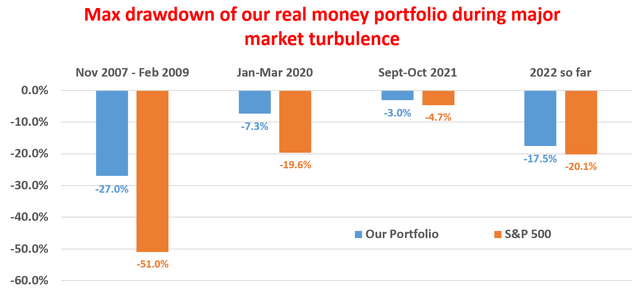
We have helped our members not only to beat S&P 500 but also avoid heavy drawdowns despite the extreme volatilities in BOTH the equity AND bond market.
Join for a 100% Risk-Free trial and see if our proven method can help you too.
