Summary:
- Mastercard’s peak bear market decline this year is 26% so far, because it’s firing on all cylinders. Consensus estimates have been rising all year.
- MA is one of the most profitable companies on earth, with 45% net margins, 48% FCF margins, and 612% return on capital.
- MA is expected to grow at double-digits during the 2023 recession, just as it did during the Great Recession.
- MA is as close to a perfect quality dividend growth stock as exists on Wall Street, with an A+ credit rating, incredible free cash flow, and 82nd percentile risk management.
- MA is 10% historically undervalued, at 13.7X cash-adjusted earnings, a cash-adjusted PEG ratio of 0.59. It could deliver 150% returns in the next five years, about 3X more than the S&P 500.

mikdam
Warren Buffett famously said, “It’s far better to buy a wonderful company at a fair price than a fair company at a wonderful price”.
This bear market has created no shortage of incredible blue-chip buying opportunities in the world’s best companies.
But today, I want to share with you the three reasons why Mastercard (NYSE:MA) is arguably the ultimate Buffett-style bear market blue-chip buy.
One that, if you buy today, could generate the kinds of long-term returns that rich retirement dreams are made of.
Reason One: Mastercard Is As Close To God’s Own Dividend Stock As Exists
Mastercard is the highest quality company on the Masterlist, a 100% quality 13/13 Ultra SWAN.
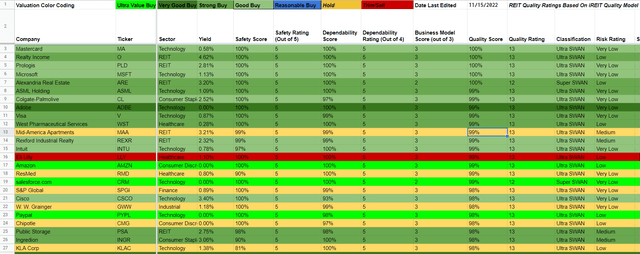
(Source: Dividend Kings Safety and Quality Tool)
In other words, as close to God’s own dividend growth stock as exists on Wall Street, and the ultimate Buffett-style “wonderful company at a fair price.”
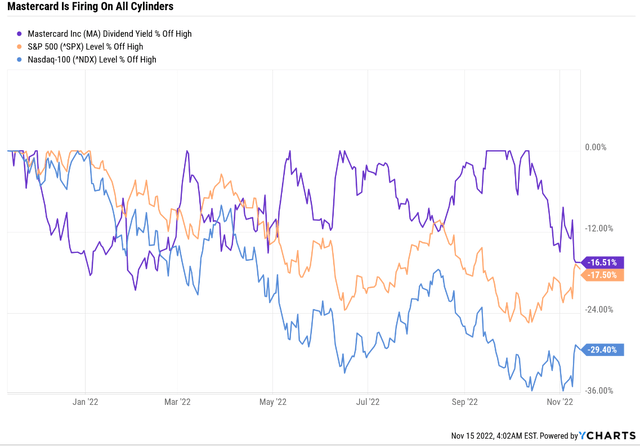
Ycharts
MA’s bear market has been shallow so far, with a peak decline of just 26%.
But that’s because this hyper-growth Ultra SWAN is firing on all cylinders.
Earnings Update
Mastercard’s third-quarter results largely mirrored what we saw from Visa. The company continues to enjoy strong growth as it returns from pandemic-related impacts and favorable long-term secular trends assert themselves. We will maintain our $369 fair value estimate and wide moat rating and see the shares as modestly undervalued.
Net revenue was up 15% yearly, or 23%, excluding currency impacts. With about two-thirds of its year-to-date gross dollar volume coming from outside the United States, Mastercard is exposed to the stronger dollar’s negative impact. Gross dollar volume was up 11% on a constant-currency basis, and switched transactions were up 9%.” – Morningstar
Morningstar’s fair value estimate is close to ours at $375. In a tough year of slowing, growth sales were up 23% in constant currency.
Even more impressive is that 2/3rd of processing volumes are international, where growth is much slower or even negative.
Cross-border transactions have been a major factor for the business over the past couple of years, thanks to the pandemic-related decline in travel and the relatively large fees Mastercard collects on these transactions. But the more recent recovery in travel has been a major tailwind for Mastercard. Constant-currency cross-border volume, excluding intra-Europe transactions (which are priced similarly to domestic transactions), grew 53% year over year in the quarter, which marks a slight deceleration from last quarter, although growth remains quite strong. Cross-border travel-related volume is now at 124% of the 2019 level. We continue to expect a full recovery in travel spending over time, and there are likely still benefits for Mastercard ahead. However, the impact on overall revenue will likely diminish going forward as the company runs against more difficult comparisons, and this recovery could be at risk in the near term if the economy takes a negative turn.” – Morningstar
Thanks to the reopening of the global economy after the Pandemic, cross-border transactions, which are the most profitable for MA, were up 53% YOY and have now surpassed pre-pandemic levels.
That doesn’t mean MA is immune to recessions, but up until now, it’s faced big secular tailwinds that have helped its results continue to beat expectations.
The strong top line continued to benefit margins, with the adjusted operation margin (based on net revenue) improving to 57.7% from 56.7% last year. But with margins now roughly in line with pre-pandemic levels, further improvement may be more modest.” – Morningstar
That strong sales growth translates into higher margins, which many companies are struggling with this year.
- MA’s consensus estimates for 2022 and 2024 have actually increased in recent months
| Metric | 2021 Growth Consensus | 2022 Growth Consensus | 2023 Growth Consensus (Likely Recession Year) | 2024 Growth Consensus |
2025 Growth Consensus |
| Sales | 25% | 21% | 13% | 15% | 12% |
| Dividend | 10% | 11% (Official) | 9% | 16% | 29% |
| EPS | 31% | 26% | 16% | 19% | 17% |
| Operating Cash Flow | 37% | 18% | 18% | 14% | 25% |
| Free Cash Flow | 33% | 13% | 22% | 17% | NA |
| EBITDA | 27% | 25% | 15% | 17% | NA |
| EBIT (operating income) | 27% | 28% | 15% | 17% | NA |
(Source: FAST Graphs, FactSet)
MA is expected to keep growing strongly through the recession.
- Pandemic EPS decline 15% (due to global lockdowns)
- Great Recession EPS growth 112%
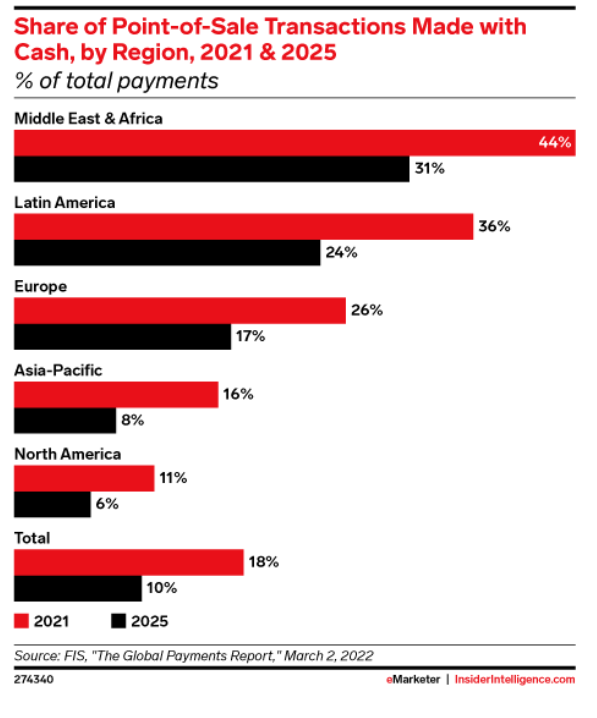
(Source: eMarketer)
Cash usage collapsed during the Pandemic to 18% of global sales, and that’s a trend that’s expected to continue.
Mastercard will eventually become a more cyclical growth stock. Still, for now it’s business model is relatively recession-proof, with the ability to deliver double-digit growth in 2023 despite economic headwinds.

FactSet Research Terminal
MA’s payment processing network handled $7.7 trillion in global payments last year and that’s expected to keep growing at 8.4% CAGR through 2024, to nearly $10 trillion.
- this year, approximately 8% of global GDP is expected to flow over MA’s network
MA processes 29% of global credit card and 24% of debit card transactions, respectively, second only to Visa.
This is a wonderfully low-cost business, resulting in some of the highest profitability in the world.
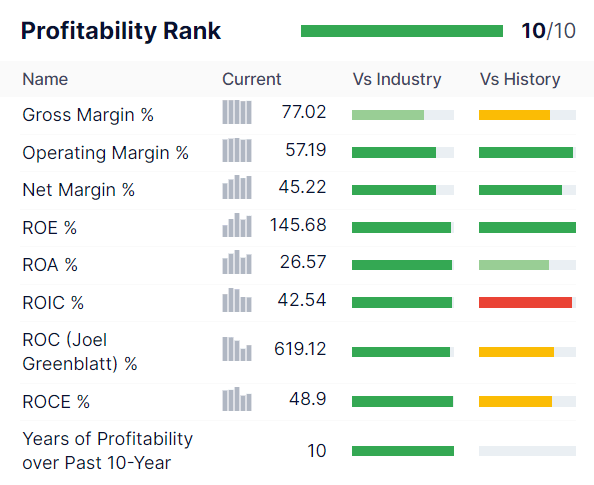
Gurufocus Premium
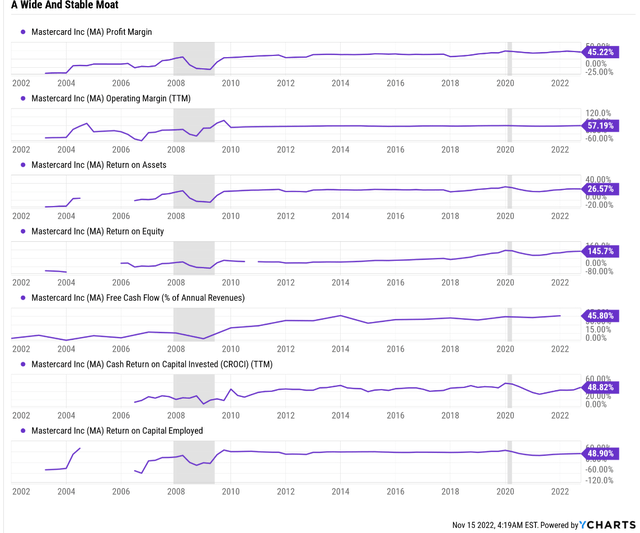
That includes trailing 12-month net margins of 45% and returns on capital of 619%.
- for every $1 it takes to run the business MA generated $6.19 in annual pre-tax profit
- MA’s ROC (Joel Greenblatt’s gold standard proxy for quality and moatiness) was 42X higher than the S&P 500
- and 6X higher than the dividend aristocrats
Ycharts
MA’s free cash flow margins are nearly 50%, in the top 1% of the world’s companies.
- for every $1 in sales, almost half drops straight to the bottom line
That profitability has been stable or improving for two decades, confirming a wide and stable moat.
- MA continues to adapt and overcome all challenges, including disruption from alternative payment processors like PayPal and blockchain

FactSet Research Terminal
MA’s free cash flow is expected to grow rapidly, hitting $15 billion in 2025.
- 19% annual free cash flow growth
It can grow the dividend at over 20% per year and still buy back stock at a rate of 3% per year.
Mastercard Credit Ratings
| Rating Agency | Credit Rating | 30-Year Default/Bankruptcy Risk | Chance of Losing 100% Of Your Investment 1 In |
| S&P | A+ Stable Outlook | 0.60% | 166.7 |
| Moody’s | A1 (A+ equivalent) Stable Outlook | 0.60% | 166.7 |
| Consensus | A+ Stable Outlook | 0.60% | 166.7 |
(Source: S&P, Moody’s)
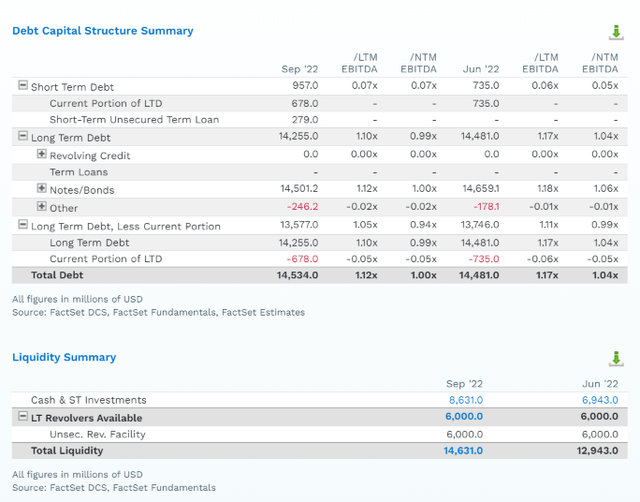
MA’s balance sheet is a fortress with a 0.6% fundamental risk of the company going bankrupt in the next three decades.
FactSet Research Terminal
MA has just $6 billion in net debt and a net debt/EBITDA ratio of 0.5.
- 3.0X or less is considered safe by rating agencies for this industry
It has $14.6 billion in liquidity, and operating earnings cover interest by 27X.
- 8X or higher is safe
FactSet Research Terminal
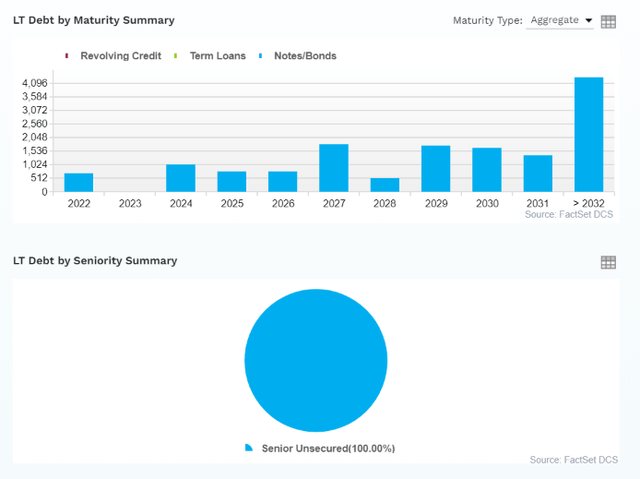
MA’s cash on hand is enough to repay the next four years of maturing debt, never mind the $36 billion in free cash flow it’s expected to generate.
- MA can effectively pay off all its debt within one year if it wants to
FactSet Research Terminal
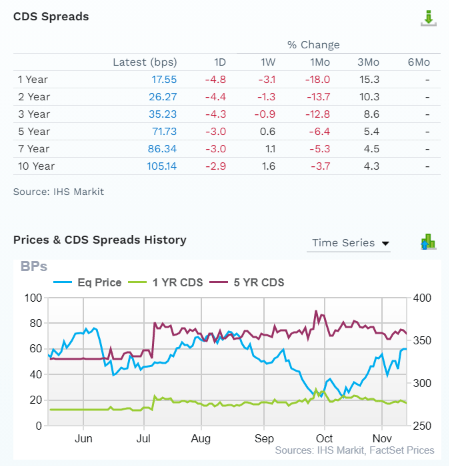
Credit default swaps are the insurance policies bond investors take out against potential defaults and serve as a real-time fundamental risk assessment tool.
The bond market agrees with rating agencies, analysts, and management that MA’s thesis is 100% intact and the company is firing on all cylinders.
- Note how MA’s price is much more volatile than its fundamental risk
- if the bond market isn’t worried about a crashing stock price, investors shouldn’t be either
Bottom Line: Master Card Is Firing On All Cylinders And Isn’t Likely To Crash As Much As Other Tech Stocks…Don’t Be Too Greedy When Buying It
Reasons To Potentially Buy Mastercard Today
| Metric | Mastercard |
| Quality | 100% 13/13 Ultra SWAN (Sleep Well At Night) Company |
| Risk Rating | Very Low Risk |
| DK Master List Quality Ranking (Out Of 500 Companies) | 1 (Highest Quality On The Master List) |
| Quality Percentile | 100% |
| Dividend Growth Streak (Years) | 10 |
| Dividend Yield | 0.6% |
| Dividend Safety Score | 100% |
| Average Recession Dividend Cut Risk | 0.5% |
| Severe Recession Dividend Cut Risk | 1.00% |
| S&P Credit Rating |
A+ Stable Outlook |
| 30-Year Bankruptcy Risk | 0.60% |
| LT S&P Risk-Management Global Percentile |
82% Very Good, Very low Risk |
| Fair Value | $375.81 |
| Current Price | $339.37 |
| Discount To Fair Value | 10% |
| DK Rating |
Potential Good Buy |
| PE | 28.3 |
| Cash-Adjusted PE | 13.7 |
| Growth Priced In | 10.4% |
| Historical PE | 28 to 33 |
| LT Growth Consensus/Management Guidance | 23.2% |
| PEG Ratio | 0.59 (Hyper-Growth At A Wonderful Price) |
| 5-year consensus total return potential |
13% to 22% CAGR |
| Base Case 5-year consensus return potential |
19% CAGR (2.5X the S&P 500) |
| Consensus 12-month total return forecast | 16% |
| Fundamentally Justified 12-Month Return Potential | 11% |
| LT Consensus Total Return Potential | 23.8% |
| Inflation-Adjusted Consensus LT Return Potential | 21.5% |
| Consensus 10-Year Inflation-Adjusted Total Return Potential (Ignoring Valuation) | 6.99 |
| LT Risk-Adjusted Expected Return | 16.56% |
| LT Risk-And Inflation-Adjusted Return Potential | 14.23% |
| Conservative Years To Double | 5.06 Vs 15.2 S&P |
(Source: DK Zen Research Terminal)
MA is trading at just 13.7X cash-adjusted earnings and a 0.59 PEG.
It can conservatively quadruple your money in a decade.
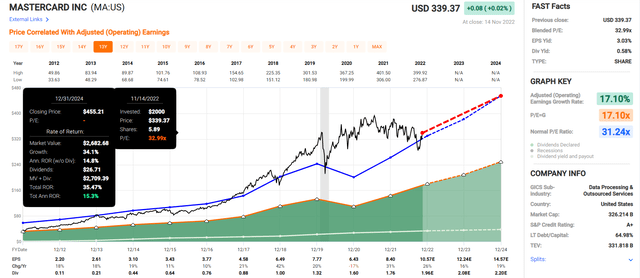
Mastercard 2024 Consensus Total Return Potential
(Source: FAST Graphs, FactSet)
If MA grows as expected and returns to historical fair value by 2024, it could deliver 15% annual returns.
- 50% more than the S&P 500
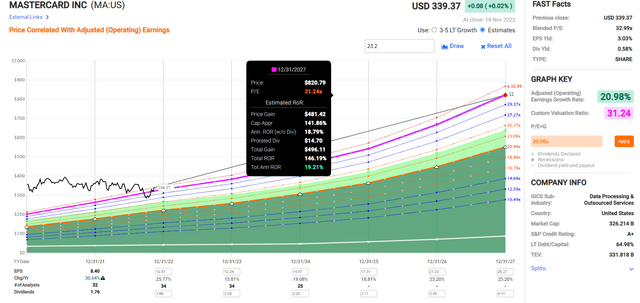
Mastercard 2027 Consensus Total Return Potential
(Source: FAST Graphs, FactSet)
If MA grows as analysts expect through 2027 (21% annually) then it could deliver Buffett-like 19% annual returns.
- about 3X higher total return potential than the S&P 500
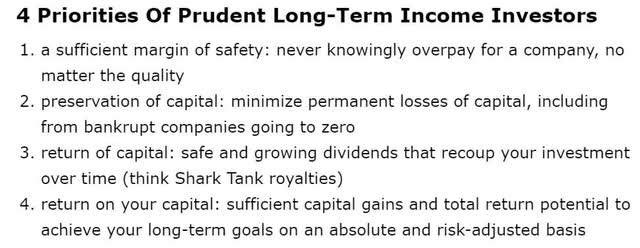
Mastercard Investment Decision Tool
DK
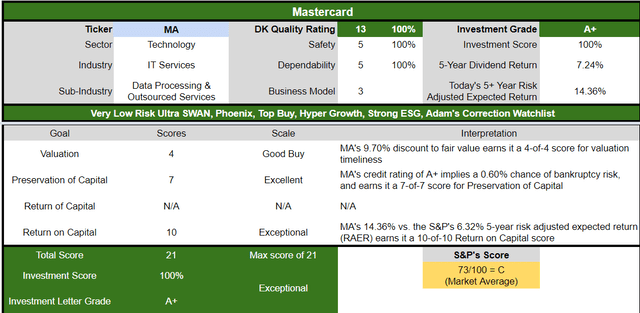
(Source: Dividend Kings Automated Investment Decision Tool)
MA is as close to a perfect hyper-growth Ultra SWAN dividend growth opportunity for anyone comfortable with its risk profile. Look at how it compares to the S&P 500.
- 10% discount to fair value vs. 2% premium S&P = 12% better valuation
- 0.6% safe yield vs. 1.8% (much safer and growing at 35% through 2025)
- 140% higher annual long-term return potential
- about 2X higher risk-adjusted expected returns
Reason Two: Double-Digit Dividend Growth…Even In Recessions
Mastercard is one of the few companies whose growth estimates have been rising all year.
- margins too
| Metric | 2021 Growth Consensus | 2022 Growth Consensus | 2023 Growth Consensus (Recession Year) | 2024 Growth Consensus |
2025 Growth Consensus |
| Sales | 25% | 21% | 13% | 15% | 12% |
| Dividend | 10% | 11% (Official) | 9% | 16% | 29% |
| EPS | 31% | 26% | 16% | 19% | 17% |
| Operating Cash Flow | 37% | 18% | 18% | 14% | 25% |
| Free Cash Flow | 33% | 13% | 22% | 17% | NA |
| EBITDA | 27% | 25% | 15% | 17% | NA |
| EBIT (operating income) | 27% | 28% | 15% | 17% | NA |
(Source: FAST Graphs, FactSet Research Terminal)
Mastercard’s secular growth trends are so strong and its execution so good, that analysts don’t expect any significant impact from the recession.
Long-Term Growth Outlook

FactSet Research Terminal
The median long-term growth consensus from all 40 analysts covering MA is 23.2% CAGR.
- one of the fastest growing companies on earth (faster than AMZN)
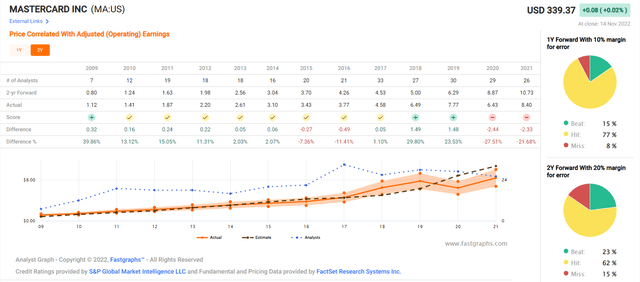
How good are analyst forecasts based on management guidance?
FAST Graphs, FactSet
Smoothing for outliers, analyst historical margins of error are about 10% to the downside and 15% to the upside.
- they miss expectations outside of a 20% margin of error just 15% of the time
- 15% to 27% historical/margin-of-error adjusted growth consensus range
FAST Graphs, FactSet
FAST Graphs, FactSet
FAST Graphs, FactSet
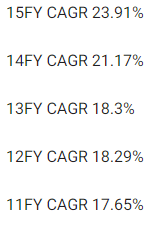
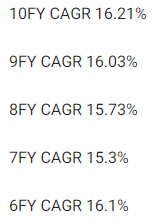
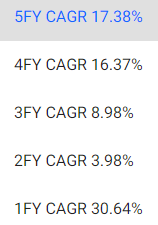
Analysts expect MA to keep growing at its historical rate of 24% since IPO for the foreseeable future.
Given its major secular growth tailwinds, I consider that a reasonable estimate.
| Investment Strategy | Yield | LT Consensus Growth | LT Consensus Total Return Potential | Long-Term Risk-Adjusted Expected Return | Long-Term Inflation And Risk-Adjusted Expected Returns | Years To Double Your Inflation & Risk-Adjusted Wealth |
10-Year Inflation And Risk-Adjusted Expected Return |
| Mastercard | 0.60% | 23.20% | 23.8% | 16.7% | 14.3% | 5.0 | 3.82 |
| Nasdaq | 0.8% | 11.8% | 12.6% | 8.8% | 6.5% | 11.0 | 1.88 |
| Schwab US Dividend Equity ETF | 3.6% | 8.5% | 12.1% | 8.4% | 6.1% | 11.8 | 1.81 |
| Dividend Aristocrats | 2.6% | 8.5% | 11.1% | 7.8% | 5.4% | 13.2 | 1.70 |
| S&P 500 | 1.8% | 8.5% | 10.3% | 7.2% | 4.9% | 14.8 | 1.61 |
(Source: DK Research Terminal, FactSet, Morningstar, Ycharts)
Analysts think MA could run circles around every popular investment strategy, and possibly double the future returns of the Nasdaq.
Inflation-Adjusted Consensus Total Return Potential
| Time Frame (Years) | 8.0% CAGR Inflation-Adjusted S&P 500 Consensus | 8.8% Inflation-Adjusted Aristocrat Consensus | 21.5% CAGR Inflation-Adjusted MA Consensus | Difference Between Inflation-Adjusted MA Consensus And S&P Consensus |
| 5 | $1,468.65 | $1,526.66 | $2,644.51 | $1,175.86 |
| 10 | $2,156.93 | $2,330.70 | $6,993.43 | $4,836.50 |
| 15 | $3,167.77 | $3,558.19 | $18,494.20 | $15,326.43 |
| 20 | $4,652.33 | $5,432.16 | $48,908.08 | $44,255.75 |
| 25 | $6,832.64 | $8,293.08 | $129,337.89 | $122,505.25 |
| 30 | $10,034.74 | $12,660.73 | $342,035.31 | $332,000.57 |
(Source: DK Research Terminal, FactSet)
Even if MA can only grow as fast as analysts expect for a decade, that’s a potential 7X inflation-adjusted return.
| Time Frame (Years) | Ratio Inflation-Adjusted MA Consensus/Aristocrat Consensus | Ratio Inflation-Adjusted MA Consensus vs. S&P consensus |
| 5 | 1.73 | 1.80 |
| 10 | 3.00 | 3.24 |
| 15 | 5.20 | 5.84 |
| 20 | 9.00 | 10.51 |
| 25 | 15.60 | 18.93 |
| 30 | 27.02 | 34.09 |
(Source: DK Research Terminal, FactSet)
That’s potentially 3.25X the market’s returns and triple the return potential of the dividend aristocrats.
- in 2028, MA will become a dividend aristocrat
- if it doesn’t I’ll eat my hat
Reason Three: The Ultimate Buffett-Style “Wonderful Company At A Fair Price”
(Source: DK Research Terminal, FactSet)
(Source: DK Research Terminal, FactSet)
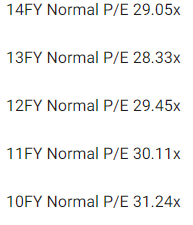
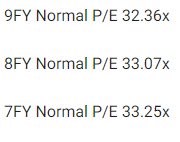
Over the past 14 years, billions of dividend growth investors, outside of bear markets and bubbles, have consistently paid between 28X and 33X earnings for MA.
- 90% statistical probability this range includes intrinsic value
| Metric | Historical Fair Value Multiples (13-year) | 2021 | 2022 | 2023 | 2024 | 2025 |
12-Month Forward Fair Value |
| 5-Year Average Yield | 0.52% | $338.46 | $376.92 | $376.92 | $440.38 | $871.15 | |
| Earnings | 31.24 | $262.42 | $329.27 | $379.88 | $489.84 | $540.76 | |
| Average | $295.63 | $351.49 | $378.39 | $463.80 | $667.30 | $375.81 | |
| Current Price | $339.37 | ||||||
|
Discount To Fair Value |
-14.80% | 3.45% | 10.31% | 26.83% | 49.14% | 9.70% | |
|
Upside To Fair Value |
-12.89% | 3.57% | 11.50% | 36.66% | 97.21% | 11.31% | |
| 2022 EPS | 2023 EPS | 2022 Weighted EPS | 2023 Weighted EPS | 12-Month Forward EPS | 12-Month Average Fair Value Forward PE | Current Forward PE |
Current Forward Cash-Adjusted PE |
| $10.54 | $12.16 | $1.01 | $10.99 | $12.00 | 31.3 | 28.3 | 13.7 |
MA is historically worth about 31X earnings and today trades at 28.3X, but just 13.7X cash-adjusted earnings.
- cash-adjusted PEG of 0.59
- hyper-growth at a wonderful price
|
Analyst Median 12-Month Price Target |
Morningstar Fair Value Estimate |
| $392.41 (32.3 PE) | $369.00 (30.7 PE) |
|
Discount To Price Target (Not A Fair Value Estimate) |
Discount To Fair Value |
| 13.52% | 8.03% |
|
Upside To Price Target (Not Including Dividend) |
Upside To Fair Value (Not Including Dividend) |
| 15.63% | 8.73% |
|
12-Month Median Total Return Price (Including Dividend) |
Fair Value + 12-Month Dividend |
| $394.37 | $370.96 |
|
Discount To Total Price Target (Not A Fair Value Estimate) |
Discount To Fair Value + 12-Month Dividend |
| 13.95% | 8.52% |
|
Upside To Price Target ( Including Dividend) |
Upside To Fair Value + Dividend |
| 16.21% | 9.31% |
(Source: Morningstar, FactSet)
Morningstar’s discounted cash flow model estimates MA is worth about 30.7X forward earnings and that it is 8% undervalued, almost identical to my own valuation model.
Analysts expect MA to return to the upper end of its historical fair value range and deliver 16% total returns within 12 months.
- a relatively reasonable price target
| Rating | Margin Of Safety For Very Low Risk 13/13 Ultra SWAN Quality Companies | 2022 Fair Value Price | 2023 Fair Value Price |
12-Month Forward Fair Value |
| Potentially Reasonable Buy | 0% | $351.49 | $378.39 | $375.81 |
| Potentially Good Buy | 5% | $333.91 | $359.48 | $357.02 |
| Potentially Strong Buy | 15% | $298.77 | $321.64 | $319.44 |
| Potentially Very Strong Buy | 25% | $250.44 | $283.80 | $281.86 |
| Potentially Ultra-Value Buy | 35% | $228.47 | $245.96 | $244.28 |
| Currently | $339.37 | 3.45% | 10.31% | 9.70% |
| Upside To Fair Value (Including Dividends) | 4.15% | 12.08% | 11.31% |
MA, at its lowest point this year, was about 20% undervalued and a potentially strong buy. Today it’s a potentially good buy for anyone comfortable with its risk profile.
Risk Profile: Why Mastercard Isn’t Right For Everyone
There are no risk-free companies and no company is right for everyone. You have to be comfortable with the fundamental risk profile.
Mastercard’s Risk Profile Includes
- economic cyclicality risk: bond market expects a recession in 2024 (might slow growth but probably won’t turn it negative)
- regulatory risk (domestic and international anti-trust lawsuits)
- M&A risk: including regulatory approvals
- margin compression risk: EU is working on its own network, Russia is now using China’s Unipay, all businesses hate V and MA, though they have to use their networks
- disruption risk from blockchain and Defi: MA and V are both investing in block,
- labor retention risk (tightest job market in over 50 years and finance is a high paying industry) – rising wage pressures
- currency risk (growing over time due to faster growth overseas)
- cybersecurity risk: ransomware, hackers, Russian hacker attacks
Mastercard is not without issues in the near term. Cross-border transactions, which are particularly lucrative for the networks, came under heavy pressure due to the fallout from the pandemic and a reduction in global travel. We expect a full recovery, and this should drive relatively strong growth in the near term. From a longer-term point of view, we think it is likely that smaller and more regional networks are building out capacity for cross-border transactions, which could eat into growth a bit in the coming years, but we haven’t seen a material effect yet. While this situation bears watching, Visa and Mastercard’s global networks remain unparalleled, and we think this will remain the case for many years to come.” – Morningstar
There are many upstart competing payment processing networks, including one run by the EU.
Ethereum 2.0 and sharding has the potential to
- achieve 100,000 transactions per second (compared to Visa’s 65,000 and MA’s 5,000)
- and execute transfers at 1/20th the cost of V and MA
Ethereum’s upgrades are on track for complete the Sharding upgrade in 2023.
- so far blockchain has mostly stayed in its own lane but ETH developers want to turn ETH into the “global computer” and disrupt dozens of industries including payment processing
Dividend Kings S&P Valuation Tool, NY Fed, CNBC
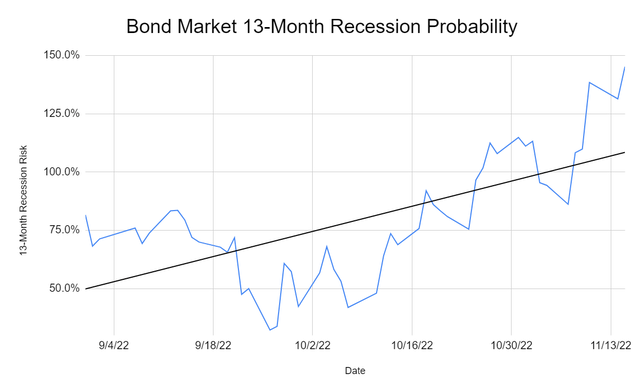
The bond market is now 100% certain (with very high conviction) that a recession is coming in 2023.
- Bloomberg’s model also says 100% risk of a recession
- Ned Davis Research 96%
- Conference Board 94%
- 85% of CEOs expect a mild and short recession in 2023
- 44% are still planning to hire more workers
- just 14% are planning to cut growth spending
David Rice
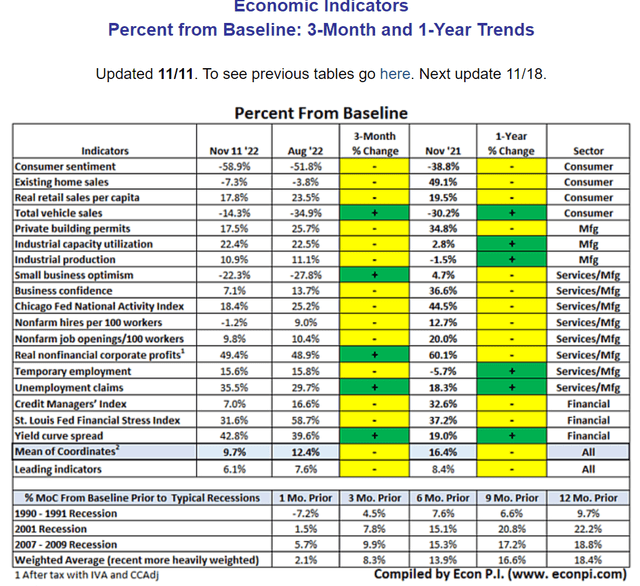
18 economic indicators point to a potential recession beginning in four to six months.
- March to May 2023
- April base-case
- agreeing with UBS and Goldman Sachs
How do we quantify, monitor, and track such a complex risk profile? By doing what big institutions do.
Long-Term Risk Management Analysis: How Large Institutions Measure Total Risk Management
See the risk section of this video to get an in-depth view (and link to two reports) of how DK and big institutions measure long-term risk management by companies
DK uses S&P Global’s global long-term risk-management ratings for our risk rating.
- S&P has spent over 20 years perfecting their risk model
- which is based on over 30 major risk categories, over 130 subcategories, and 1,000 individual metrics
- 50% of metrics are industry specific
- this risk rating has been included in every credit rating for decades
The DK risk rating is based on the global percentile of how a company’s risk management compares to 8,000 S&P-rated companies covering 90% of the world’s market cap.
Mastercard Scores 82nd Percentile On Global Long-Term Risk Management
S&P’s risk management scores factor in things like:
- supply chain management
- crisis management
- cyber-security
- privacy protection
- efficiency
- R&D efficiency
- innovation management
- labor relations
- talent retention
- worker training/skills improvement
- customer relationship management
- climate strategy adaptation
- corporate governance
- brand management
MA’s Long-Term Risk Management Is The 139th Best In The Master List (72nd Percentile In The Master List)
| Classification | S&P LT Risk-Management Global Percentile |
Risk-Management Interpretation |
Risk-Management Rating |
| BTI, ILMN, SIEGY, SPGI, WM, CI, CSCO, WMB, SAP, CL | 100 | Exceptional (Top 80 companies in the world) | Very Low Risk |
| Strong ESG Stocks | 86 |
Very Good |
Very Low Risk |
| Mastercard | 82 |
Very Good |
Very Low Risk |
| Foreign Dividend Stocks | 77 |
Good, Bordering On Very Good |
Low Risk |
| Ultra SWANs | 74 | Good | Low Risk |
| Dividend Aristocrats | 67 | Above-Average (Bordering On Good) | Low Risk |
| Low Volatility Stocks | 65 | Above-Average | Low Risk |
| Master List average | 61 | Above-Average | Low Risk |
| Dividend Kings | 60 | Above-Average | Low Risk |
| Hyper-Growth stocks | 59 | Average, Bordering On Above-Average | Medium Risk |
| Dividend Champions | 55 | Average | Medium Risk |
| Monthly Dividend Stocks | 41 | Average | Medium Risk |
(Source: DK Research Terminal)
MA’s risk-management consensus is in the top 28% of the world’s highest quality companies and similar to that of such other blue-chips as
- Lowe’s (LOW): Ultra SWAN dividend king
- Target (TGT): Ultra SWAN dividend king
- T. Rowe Price (TROW): Ultra SWAN dividend aristocrat
- Nestle (OTCPK:NSRGY): Ultra SWAN global aristocrat
- Visa (V): Ultra SWAN
The bottom line is that all companies have risks, and MA is very good, bordering on good, at managing theirs according to S&P.
How We Monitor MA’s Risk Profile
- 40 analysts
- two credit rating agencies
- 42 experts who collectively know this business better than anyone other than management
- and the bond market for real-time fundamental risk-assessments
When the facts change, I change my mind. What do you do, sir?” – John Maynard Keynes
There are no sacred cows at iREIT or Dividend Kings. Wherever the fundamentals lead, we always follow. That’s the essence of disciplined financial science, the math behind retiring rich and staying rich in retirement.
Bottom Line: 3 Reasons Mastercard Is The Ultimate Buffett-Style Blue-Chip Buy
Let me be clear: I’m NOT calling the bottom in MA (I’m not a market-timer).
Ultra SWAN quality has nothing to do with volatility; even Ultra SWANs can fall hard and fast in bear markets.
Fundamentals are all that determine safety and quality, and my recommendations.
- over 30+ years, 97% of stock returns are a function of pure fundamentals, not luck
- in the short term; luck is 25X as powerful as fundamentals
- in the long term, fundamentals are 33X as powerful as luck
While I can’t predict the market in the short term, here’s what I can tell you about MA,
- As close to God’s own dividend growth stock as exists
- safe 0.6% yield (growing 35% CAGR through 2025)
- 23.8% CAGR long-term total return guidance, almost 2.5X more than the S&P 500 and 2X the Nasdaq
- 10% historically undervalued, a potentially good buy
- 13.7X cash-adjusted PE (0.59 cash-adjusted PEG, hyper-growth at a wonderful price)
- 150% consensus return potential over the next five years, 19% CAGR, about 3X more than the S&P 500
- 2X the risk-adjusted expected returns of the S&P 500 over the next five years
If you want to sleep well at night knowing your hard-earned savings are in good hands, there is no better company to buy from than Mastercard.
If you want to buy the ultimate Buffett-style “wonderful company at a fair price” then Mastercard is just what you’re looking for.
If you want a relatively recession-resistant business with a fortress balance sheet, very good risk management and unbelievable free cash flow minting power, Mastercard is a great choice today.
While I can’t tell you what MA will do in the coming months, I can say with 80% confidence that buying it today will make you very happy in 5+ years.
And in 10+ years, you’ll likely fell like a stock market genius.
And in 15+ years? There is just one word for long-term investors buying MA today…retired;)
Disclosure: I/we have a beneficial long position in the shares of MA either through stock ownership, options, or other derivatives. I wrote this article myself, and it expresses my own opinions. I am not receiving compensation for it (other than from Seeking Alpha). I have no business relationship with any company whose stock is mentioned in this article.
Additional disclosure: DK owns MA in our portfolios.
—————————————————————————————-

Dividend Kings helps you determine the best safe dividend stocks to buy via our Automated Investment Decision Tool, Zen Research Terminal, Correction Planning Tool, and Daily Blue-Chip Deal Videos.
Membership also includes
-
Access to our 10 model portfolios (all of which are beating the market in this correction)
-
my correction watchlist
-
50% discount to iREIT (our REIT-focused sister service)
-
real-time chatroom support
-
real-time email notifications of all my retirement portfolio buys
-
numerous valuable investing tools
Click here for a two-week free trial, so we can help you achieve better long-term total returns and your financial dreams.
