
Summary:
- Bank of America may underperform peers in 2024 due to concerns about consumer spending exhaustion and rising loan delinquencies.
- The company’s increased use of leverage compared to rivals is also a factor contributing to its unfavorable outlook.
- Technical trading issues including bank-sector price underperformance, an atypical overbought condition in December, and truly weak On Balance Volume trends argue investors avoid this name.
Justin Sullivan/Getty Images News
Bank of America (NYSE:BAC) is one of the top U.S. consumer banks in the country. It is also a major money-center bank engaged in a range of financial transactions and trading on Wall Street.
I am becoming more worried consumers have reached an exhaustion point with their personal finances in late 2023, with credit card balances spiking, car loan delinquencies rising fast, and Christmas retail sales remaining lackluster (seasonal sales are now estimated to have grown right at the +3% rate of YoY CPI inflation, for no expansion in volumes moved vs. 2022).
In addition, the latest sharp rally in BAC’s stock quote from October appears to have played out in the context of peaking prices on Wall Street generally. I wrote two articles last week explaining why the Dow Theory for market predictions here and excessively bullish investor sentiment readings in December here, both argue for a lower U.S. equity market during Q1 2024.
Logically, you would expect some underlying trading problems for Bank of America to be part of its chart setup if trouble was brewing. Right on cue, I can identify several technical trading issues that exist for BAC shareholders. Standing in bearish contrast to it nearest peers, JPMorgan Chase (JPM), Citigroup (C), and Wells Fargo (WFC), a clear overbought condition is now crossed with an exceptionally weak On Balance Volume trend.
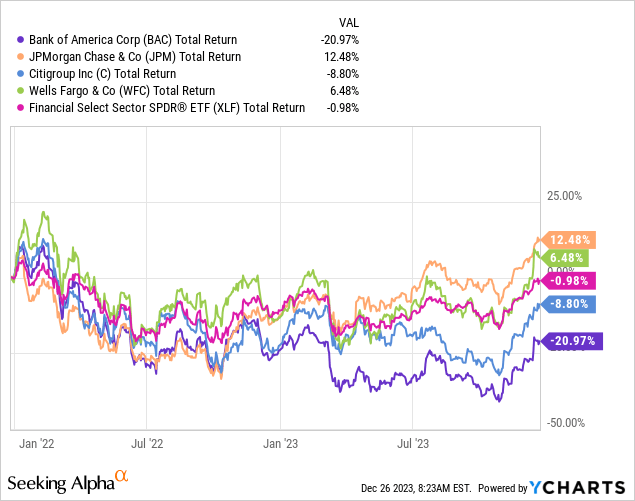
What this means for traders and shorter-term investors is Bank of America may continue to underperform immediate competitors for price performance, while its 2.9% dividend yield provides only minimal support for new purchases. My view is now may be a smart time to avoid the stock and/or sell part to all of your position. If we do get a recession in 2024, BAC should again be a real underperformer vs. the financial/banking group and its closest peers, just like 2022-23.
YCharts – Bank of America vs. Major Bank Peers, Total Returns, 1 Year YCharts – Bank of America vs. Major Bank Peers, Total Returns, 2 Years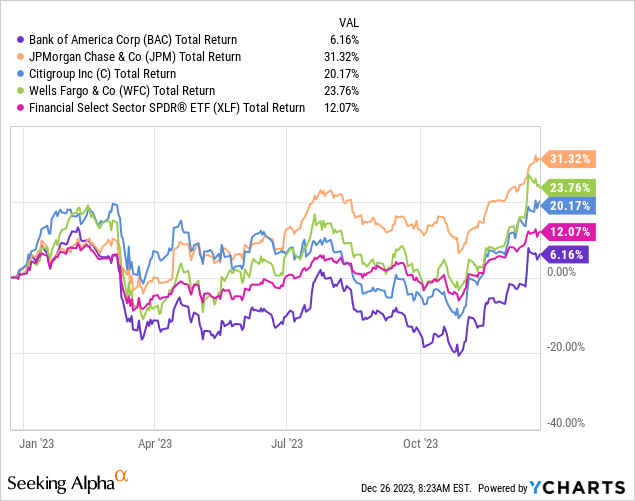
Technical Warning Signs
The whole banking sector is now very overbought for price changes, on the strong gains experienced over the last nine weeks. You have to go back to early 2021 or late 2019 to find similarly stretched numbers and ratios for rapid price growth. In hindsight, the overbought condition of early 2020 proved a prudent time to actually sell banks before the COVID-19 pandemic hit. Yet, banks would continue higher for another 6-12 months after the early 2021 situation.
Below I have drawn 12-month charts of daily changes for price and volume, plus readings in the 21-day Average Directional Index, 21-day Relative Strength Index, and On Balance Volume measurements. A comparison of the four biggest and most diversified money-center banks highlights something is amiss at Bank of America.
For starters, JPMorgan Chase has the healthiest looking technical chart pattern, when reviewing all kinds of data not pictured in this article. While now sitting in an extreme overbought condition, the obvious difference vs. the other banks is a super-strong On Balance Volume line. What this tells us is the number of aggressive buyers has been outstripping sellers on a regular trading session basis, while price has been in a steady uptrend.
Readings for the ADX above 30 (on my chosen time interval) and the RSI above 70 are relatively rare occurrences in blue chips. In terms of the natural ebb and flow of capital movements historically, a breather in price should be next over the following month or two.
StockCharts.com – JPMorgan Chase, 1 Year of Daily Price & Volume Changes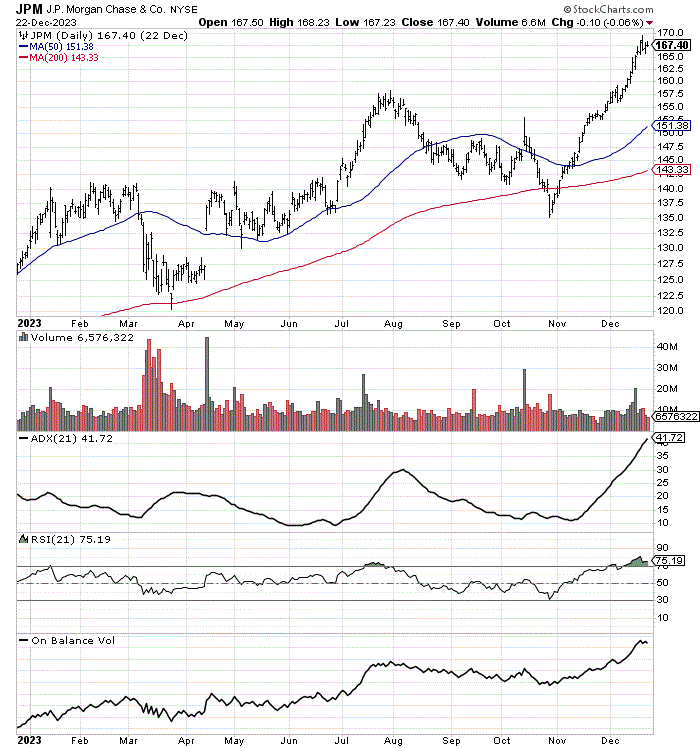
Perhaps the next healthiest chart pattern is the Wells Fargo picture. WFC did reach a new 52-week high in December. On Balance Volume is higher than summertime and rising nicely over the past year.
StockCharts.com – Wells Fargo, 1 Year of Daily Price & Volume Changes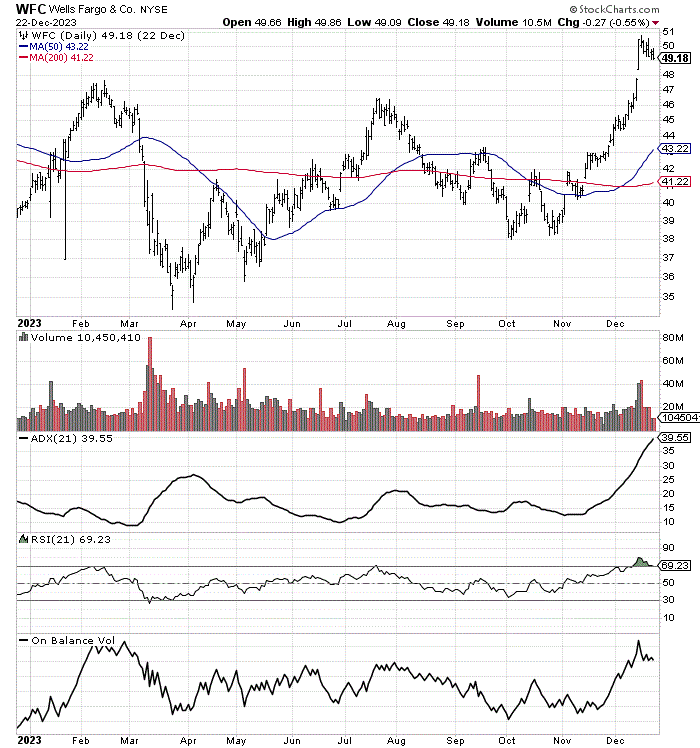
Things look a little weaker at Citigroup. Price has been on a tear since late October and is now back to Q1 2023 levels. On Balance Volume is higher vs. a year ago. Yet, OBV has not been able to break above the July peak.
StockCharts.com – Citigroup, 1 Year of Daily Price & Volume Changes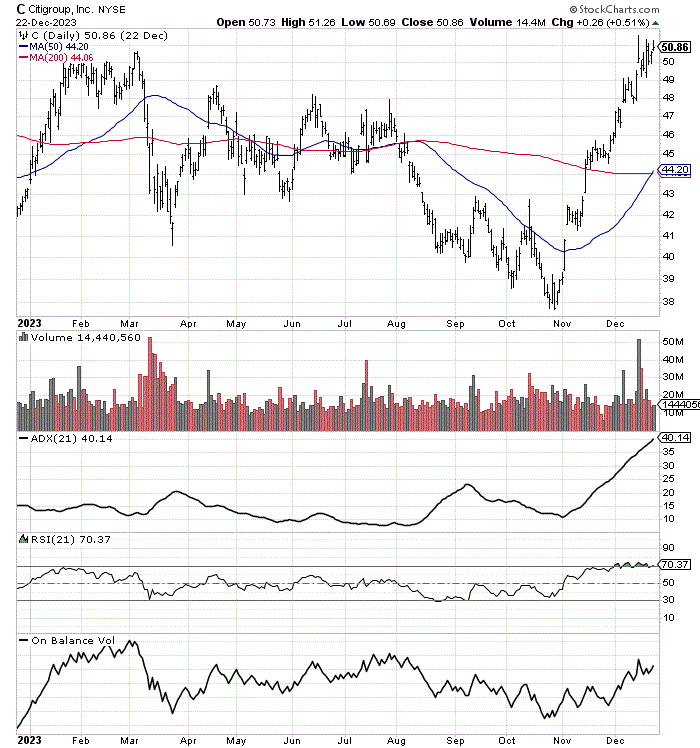
Which brings us to the chart readout for Bank of America. Price is lower than February, lagging its peers badly. On Balance Volume figures topped in early February (circled in blue below), and almost no serious buying has been apparent since July (blue arrow). The whole trend for OBV over the last 12 months of trading has been bearish for future price, in my view.
StockCharts.com – Bank of America, 1 Year of Daily Price & Volume Changes, Author Reference Points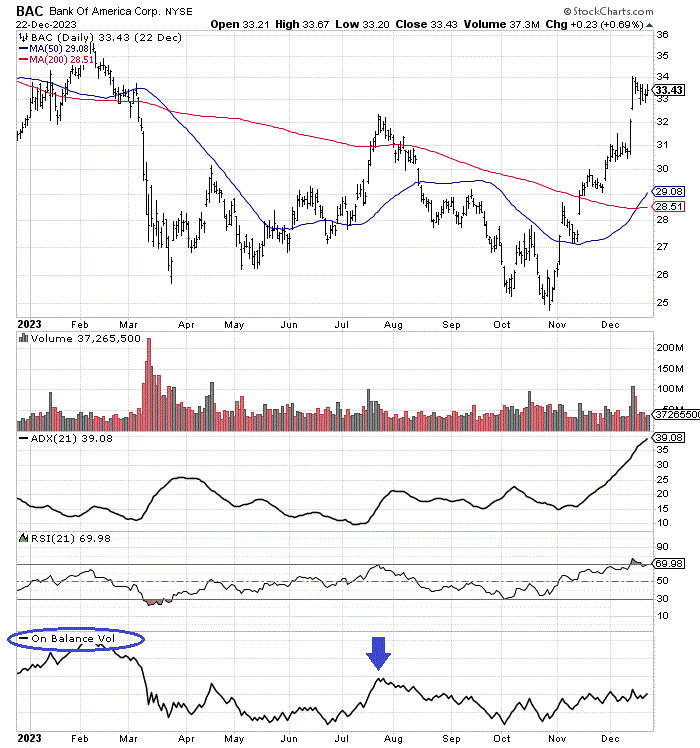
In fact, BAC is sitting at its most extreme overbought position now over the last 5 years of trading. At the same time, OBV has been performing horribly for an extended period, which is a rotten setup in my technical research. Today’s setup (red arrow below) is far more bearish than the previous two overbought instances with trading pattern similarities (green arrows). Both saw measurable OBV buying interest to support price.
StockCharts.com – Bank of America, 5 Years of Daily Price & Volume Changes, Author Reference Points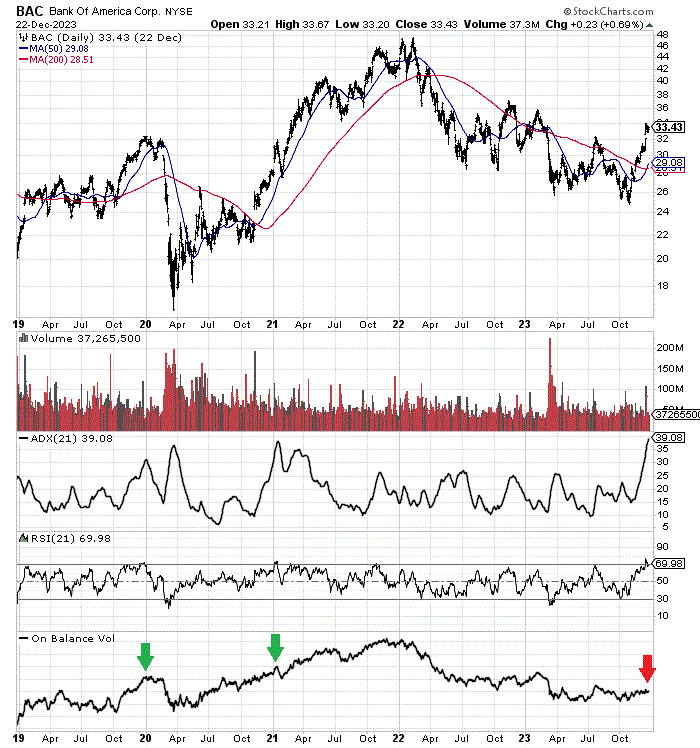
Increased Bank Leverage
One fundamental excuse for the lack of buying interest could be Bank of America’s expanded use of leverage in recent years. For example, you can review the 30% change in financial debt to equity over just the past three quarters of reporting, far surpassing the leverage change at peers.
YCharts – Bank of America vs. Major Bank Peers, Debt to Equity Percent Change, 1 Year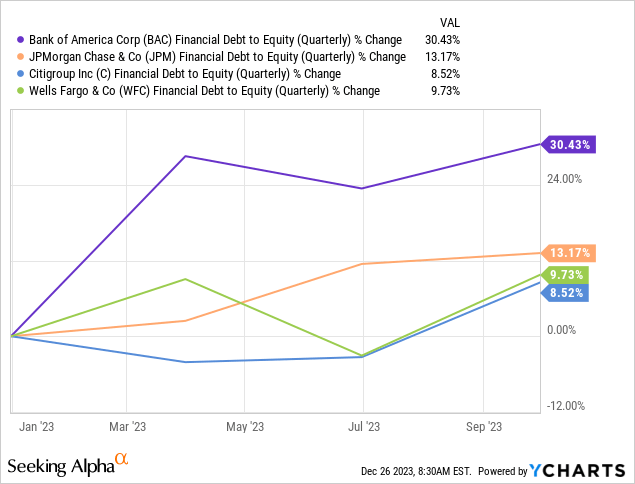
In addition, total liabilities as a ratio of total assets have grown faster than competitors and rivals over the last five years, including the COVID pandemic period.
YCharts – Bank of America vs. Major Bank Peers, Total Liabilities to Assets Percent Change, 5 Years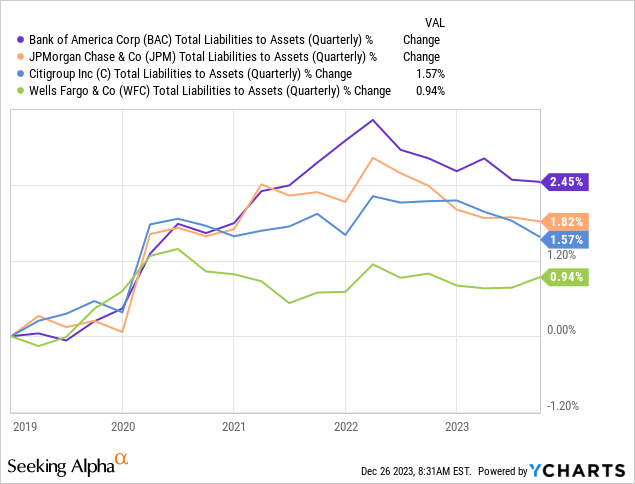
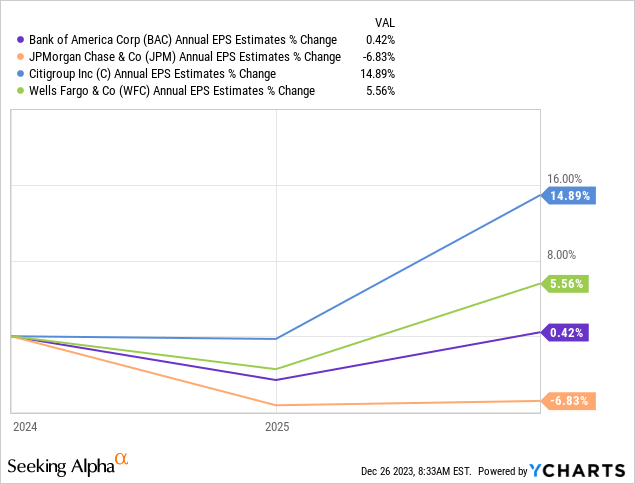
Partly from rising interest costs on debt, partly from its consumer loan focus being more susceptible to rising default risk, Wall Street analysts are projecting flat EPS for 2024-25 vs. this past year. And, Bank of America’s earnings forecast is weaker than the banking group average.
Seeking Alpha Table – Bank of America, Analyst Estimates for 2023-25, Made December 26th, 2023 YCharts – BAC vs. Major Bank Peers, Analyst Estimated EPS Growth for 2024-25, Made Dec 26th, 2023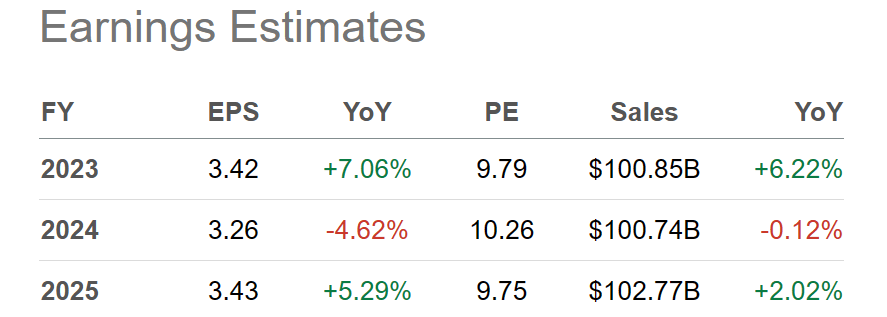
Final Thoughts
Basically, Bank of America is my least favorite choice of the major money-center banks. The company has been adding leverage at the end of the economic cycle, while large-volume share buyers have been missing in action during the end of 2023. My conclusion: if a recession and bear market are next in the U.S., BAC’s quote could easily lead the largest U.S. banks on the downside soon.
I don’t usually create downside target numbers for bank stocks. At this late stage of the Treasury yield curve inversion, the idea of investment risk honestly depends on how bad a recession gets for loan losses. At the very least, just coming off the extreme oversold condition of December should push BAC’s price back under $30 in the first half of 2024. Assuming a mild recession or even no recession (soft landing scenario), the $25 low of October may hold in 2024. However, if we experience a deep and/or prolonged economic contraction, quotes under $20 are definitely possible. For me, buying around $34 currently is fraught with risk, with worst-case downside potential of -40% or greater for total returns over the next year of trading.
What’s the upside for shares? In a truly rosy scenario, where the Federal Reserve can lower interest rates without a recession (which I find rather unlikely to happen in the real world), I am projecting gains would be limited in Bank of America. A multi-decade normal 12x P/E on current analyst estimates (not factoring in a recession) would translate into $40, and a total return advance closer to +20%.
I rate Bank of America shares a Sell and Avoid for investors with a time horizon of 12 months or less. If you own an oversized position with substantial unrealized gains, one suggestion to sidestep immediate capital gains taxation is to either sell in-the-money covered calls on your position or buy out-of-the-money puts as a hedge. That way you can at least profit from a cyclical swing lower in the stock on your option positioning (while holding paper losses on the actual shares).
Thanks for reading. Please consider this article a first step in your due diligence process. Consulting with a registered and experienced investment advisor is recommended before making any trade.
Analyst’s Disclosure: I/we have no stock, option or similar derivative position in any of the companies mentioned, and no plans to initiate any such positions within the next 72 hours. I wrote this article myself, and it expresses my own opinions. I am not receiving compensation for it (other than from Seeking Alpha). I have no business relationship with any company whose stock is mentioned in this article.
This writing is for educational and informational purposes only. All opinions expressed herein are not investment recommendations and are not meant to be relied upon in investment decisions. The author is not acting in an investment advisor capacity and is not a registered investment advisor. The author recommends investors consult a qualified investment advisor before making any trade. Any projections, market outlooks, or estimates herein are forward-looking statements based upon certain assumptions that should not be construed as indicative of actual events that will occur. This article is not an investment research report, but an opinion written at a point in time. The author's opinions expressed herein address only a small cross-section of data related to an investment in securities mentioned. Any analysis presented is based on incomplete information and is limited in scope and accuracy. The information and data in this article are obtained from sources believed to be reliable, but their accuracy and completeness are not guaranteed. The author expressly disclaims all liability for errors and omissions in the service and for the use or interpretation by others of information contained herein. Any and all opinions, estimates, and conclusions are based on the author's best judgment at the time of publication and are subject to change without notice. The author undertakes no obligation to correct, update or revise the information in this document or to otherwise provide any additional materials. Past performance is no guarantee of future returns.
Seeking Alpha’s Disclosure: Past performance is no guarantee of future results. No recommendation or advice is being given as to whether any investment is suitable for a particular investor. Any views or opinions expressed above may not reflect those of Seeking Alpha as a whole. Seeking Alpha is not a licensed securities dealer, broker or US investment adviser or investment bank. Our analysts are third party authors that include both professional investors and individual investors who may not be licensed or certified by any institute or regulatory body.