Summary:
- Despite a reduction in total debt to $143B post-Warner Media spin-off, AT&T grapples with market scrutiny amid rising interest rates and dividend sustainability concerns.
- Deep Dive Analysis: Explore AT&T’s debt landscape to discern risk levels and strategic implications, shedding light on its ability to navigate turbulent market conditions.
- Comparative analysis showcases AT&T’s management of debt from record levels, offering insights into its financial resilience and adaptive strategies.
- Is AT&T’s towering debt a gamble, and does it jeopardize the dividend’s stability, prompting investor caution?
- AT&T’s comfortably manageable debt, alongside strategic initiatives, positions it as a robust investment opportunity, promising growth and dividend stability.
Justin Sullivan
Over the last ten years, AT&T (NYSE:T) has faced big challenges due to changes in how people use technology, like cutting the cord on cable TV and switching to streaming services. To adapt, AT&T made some bold moves, like buying DirectTV and Time Warner for over $100 billion. But those decisions didn’t pay off, and shareholders weren’t happy as both deals were reversed, costing the company leaps of money. Investors also got worried about AT&T’s debt and whether it could make enough money, especially after spending a lot in the 2021 C-band spectrum auction. Now that AT&T has finished merging and demerging with Warner Media/Discovery, it’s important to look closely at its debt situation in today’s changing market.
Investment thesis
Despite the challenges, AT&T might be getting punished too hard by the market. While its stock dropped about 8% in the past year, way behind the S&P 500’s 33% strong rise, it still has potential for long-term investors. AT&T is working hard to be the best at providing high-quality networks. With the biggest wireless network in North America and lots of fiber infrastructure reaching millions of homes and businesses, AT&T is set to meet the growing need for better connections. Plus, its commitment to new technologies like 5G and Open Radio Access Networks (Open RAN) shows it’s ready to adapt to changing markets.
Debt assessment and analysis
Given Investor doubts about AT&T’s debt, it’s crucial to take a close look at its debt situation. With the structural and organizational mega changes completed, it’s a good time to reassess against the backdrop of a changed interest rate environment. Considering today’s economic challenges like rising inflation and interest rates, understanding how AT&T manages its debt is really important. By looking at key numbers like how much debt it has compared to its profits and how much free cash flow it is generating, we can figure out how risky AT&T’s debt is in these tough times. And as rules change and markets keep shifting, knowing where AT&T’s debt is headed is key for making smart investment choices.
What level of risk does AT&T’s debt load pose amid challenging macro-economic conditions?
Deep dive into AT&T’s debt
AT&T provides a lot of detail on its debt, but in a relatively difficult to use format. The latest data available is for Q4/2023 and this is a good time for such an analysis given a fully completed financial year.
After organizing and refining this data into a more accessible format and disregarding unusable information, we’re poised for an in-depth examination of AT&T’s debt. Moreover, having conducted similar analyses previously enables us to draw insightful comparisons. However, before delving into these comparisons, it’s necessary to establish several key assumptions:
1) As of the end of Q4/2023, we’re focusing on a total debt figure of $143.3 billion .
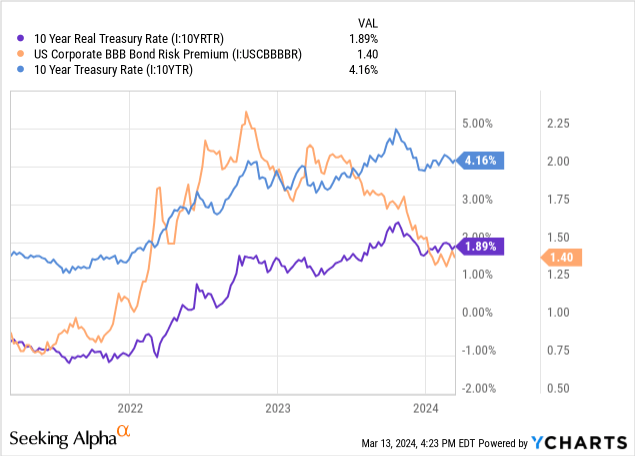
2) For debt with floating interest rates, we’ll hypothetically assign a coupon rate of 7%. This assumption, although conservative, is based on the current interest rate environment, considering a 10-Year Treasury Rate of 4.2% and a BBB bond risk premium of nearly 200 basis points, aligning with AT&T’s long-term issuer rating from S&P.
For AT&T’s fixed rate debt, we can get a first impression of its composition by drawing a tree map where the size of the rectangle indicates the share in total debt by year.
AT&T Fixed Rate Debt Tree Map (Designed by author)
It’s evident that the maturity dates and amounts of the debt are quite diverse, with four out of the top ten debt portions maturing in 2053 and beyond, three within the next 6-10 years, and three within the next five years.
When visualizing this data through a cumulative calculation, we observe that within the upcoming five years (2024 to 2028), approximately 23% of the total fixed long-term debt is set to mature.
AT&T Fixed Rate Debt and Weighted Coupon Rate (Designed by author)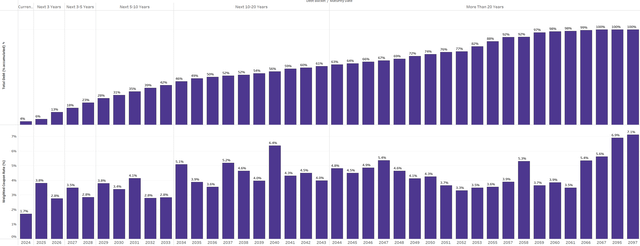
Looking ahead, 14% of the debt is set to mature within 5-10 years, while an additional 15% falls due within 10-20 years. This totals to 61% of the total debt due within the next 20 years. Notably, a significant portion of outstanding debt extends from 2044 to 2097, a period so distant that its implications are uncertain. Given the potential for transformative technological advancements driven by AI in the coming decades, predicting the landscape of companies and their roles becomes exponentially uncertain and futile.
Returning to the present, it’s unsurprising that, on average, coupon rates increase with maturity, with the highest rates occurring in 2095 and 2097. However, there are exceptions; for instance, the years 2051 to 2055 exhibit lower rates compared to some earlier maturing debt in 2034 and 2040. Conversely, the highest coupon rate observed for debt maturing within the next decade is 4.14% in 2031. This reflects AT&T’s strategy of leveraging historically low interest rates by refinancing debt, even if it entails paying redemption premiums. Overall, 23% of the total debt carries a coupon below 3%, while another 46% features a coupon below 4%. Conversely, 31% of the debt carries coupons above 4%, exceeding the 10-Year Treasury Rate. That is good a mix-up but it could have been improved if AT&T had been more aggressive in exploiting the decade-long low interest rate environment.
AT&T Fixed Rate Debt, Weighted Coupon Rate and Time to Maturity (Designed by author)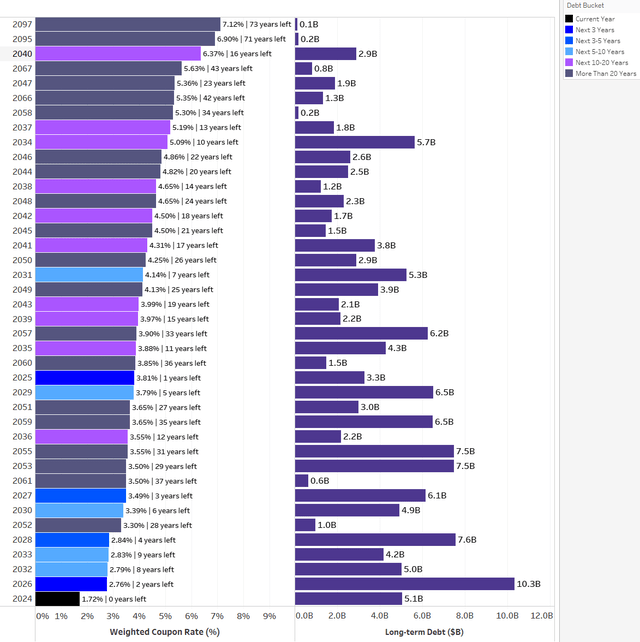
While AT&T’s fixed rate debt will have to be repaid over a very long time period, its remaining floating rate debt matures between 2024 and 2025, commanding a minor share of 2.1% of overall debt and 26.4% over that time period.
AT&T Fixed and Floating Rate Debt (Designed by author)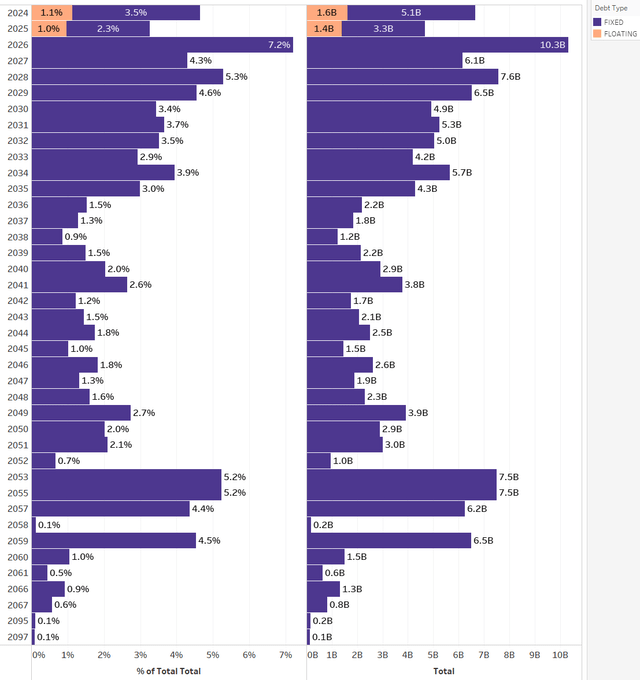
Having explored what AT&T’s current debt schedule looks like, let’s now compare it to previous points of time to better understand how AT&T has been managing its debt as it navigated the aftermath of the pandemic amid an inflationary and high interest rate environment.
Change in AT&T’s debt schedules
Following the spin-off of Warner Media and merger with Discovery, AT&T’s debt schedule reflects these structural changes very clearly. For instance, by the end of Q3/2021 AT&T’s total debt was recorded at $171B and has dropped massively to $143.3B following the merger. Most of the debt that was repaid was initially due over the next five years, i.e. from 2022 to 2026 with further reductions spreading relatively evenly between 2028 to 2042. As a result AT&T was basically able to get itself a lot breathing room over the near-term as total debt over the next five years dropped from $58B to $42B.
AT&T – Change in Debt Schedules Q4/2023 Update vs Q4/2022 Update (Designed by author)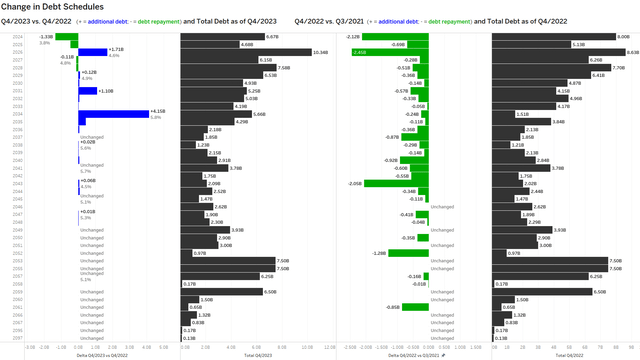
Another way to illustrate this is by plotting debt composition data into pie charts segmented by debt maturity buckets:
- By the end of Q1/2020, 48.2% of total long-term debt was due within the next five years
- By the end of Q3/2020, 33.8% of total long-term debt was due within the next five years
- By the end of Q3/2021, 33.9%% of total long-term debt was due within the next five years
- By the end of Q4/2022, 29% of total long-term debt was due within the next five years
- By the end of Q4/2023, 24.8% of total long-term debt was due within the next 5 years
AT&T – Change in Debt Composition over time (Designed by author)
Regarding the 5-10-year debt category, its proportion has steadily risen from 9.6% in Q1/2020 to 18.1% in Q4/2023. This trend makes it evident, both numerically and visually, that a significant portion of the refinanced debt has been shifted far into the future. Consequently, this shouldn’t cause much concern for investors. Moreover, most of the debt repaid following structural changes was originally due within the next five years, explaining the rapid increase in the 5-10 year debt category. While a 5-10-year timeframe doesn’t stretch over decades, it provides ample time for AT&T to refinance or pay down the debt, leveraging its strong internal cash flow. Given the inherent uncertainty in long-term financial projections, we’ll now focus on analyzing the medium-term risk posed by AT&T’s debt level, spanning from today until the end of 2028.
What level of risk does AT&T’s debt level pose?
Over the next five years, AT&T faces debt repayments totaling $35.4 billion. To assess the level of risk posed by this debt, we’ll consider three scenarios:
- BASE Scenario: For 2024, AT&T is guiding for $17B to $18B in FCF and I wouldn’t be surprised if low FCF generation in Q1 which might be reported in a couple of weeks will freak out the markets again as it did in 2023. I do buy that projection from AT&T but in order to remain conservative I am materially scaling it down to $16.8B for the model as a starting value. To be even more conservative and one might argue even too conservative for a base case, I do not model in any increase in FCF over the next years. EBITDA is projected to marginally grow by 2% every year from a base of $43.4B with dividends remaining flat.
- OPTIMISTIC Scenario: FCF aligns with management’s midpoint projection of $17.5 billion for 2024 and then grows at a 3% rate. EBITDA also grows by 3% annually, with dividends starting to increase modestly by 2%, focusing on deleveraging or building cash reserves for potential future capex needs, for instance for 6G.
- PESSIMISTIC Scenario: This scenario features a sharp decline in FCF from the FY2023 level of $16.8 billion to $14.5 billion in 2024, significantly below management’s expectations. FCF is modeled to grow by only 1% annually until 2028, reflecting a slow recovery pace. EBITDA experiences a similar decline, albeit less severe, followed by a gradual 2% recovery each year. Despite the challenges, dividends are expected to remain unchanged.
All scenarios presented in the analysis are conservative, primarily differing in the degree of conservatism. They aim to demonstrate that even in the event of a significant decline in FCF starting in 2024, followed by a gradual recovery, AT&T’s debt level remains comfortably manageable. In 2023, AT&T generated FCF of $16.8 billion, and a similar level of FCF generation is anticipated between 2024 and 2028 in the base scenario.
Over the next five years, total debt is projected to decrease from $143.3 billion to $107.9 billion. According to the debt schedule, AT&T will need to redeem approximately $35.4 billion in debt between 2024 and 2028. However, it is expected to generate around $43.3 billion in FCF after dividends under the BASE Scenario, which would more than cover its debt obligations. This indicates an FCF buffer of nearly $8 billion, or approximately 9% lower FCF than expected under the BASE Scenario, for AT&T to service its debt without additional borrowing.
Even if the conservative BASE scenario materializes, AT&T can still generate sufficient FCF to meet its debt obligations without resorting to dividend cuts or suspensions.
Under this scenario, AT&T’s current net debt to EBITDA multiple of 3.3 is projected to decrease to as low as 2.3x by the end of 2028, falling below the generally accepted threshold of 2.5x, considered a reasonably safe level of debt.
BASE scenario
AT&T – BASE Scenario 2024-2028 (Designed by author)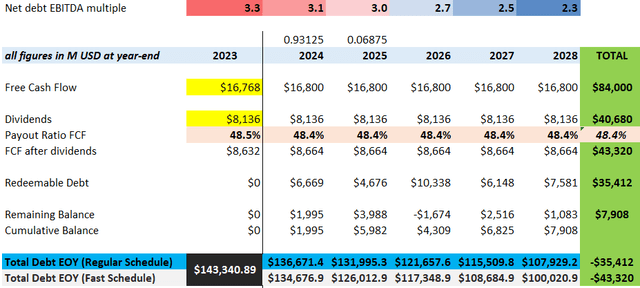
In the PESSIMISTIC Scenario FCF is projected to experience a significant decline in 2024, dropping from $16.8 billion in 2023 to $14.5 billion. Although FCF is expected to gradually recover over the following years, reaching $15.7 billion by the end of 2028, it will still fall short of the FY2023 value. Despite this seemingly worst-case scenario, AT&T would be capable of generating FCF after dividends totaling $34.8 billion, only slightly below the $35.4 billion required to cover total redeemable debt.
During this period, the dividend will remain stable, while net debt to EBITDA multiple is forecasted to reach a low of 2.6x by the end of 2028. This represents a reasonably safe level of debt, teetering on the brink of breaking below the widely accepted 2.5x threshold. Should this scenario materialize, it’s likely that the stock would face further weakness, though neither the business nor the dividend would be at immediate risk. However, it’s important to note that such a slow deleveraging process and a declining or stagnating business performance would likely be met with market dissatisfaction.
PESSIMISTIC scenario
AT&T – PESSIMISTIC Scenario 2024-2028 (Designed by author)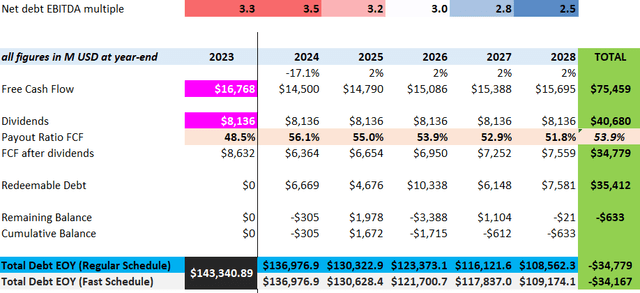
In the OPTIMISTIC Scenario, prospects materially improve although it’s important to acknowledge that true optimism regarding AT&T’s future may have waned, given the stock price performance in recent years.
We are projecting moderate annual growth of 3% for both EBITDA and FCF over the next five years, along with a 2% dividend growth rate. With these assumptions, the projected 5-year FCF after dividends amounts to an impressive $50.5 billion. This figure significantly exceeds the redeemable debt obligations of “only” $35.4 billion.
AT&T is anticipated to generate excess FCF in every year except 2026, allowing for the accumulation of a substantial liquidity buffer of nearly $15 billion. This surplus liquidity can be allocated towards accelerated debt redemption, share buybacks, investments in 6G technology, or to prepare for unforeseen events.
While the dividend will experience gradual growth, the payout ratio is expected to decline from the high 40s to the low 40s, providing a comfortable margin of security. If excess cash flow is not geared towards accelerated debt redemption, the net debt to EBITDA multiple will reach a multi-decade low of 2.2x by the end of 2028. However, if all excess cash flow is dedicated to debt reduction, this multiple could decrease to a very safe level of 1.9x.
OPTIMISTIC scenario
AT&T – OPTIMISTIC Scenario 2024-2028 (Designed by author)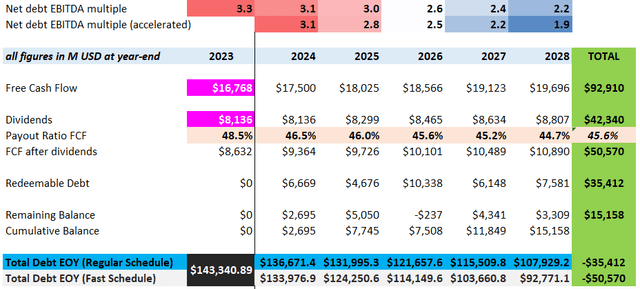
Investor takeaway
In light of the comprehensive analysis conducted on AT&T’s debt situation through the end of Q4/2023, it becomes evident that the company possesses the financial capacity to not only service its debt comfortably but also embark on a trajectory toward substantial debt reduction while maintaining its robust dividend payout. .
Following the spin-off of Warner Media, AT&T’s absolute debt level has been reduced significantly while its overall net debt to EBITDA ratio has actually climbed and is currently around 3.3x. While this level of debt warrants attention, particularly in the current high interest rate environment, it is noteworthy that the majority of AT&T’s debt is fixed and not due for repayment over the next five years, thus offering a degree of stability.
The market’s pessimism towards AT&T is completely misplaced in my view, and I believe it has got it entirely wrong. Even in a PESSIMISTIC Scenario, which is unlikely given management’s guidance and the lessons learnt in 2023, AT&T stands poised to maintain its dividend while gradually reducing its leverage to a manageable 2.5x. In the BASE Scenario, significant deleveraging is anticipated, with leverage expected to decrease substantially to 2.3x over the next five years. Under the OPTIMISTIC Scenario, AT&T could potentially achieve debt levels not seen in a decade, reaching as low as 1.9x, effectively dispelling market concerns surrounding its debt servicing capabilities .
The decision to invest in AT&T should not be based solely on its debt but rather on its fundamental business performance. As long as AT&T remains the cash generator we are used to, debt shouldn’t be the problem.
Even as markets surge to record highs, AT&T’s stock offers an attractive price and valuation proposition, boasting a dividend yield of 6.6%. Additionally, its fiscal year-end 2023 free cash flow dividend payout ratio was below 50%. Ultimately, while uncertainties persist in AT&T’s journey, prudent financial management, strategic initiatives, and technological advancements offer avenues for optimism.
Given these factors, I see no justification for the prevailing negativity on the stock. Long-term investors stand to reap substantial rewards.
Analyst’s Disclosure: I/we have a beneficial long position in the shares of T either through stock ownership, options, or other derivatives. I wrote this article myself, and it expresses my own opinions. I am not receiving compensation for it (other than from Seeking Alpha). I have no business relationship with any company whose stock is mentioned in this article.
I am not offering financial advice but only my personal opinion. Investors may take further aspects and their own due diligence into consideration before making a decision.
Seeking Alpha’s Disclosure: Past performance is no guarantee of future results. No recommendation or advice is being given as to whether any investment is suitable for a particular investor. Any views or opinions expressed above may not reflect those of Seeking Alpha as a whole. Seeking Alpha is not a licensed securities dealer, broker or US investment adviser or investment bank. Our analysts are third party authors that include both professional investors and individual investors who may not be licensed or certified by any institute or regulatory body.
