Summary:
- GameStop shares are surging higher as online trading communities are once again focusing on heavily-shorted stocks and social media stars re-emerge from long-term hibernation.
- However, we view the stock as a “strong sell” due to weak revenue trends and heightened competition from online retailers.
- Technical analysis suggests potential areas of support and resistance, but mixed chart indicators do not strongly support bullish trades.
Anne Czichos
One of the market’s favorite “meme stocks” is making headlines once again, as shares of GameStop Corporation (NYSE:GME) have posted single-session gains of nearly 75% and re-ignited the passions of various online trading communities focused on buying heavily-shorted stocks. Most of this attention seems to be stemming from new internet posts made by “Roaring Kitty”, which is the online moniker of one of the most famous GameStop traders (and someone that has largely been missing from public view since 2021).
But while these short-term gains might seem to be alluring for some in the online trading community, we find it hard to believe that a simple re-introduction of a controversial social media figure can be enough of a catalyst to establish a sustainable run higher in GME share prices. As a result, we are viewing the stock as a “strong sell” with share price valuations trading at extremely elevated levels.
Quarterly Earnings (GameStop)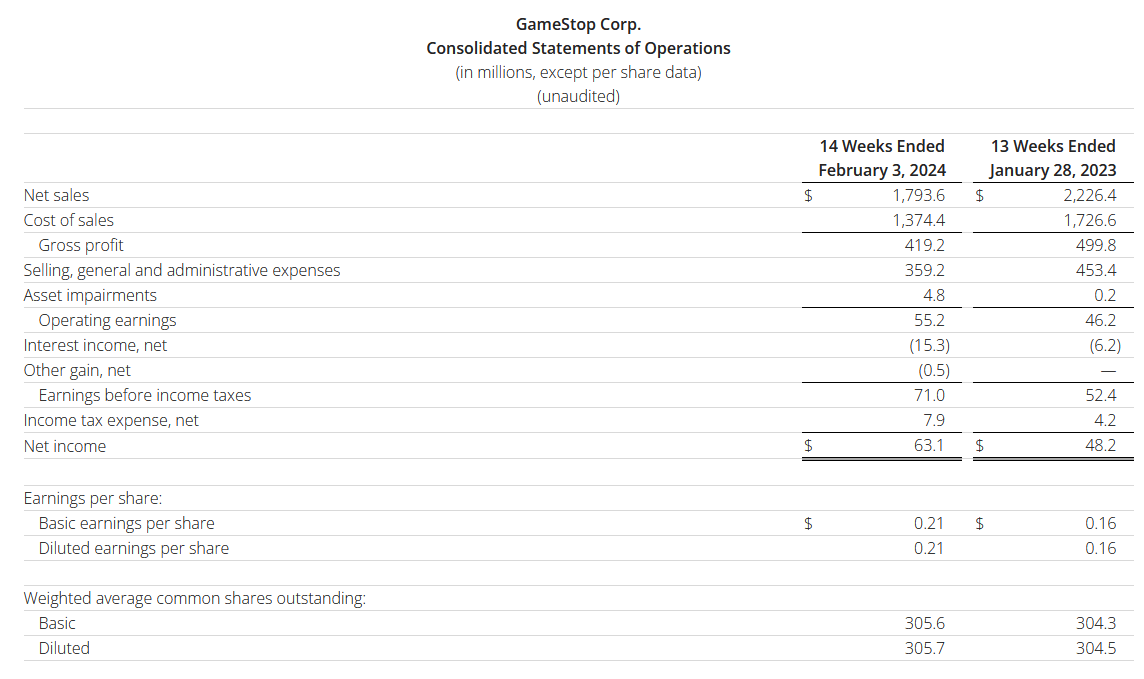
Perhaps the most glaring reasons that describe our extreme distaste for long positions in GME can be found in the company’s most recent earnings report, which revealed the need for job cuts (as a means for reducing costs) and continued weakness in revenues due to heightened competition from online retailers.
For the fourth-quarter period, GameStop reported $1.79 billion in revenues, marking a -19.73% decline from the $2.23 billion that the company recorded during the same period in the prior year. Overall, these results were not entirely surprising, given the fact that broad weakness has been seen throughout the industry as a whole. Rising price inflation and general economic weakness have placed a significant drag on consumer spending, and GameStop has not been the only casualty seen in the space. Specifically, these areas of weakness were also present in recent earnings reports from Electronic Arts (EA) and Take-Two Interactive (TTWO), so it is clear that these are broad hurdles that extend far beyond GameStop individually.
GME: Monthly Chart (Income Generator via TradingView)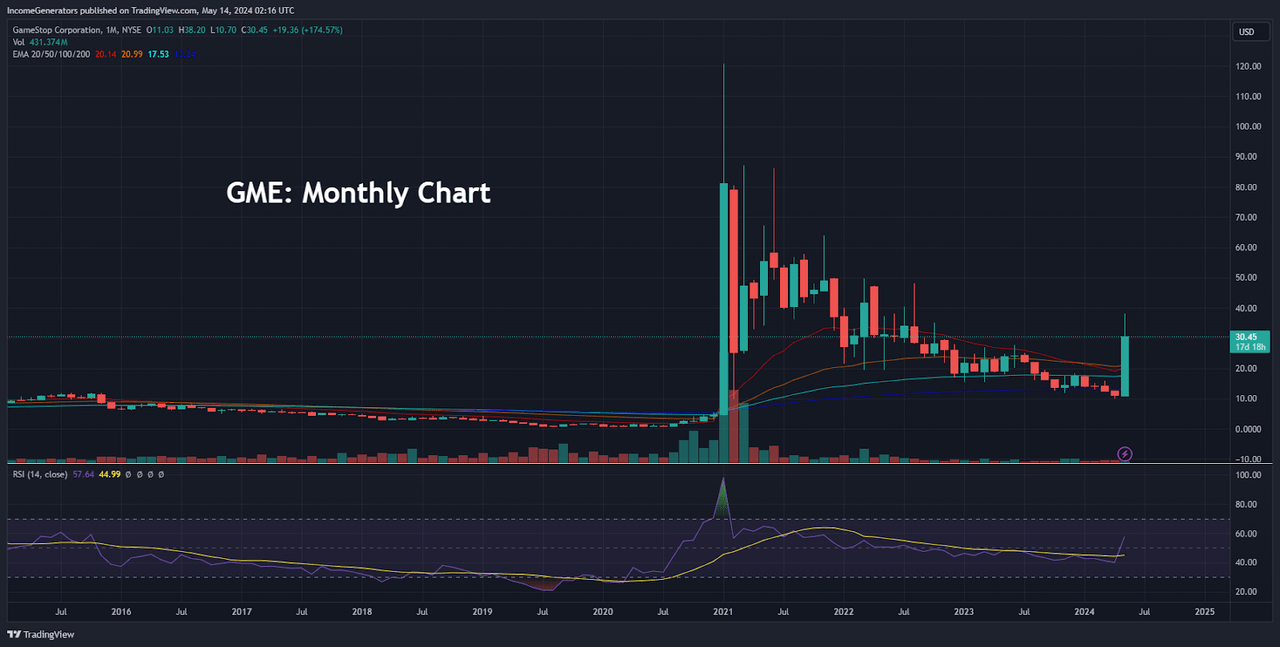
All of that said, it is not entirely clear that GameStop is likely to trade on fundamentals given this resurgence in certain types of trading strategies. For these reasons, we think it might be most prudent to look at share prices themselves and identify specific price levels that can be used to establish positions in the event that share prices continue to move higher.
Needless to say, the GME monthly price history is one of the most unique charts in the entire stock market. In split-adjusted terms, shares of GME rallied from $3 to more than $120 in just three months. Clearly, these types of gains were not based on fundamental factors revealed in quarterly earnings reports – so, we think that this is the perfect type of asset to apply a technical charting analysis approach that can identify potential areas of support and resistance.
GME: Moving Average Breaks (Income Generator via TradingView)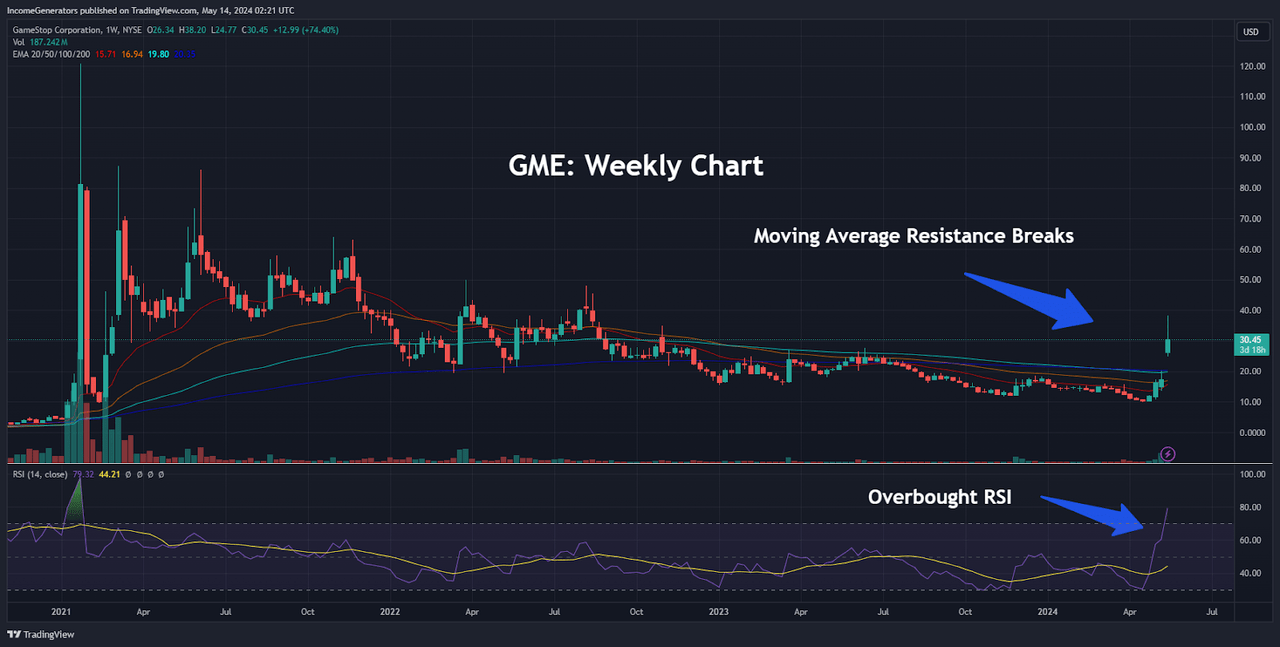
When looking at the weekly charts, we can see that the recent surge higher has forced a breach of all of the stock’s major moving averages. Specifically, we can see that the 20-week, 50-week, 100-week, and 200-week exponential moving averages have broken to the topside and this does support the bullish outlook for further gains in GME share prices. However, this positive momentum should be viewed with caution, as weekly readings in the Relative Strength Index (RSI) have moved into overbought territory – and this suggests that the recent upward moves in price action have reached a point of exhaustion.
GME: Historical Resistance Zones (Income Generator via TradingView)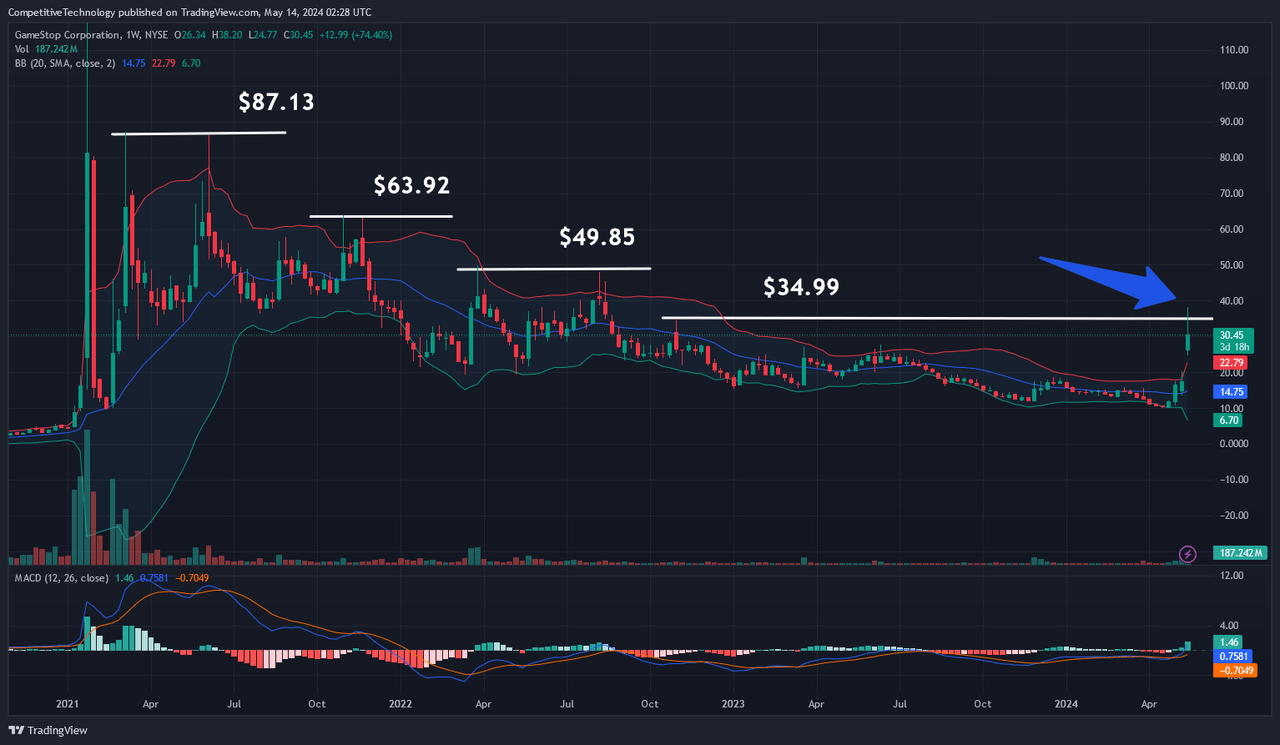
With this moderately bullish bias in trend direction, we can also see that historical resistance zones have already come under pressure. Specifically, we can look at the October 2022 highs of $34.99 and see that this resistance zone has already been breached. Given this price break, the next upside target becomes the March 2022 high at $49.85, which is then followed by the November 2021 highs at $63.92, and the March 2021 highs at $87.13. At this stage, however, technical indicator readings fail to support the argument for continued upside momentum, as share prices are currently trading well above the upper Bollinger Band and long-term readings in the Moving Average Convergence Divergence (MACD) have essentially flat-lined in bearish territory.
GME: Fibonacci Retracement Levels (Income Generator via TradingView)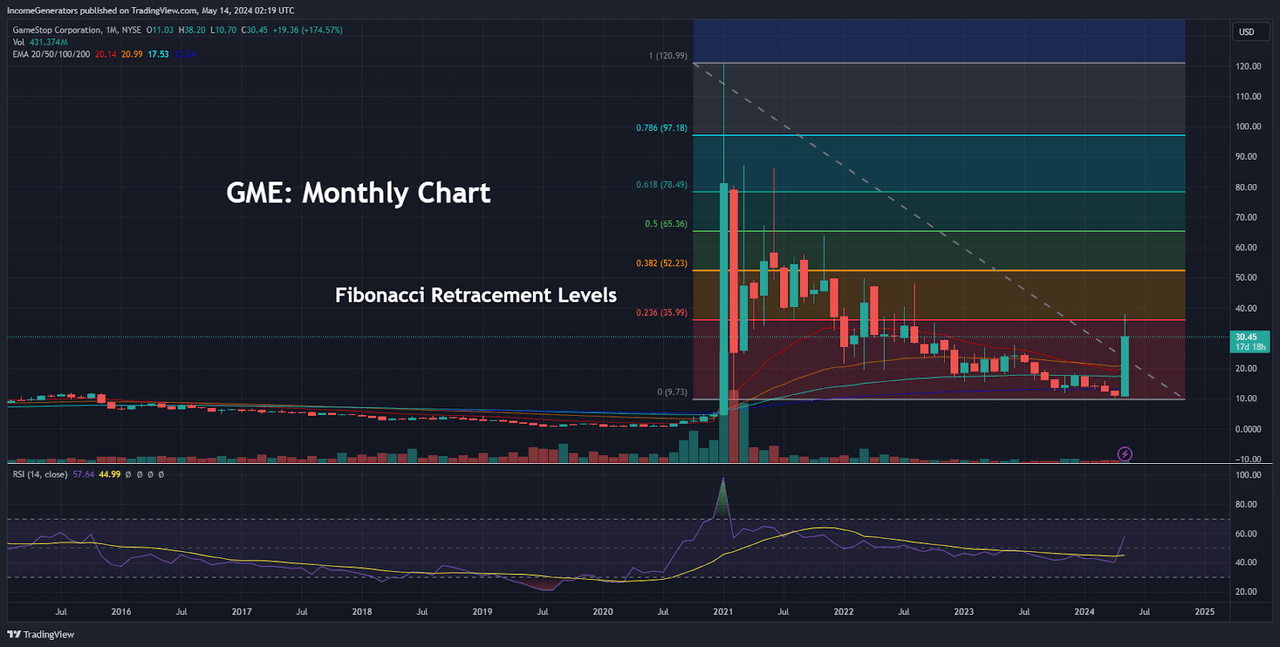
At best, we would have to describe this as a “mixed” technical picture – and certainly not one that strongly indicates high-probability success rates for bullish trades. But, if we do start to see an extension within these short-squeeze influences, we can also use Fibonacci retracement analysis to identify potential upside targets. Looking at the dominant bear-trend move from the January 2021 highs of $120.75 to the April 2024 lows of $9.95 per share, we can see that the 23.6% Fibonacci retracement (located at $36.11) has already been breached. Of course, this qualifies as a bullish event and now targets the 38.2% retracement of this long-term decline (which is located at $52.29).
If bullish traders are able to propel share prices above this level, the next price targets become the 50% retracement of the aforementioned price move (which is located at $65.36). Specifically, this price zone contains added significance due to the fact that this level falls within relatively close proximity to the November 2021 highs. Finally, any upside break of these levels would then target the 61.8% Fibonacci retracement of the dominant trending move (located at $78.43) and then the 78.6% Fibonacci retracement (which is located at $97.04). Ultimately, these price zones can be viewed as attainable due to the fact that monthly indicator readings in the RSI are nowhere near overbought territory and are currently holding near the midpoint of the histogram.
However, given the lack of confluence present when analyzing various time intervals (monthly, weekly, and daily price charts), our preferred criteria required to initiate trading positions from the long side are simply not present. This is to say nothing of the fact that GameStop’s most recent corporate earnings releases suggest continued declines in revenue that extend even beyond the company itself and could remain heavily influenced by sluggishness in U.S. consumer spending habits. Overall, we do not believe that this is a scenario pointing to the favorable outlook that would be needed in order to establish long positions in GME stock.
As a final note of extreme caution, we must make abundantly clear that there are significant risks involved when trading under these types of circumstances. Given GameStop’s well-documented history as one of the most shocking short-squeezes ever recorded, the potential for substantial loss is quite elevated (on both sides of the market). Notably, it has been reported that short-sellers have already experienced paper losses of $1.4 billion following the share price rallies on Monday. So, if you are a conservative investor with a low tolerance for risk, it is probably best to watch these events from the sidelines (rather than as an active investment participant).
Analyst’s Disclosure: I/we have no stock, option or similar derivative position in any of the companies mentioned, and no plans to initiate any such positions within the next 72 hours. I wrote this article myself, and it expresses my own opinions. I am not receiving compensation for it (other than from Seeking Alpha). I have no business relationship with any company whose stock is mentioned in this article.
Seeking Alpha’s Disclosure: Past performance is no guarantee of future results. No recommendation or advice is being given as to whether any investment is suitable for a particular investor. Any views or opinions expressed above may not reflect those of Seeking Alpha as a whole. Seeking Alpha is not a licensed securities dealer, broker or US investment adviser or investment bank. Our analysts are third party authors that include both professional investors and individual investors who may not be licensed or certified by any institute or regulatory body.
