Summary:
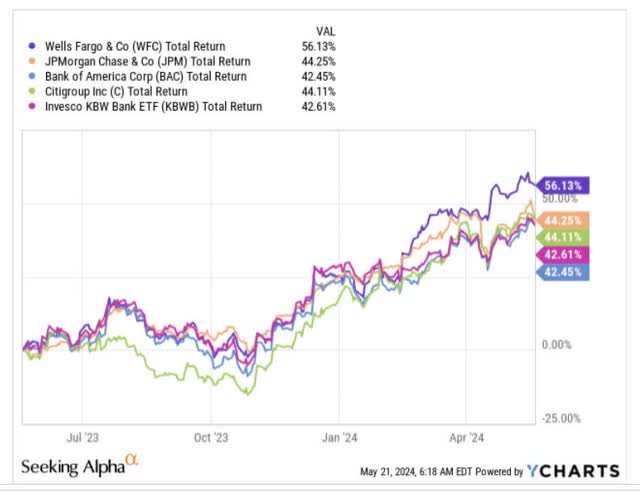
- Wells Fargo stock has outperformed its peers and a diversified portfolio of banking stocks, generating returns of over 56% in the past year.
- Non-interest income growth is expected to be resilient (currently growing at a run rate of 17%) while headcount and branch adjustments could reflect well on the cost base.
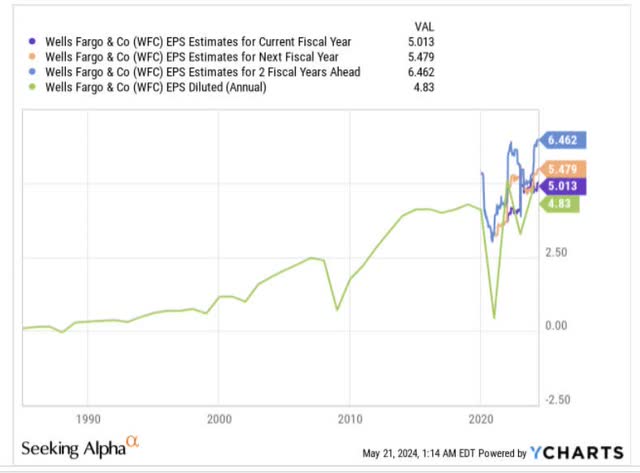
- WFC may get an opportunity to expand its asset base from FY25, and going by sell-side estimates, the expectation is for higher earnings growth over each of the next 3 years.
- WFC’s valuations look pricey, its yield looks unappealing, and the risk-reward on the charts does not look too favorable.
Sundry Photography
Solid Alpha, Despite NII Weakness
Over the past year, the stock of Wells Fargo (NYSE:WFC), the third-largest bank in the US by market cap, has done exceedingly well for its stakeholders by generating returns of over 56%, and outperforming not just its largest peers but also a diversified portfolio of 25 other banking stocks.
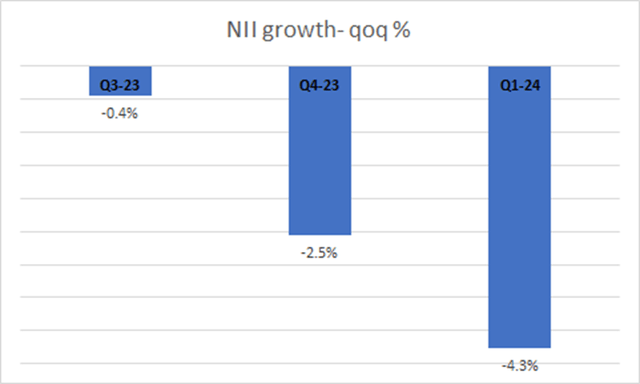
WFC’s outperformance is interesting to note, given that we haven’t been in the most conducive environment for NII (Net interest income) progression, a metric that is used to gauge the business conditions of traditional banks. For context, WFC’s NII peaked in Q4-22 at $13.4bn but has since witnessed sequential declines over the last 5 quarters, with the pace of declines worsening over the last three quarters. Even on a YoY basis, NII is currently contracting at a pace of 8%, with management pointing to a similar pace for the full year (7-9% decline for FY24).
A lot of this weakness stems from higher funding costs, and WFC’s customers migrating to higher-yielding deposit products; for instance, non-interest-bearing deposits which accounted for 35% of the total deposit mix at the end of Q4-22, currently stand at only 26%. Meanwhile, note that average deposit costs were up a whopping 174bps in Q1, as opposed to just a 69bps uplift on the average loan yields.
In the current high-rate environment, you’re also not going to see a lot of appetite for loan growth, with WFC’s loans sliding both sequentially (-1%) and annually in Q1 (-2%). As of Q1, WFC’s loan growth was trending below management’s expectations, but they think this could pick up in H2, with NII declines troughing by Q4. However, note that WFC was basing this scenario on the expectations of three rate cuts by the Fed in FY24, but by the looks of it, we are more likely to see only two rate cuts this year aggregating to 50bps.
Whilst NII progress has been a challenge for WFC, the market is likely taking heart from the resilience of its non-interest income component, which has been growing at a sturdy pace of 17% annually for the past two quarters. Avenues such as wealth management fees, trading etc. are getting an uplift with the strength of the markets. Management implied that in Q2 it is likely to be even stronger, given that it will be linked to market valuations as of April 1st. Note that relative to some of its peers, WFC’s thrust in the areas of trading and investment banking is not too huge, but given the low base of this business, the prospects of growing it at elevated rates is quite high. WFC’s trading fees were up by 8% in Q1, despite not being in the business of offering financing for these trades, unlike its peers.
Anticipation Over The Lifting Of The Asset Cap
All this could change for the better if WFC’s 6-year asset cap of sub $2 trillion in assets gets lifted. Although the market is still searching for definitive clarity from the Fed, the expectation is that we could see some clarity from Q1-25, once the Presidential elections are wrapped up.
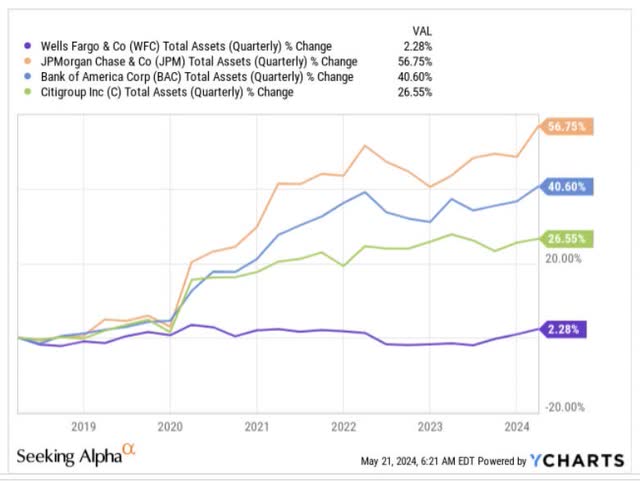
If WFC gets a reprieve, think about the potential earnings expansion we could see in the years ahead as WFC deploys a growing chunk of assets in some of the more lucrative fields of investment banking and trading, where it has yet to build ample cloud. As captured in the image below, its biggest peers (JPMorgan (JPM), Bank of America (BAC), and Citigroup (C)) have grown their asset base by 26%-57% during the time when WFC has had to remain flat, in account of the asset cap.
This pent-up gunpowder is probably one of the reasons why the market continues to bid up the WFC stock even though the broader environment is not too supportive for banking plays.
Meanwhile, the bank also continues to get more efficient with its cost base, as headcount and branch count are down by 9% and 4% respectively and the staffing adjustments will continue through the year, putting the Opex component in a healthy position by the end of the year,
Note that as things stand, WFC’s ROTCE (Return on Tangible Common Equity) stands at 12.2%, but the long-term goal is to get this to levels of 15%, and that certainly doesn’t look too unrealistic when one considers the degree of earnings growth that the sell-side is budgeting for WFC over the next three years. To expand on this note that one is likely to get expanding earnings growth over each of the next three years from 4% in FY24, to 9.3% in FY25, to 18% in FY26!
Risks – Why WFC Does Not Make A Great Buy Now
Pricey Valuations
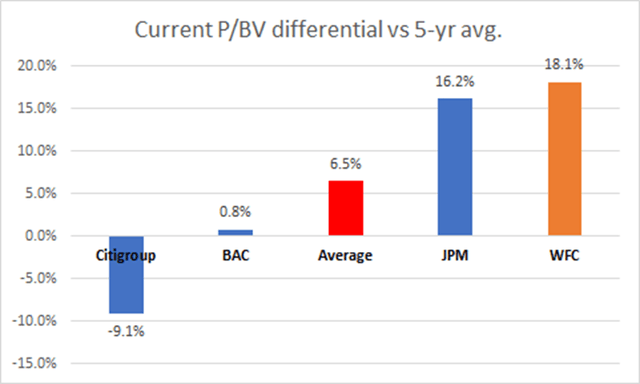
Despite the potential for some favorable prospects for WFC, investors may want to note that WFC’s current valuation, relative to its historical average, is already quite pronounced. To elaborate on this, note that WFC is currently priced at 1.31x price to book value, an 18% premium over its rolling 5-year average of 1.11x. In contrast, its three largest banking peers are currently trading at a price to book value premium of 6.5% (on average) with Citigroup, Inc. (C) even trading at a 9% discount.
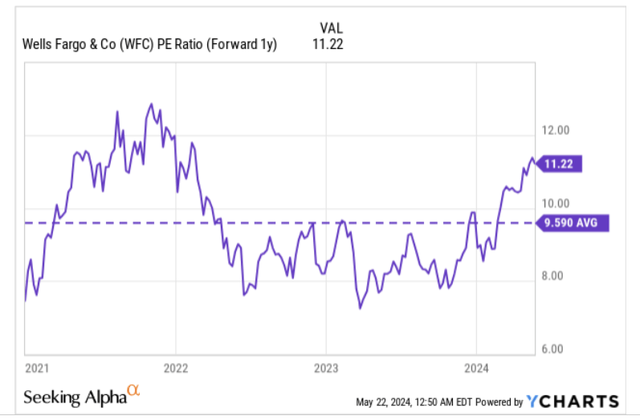
Besides, even on the forward P/E front, valuations are hardly comforting relative to the stock’s own history, with it trading at 11.22x, a 17% premium over its 5-year average.
Unappealing Yield
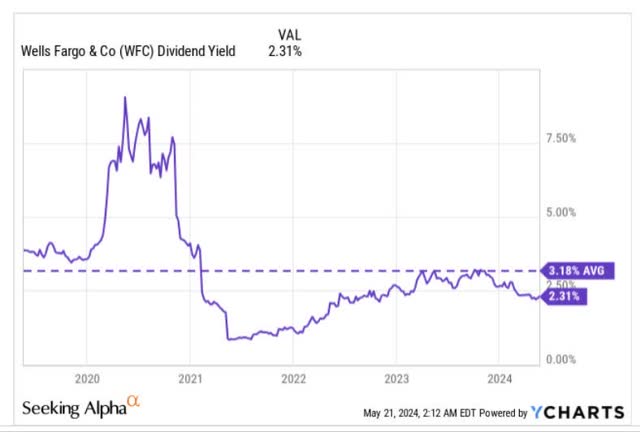
The WFC stock is also a popular pick with dividend investors, but getting in at the current yield wouldn’t be too lucrative, considering how much this stock has typically yielded over the past 5 years. As things stand, WFC’s yield is rather unappealing at only 2.31%, almost 90bps lower than its 5-year average. Based on the quantum of dividend hikes seen over the past couple of years, we could see a $0.05 hike yet again, taking the quarterly dividend to $0.4, but even at those prospective levels, the yield would come across as sub-par at the CMP at just 2.61%.
Risk – Reward On The Charts Does Not Look Great
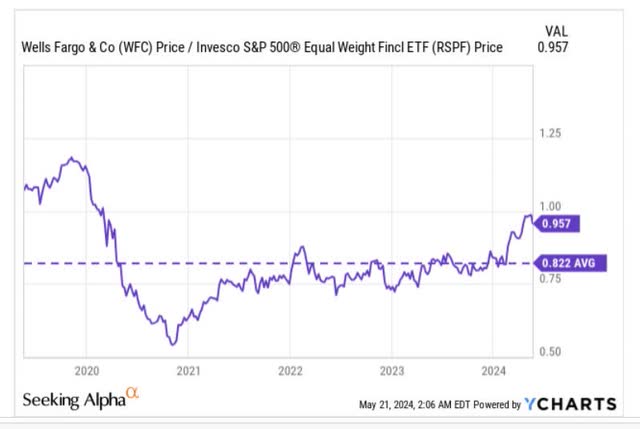
We also feel that rotational specialists who are on the lookout for beaten down opportunities among the financial stocks that comprise the S&P500 are unlikely to take a fancy to WFC at this juncture. The chart above highlights how WFC’s relative strength ratio versus an equally weighted portfolio of financial large-caps has more than mean-reverted and is currently trading at a 17% premium over the long-term average.
Then, based on where the WFC stock per se is currently perched on its long-term monthly chart, it’s difficult to drum up too much of ardor for a long position at this stage.
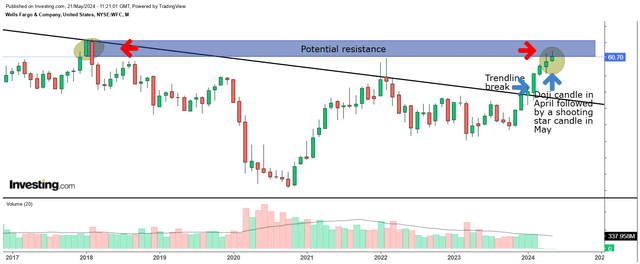
Note that the stock last peaked at the $66 levels, back in Jan/Feb 2018, when the Federal Reserve’s asset cap took effect. Since then, the stock has largely been trending lower, with a clear downward sloping trend line capping its efforts to trend higher. However, earlier in Feb this year, we finally saw some traction with the stock breaking past its trend line, and that technical event, no doubt emboldened more momentum chasing bulls to get on board.
The WFC stock has largely enjoyed a good run for a while now, but some caution may be advised given the nature of the last two monthly candles with strong upper wicks. Essentially in April, we saw a doji shaped candle, pointing to fatigue and indecision among market participants, and this looks set to be followed by a shooting star candle in May, which generally appears after an uptrend and points to a reversal. (unless there’s a drastic reversal of sentiment in the remaining 8 trading sessions of this month).
Meanwhile, also do consider that the stock is now hardly a breath away from hitting its old 2018 resistance of $66. We recognize that WFC’s CET-1 levels of 11.2%, and currently 230bps above the regulatory minimum, allowing them plenty of elbow room to push the pedal with buybacks, but given where the share price is based currently, we feel buyback support could slow at these levels. Also consider that even though management intends to spend more on buybacks this year, than they did last year ($11.8bn), we’ve already seen 50% of last year’s sum being deployed in Q1 alone, and we would expect the quarterly run rate to slow down.
All in all, we believe WFC is a HOLD at current levels.
Analyst’s Disclosure: I/we have no stock, option or similar derivative position in any of the companies mentioned, and no plans to initiate any such positions within the next 72 hours. I wrote this article myself, and it expresses my own opinions. I am not receiving compensation for it (other than from Seeking Alpha). I have no business relationship with any company whose stock is mentioned in this article.
Seeking Alpha’s Disclosure: Past performance is no guarantee of future results. No recommendation or advice is being given as to whether any investment is suitable for a particular investor. Any views or opinions expressed above may not reflect those of Seeking Alpha as a whole. Seeking Alpha is not a licensed securities dealer, broker or US investment adviser or investment bank. Our analysts are third party authors that include both professional investors and individual investors who may not be licensed or certified by any institute or regulatory body.

