Summary:
- I reaffirm my “strong buy” for Micron Technology, updating the fair stock price to $171.45 and projecting $275.07 by 2029, indicating 17.8% annual returns.
- Micron plans a $150 billion investment in manufacturing and R&D over the next decade, including building four new fabs with $20 billion in federal subsidies.
- Micron is third in the DRAM and NAND markets, trailing behind Samsung and SK Hynix. The company focuses on cost-efficiency to stay competitive.
- The DRAM and NAND markets are projected to grow annually by 2.98% and 6.39%, respectively, expanding Micron’s addressable market from $175.2 billion to $298.93 billion by 2030.
- Potential for increased HBM sales and tax credits could raise the fair price to $191.12 and 2029 projection to $312.53. Risks include business volatility and increased CapEx to meet objectives.
Sundry Photography
Thesis
In my previous article about Micron Technology, Inc. (NASDAQ:MU) I rated the stock as a “strong buy” after arriving at an estimated present fair price per share of $151.72 which was 37.4% higher than the stock price at that time of $110.40. I also calculated which could be the potential stock price for the year 2029, and the result was $199.64, which implies 13.5% annual returns, which is over the market’s historic 10.50% annual returns.
Micron reported Q3 2024 earnings on June 26. For the quarter, Micron reported an EP of $0.62 (which beat estimates by 16.98%) and revenues of $6.81B (which beat estimates by 0.02%). Nevertheless, the stock fell 6.5% as its FQ4 2024 outlook came out in line with the consensus.
After re-evaluating Micron in this article, and adding my HBM revenue estimates and the revenue that Micron could receive from the two factories that should be finished by 2029, I arrived at a fair stock price estimate of $171.45 and a future stock price estimate for 2029 of $275.07.
However, if I increase the revenue of HBM to $3B in 2025, and I add the tax credits that Micron should receive from the Federal Government, that fair price estimate increases to $191.12, and the future stock price to $312.53.
For these reasons, I reiterate my “strong-buy” rating on Micron.
Overview
Growth Plan
Micron says that memory is crucial for everything and is required to grow the data economy. Micron’s catalyst is high-bandwidth memory, which is necessary to build AI-capable data centers.
It’s already widely known that the memory market operates like a commodity because there is no big differentiation among the leading companies, usually, the one that registers the most sales is the one that offers the lowest price. For that reason, Micron plans to invest in its manufacturing process, to become more efficient and keep up with price reductions. Over the next decade, Micron is planning to invest around $150B in manufacturing, and R&D.
Furthermore, Micron currently operates 6 fabs (four of them are 100% Micron property, and 2 of them are leased) but is planning on building 4 new fabs, and the US Federal Government is supposedly going to subsidize around $20B from which $3B will be obtained under the condition that construction starts by the end of 2026. The first two fabs should be ready by 2028 and 2029 respectively. Meanwhile, the last two will be ready by 2035-2041.
How Does Micron Compare Against Competitors?
Micron’s operations are divided into DRAM and NAND. The DRAM market is dominated by three players: Samsung Electronics Co., Ltd. (OTCPK:SSNLF), which holds 38.9% of the market, then it’s SK Hynix with 24.3%. Micron is in third place with a market share of 22.8%.
The same situation happens in the NAND market, where the Partnership Western Digital Corporation (WDC)/Kioxia controls 36.7% of the market (WDC controls 15.2%, and Kioxia 21.5%). In second place it’s Samsung which controls 31.4% of the market, and in this place, it’s Micron with a market share of 10.3%. Significantly less than the other three companies.
Industry Outlook
The DRAM market was valued at $99.89B in 2023, and it’s expected to reach a size of $126.23B in 2031, which translates into an annual growth rate of 2.98%.
Meanwhile, the NAND market was valued at $75.83B in 2023, and it’s expected to reach $177B by 2030. This showcases a CAGR of 6.39% throughout 2024-2030.
So, having these figures, we can imply that currently Micron’s addressable market stands at $175.2B and this number will increase to $298.93B by 2030. This is an annual TAM growth rate of 10.08%, which is very decent.
Valuation
I will value Micron through a DCF model. The first step is calculating the WACC with the already-known formula. The result was 12.43%.
D&A and CapEx will be calculated with a margin tied to revenue, which came out at 35.66% and 24.50% respectively.
Micron plans to spend $48B on the new fabs, Abstracting the expected $20B in subsidies, this leaves us with a total of $28B for the four factories, which means that each factory will cost around $7B.
However, only two of them will be ready before 2029 (which is the last year of this projection) which means that Micron is going to spend $14B in these fabs for 2024-2029. Then that divided by 6 (the amount of years in the projection) yields a result of $2.33B per year for the expenses of building these 2 factories in 2024-2029. As you will see in the DCF model, the used CapEx sufficiently covers these expenses and leaves room for more. If Micron ends up using less CapEx, then free cash flow will increase and ultimately, the valuation.
| TABLE OF ASSUMPTIONS | |
| (Current data) | |
| Assumptions Part 1 | |
| Equity Market Price | 151,167.52 |
| Debt Value | 14,315.00 |
| Cost of Debt | 3.88% |
| Tax Rate | 1.37% |
| 10y Treasury | 4.240% |
| Beta | 1.44 |
| Market Return | 10.50% |
| Cost of Equity | 13.25% |
| Assumptions Part 2 | |
| CapEx | 5,235.00 |
| Capex Margin | 24.50% |
| Net Income | -2,203.00 |
| Interest | 555.00 |
| Tax | -672.00 |
| D&A | 7,621.00 |
| Ebitda | 5,301.00 |
| D&A Margin | 35.66% |
| Revenue | 21,371.0 |
| R&D Expense Margin | 15.18% |
Starting with revenue, I did a table where you will be able to see the behavior of Micron’s revenue when affected by changes in global semiconductor shipments.
In the table below you will observe that on average, a contraction in semiconductor shipments and Micron’s revenue comes every 3 quarters, and only last for one quarter.2022-2023 was an exception because demand for PCs, Tablets, and other electronics (particularly crypto mining rigs) caused widespread price increases on various PC components (as storage devices). Then when storage device manufacturers hiked up production, the pandemic quarantine was lifted, and central banks started to hike interest rates, demand for consumer electronics cooled, and this caused inventories to become full and therefore, forced manufacturers to liquidate at an inferior price.
Then, you will observe that the average quarterly growth in global semiconductor shipments has been 5.50% and the average decrease has been 5.43%. During these periods of growth, Micron grew 5.90% more than the market, but during periods of falling demand, revenue contracted 21.82% more than the market (which is one of the reasons why Micron’s stock price changed so violently in the past).
Author’s Calculations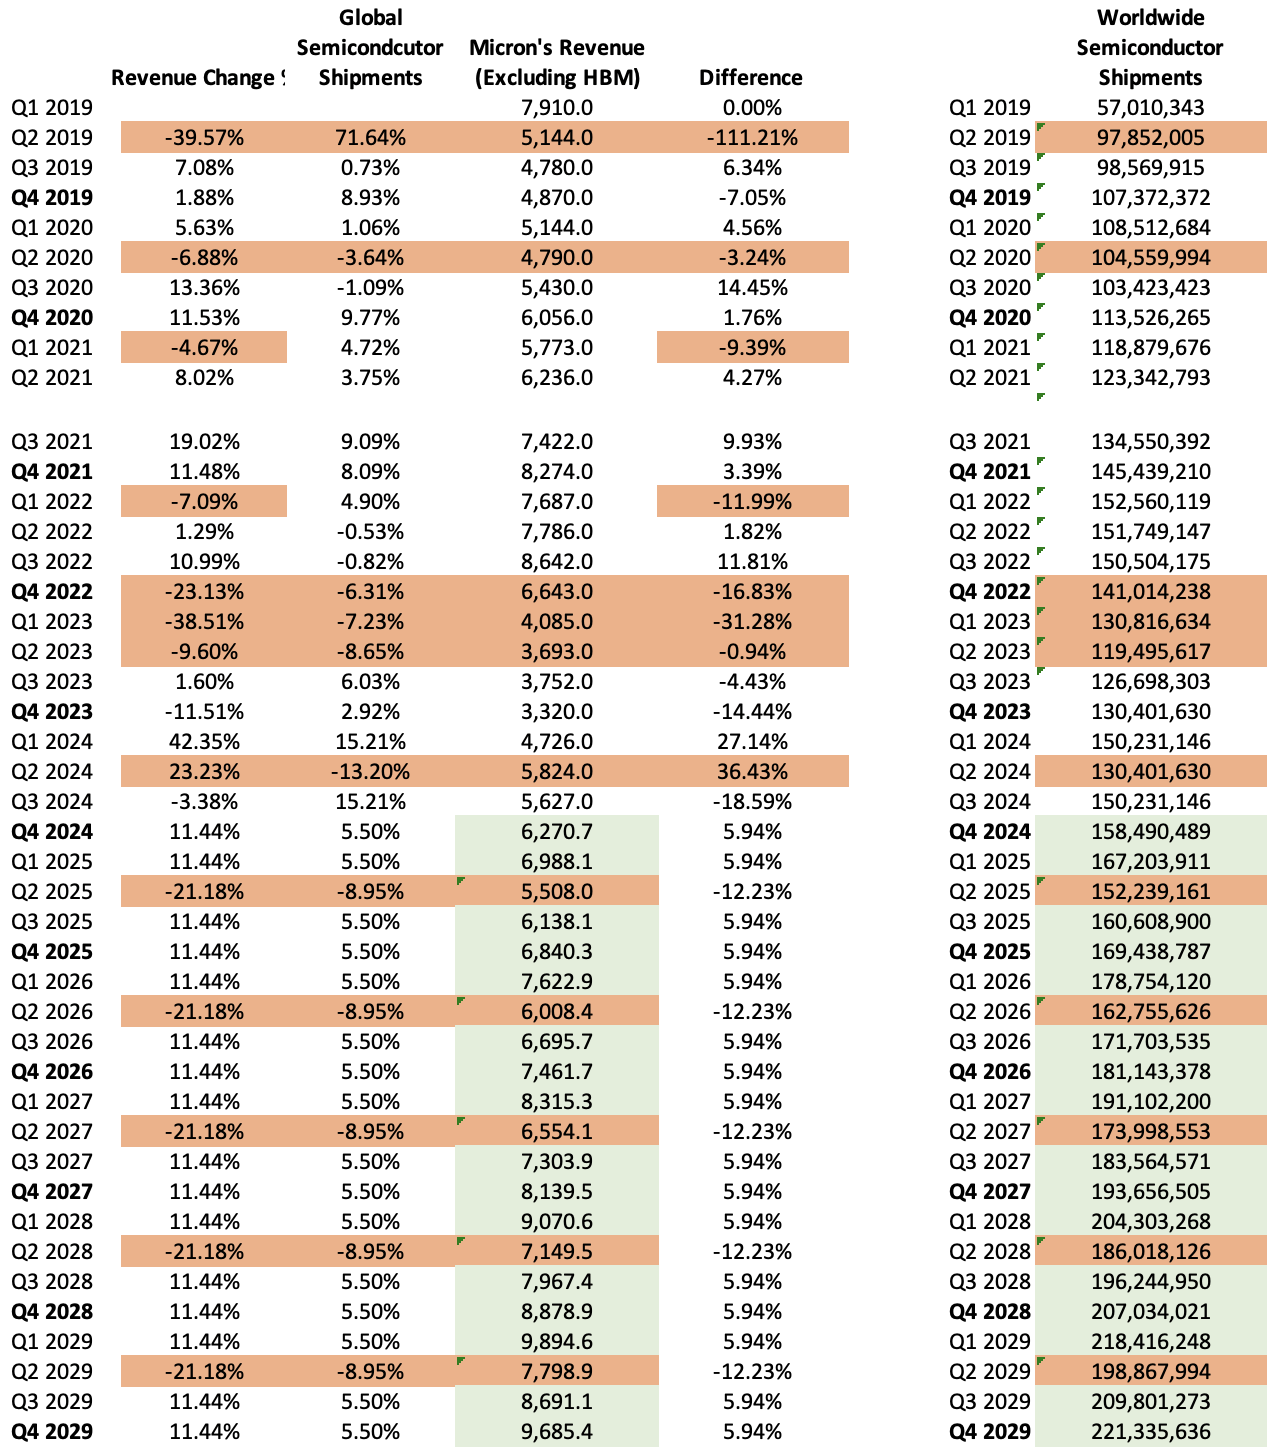
It’s not known which will be the capacity of the 4 new factories that Micron is planning on building, however, revenue per factory currently sits at $3.56B (calculated by dividing current TTM revenue of $21.37B by the 6 factories currently in operation). So, since the first two factories will be finished in 2028 and 2029 respectively, in those two years I will add the whole $3.56B revenue per factory.
Then, I will take out the $700M in HBM sales that is estimated to have been generated during 2023 so I can calculate it apart. The growth rate I will assume for HBM is 50% from 2024-2027, which is in line with what UBS expects for AI infrastructure. After that, I will cut that rate in half to 25% for 2028-2029.
| HBM Memory | |
| 2023 | 700.0 |
| 2024 | 1,050.0 |
| 2025 | 1,575.0 |
| 2026 | 2,362.5 |
| 2027 | 3,543.8 |
| 2028 | 4,429.7 |
| 2029 | 5,537.1 |
| Growth Rate % | 50.00% |
Now, to calculate net income, I made a table with all the variables that influence it. The first of those variables is gross margin. This metric has been on average, oscillating around the 31.60% mark. However, taking out 2024 and 2023, the average rises to 38.37%. This is the gross margin I will employ throughout the projection, except for 2024, for which I will assume a gross margin of 26%, which is slightly double the current gross margin of 11.42%. As you can see in the table below, this movement is possible since Micron achieved it when it exited from its negative 9.11% gross margin this year.
| Gross Profit | Revenue | Gross Profit % | |
| 2014 | 5,437.0 | 16,358.0 | 33.24% |
| 2015 | 5,215.0 | 16,192.0 | 32.21% |
| 2016 | 2,505.0 | 12,399.0 | 20.20% |
| 2017 | 8,436.0 | 20,322.0 | 41.51% |
| 2018 | 17,891.0 | 30,391.0 | 58.87% |
| 2019 | 10,702.0 | 23,406.0 | 45.72% |
| 2020 | 6,552.0 | 21,435.0 | 30.57% |
| 2021 | 10,472.0 | 27,705.0 | 37.80% |
| 2022 | 13,898.0 | 30,758.0 | 45.18% |
| 2023 | -1,416.0 | 15,540.0 | -9.11% |
| 2024 | 2,441.0 | 21,371.0 | 11.42% |
Then it’s selling & general administrative expenses, which when divided by the total amount of full-time employees yields a result of $20K. Then, I will assume that Micron will hire 1K new employees per year as of 2020-2023.
Meanwhile, R&D expenses will be calculated with a margin tied to revenue of 15.18% because if done with gross profit (as I normally do), the result would not make sense.
On the other hand, I will assume that total debt will grow by 31.7% annually, and marketable securities will decrease by 1.4% annually, as in 2021-2024TM.
Then, I found that when interest rates were low (2019) Micron received a 25.53% return on its marketable securities and paid a 2.19% interest on its debt load, and currently (a period of high interest rates) Micron has paid a 3.88% interest on debt, but has received a 67.77% return on its marketable securities. With this information, what I will do is that I will use the low interest rates data for 2025-2026, and 2028-2029, as I will assume that for the rest of 2024, interest rates will remain high (maybe lower than when the year started, but still high), and for 2027, the FED will need to increase interest rates again. You can see the full explanation in the valuation section of my article on JPMorgan Chase & Co. (JPM).
The final step for the net income calculation process is income tax expenses, which I will fix at the average tax rate in 2018-2024TM of 1.37%. If it seems too low, well, let’s keep in mind that Micron has never paid over 10% in taxes for that period, and with the new $13B tax credit package the Federal government has prepared for Micron, that trend seems to extend for the foreseeable future.
| Micron’s Tax Rate | |
| 2018 | 1.17% |
| 2019 | 9.89% |
| 2020 | 9.44% |
| 2021 | 6.30% |
| 2022 | 9.27% |
| 2023 | -3.13% |
| 2024 TTM | -23.37% |
| Avg: | 1.37% |
Author’s Calculations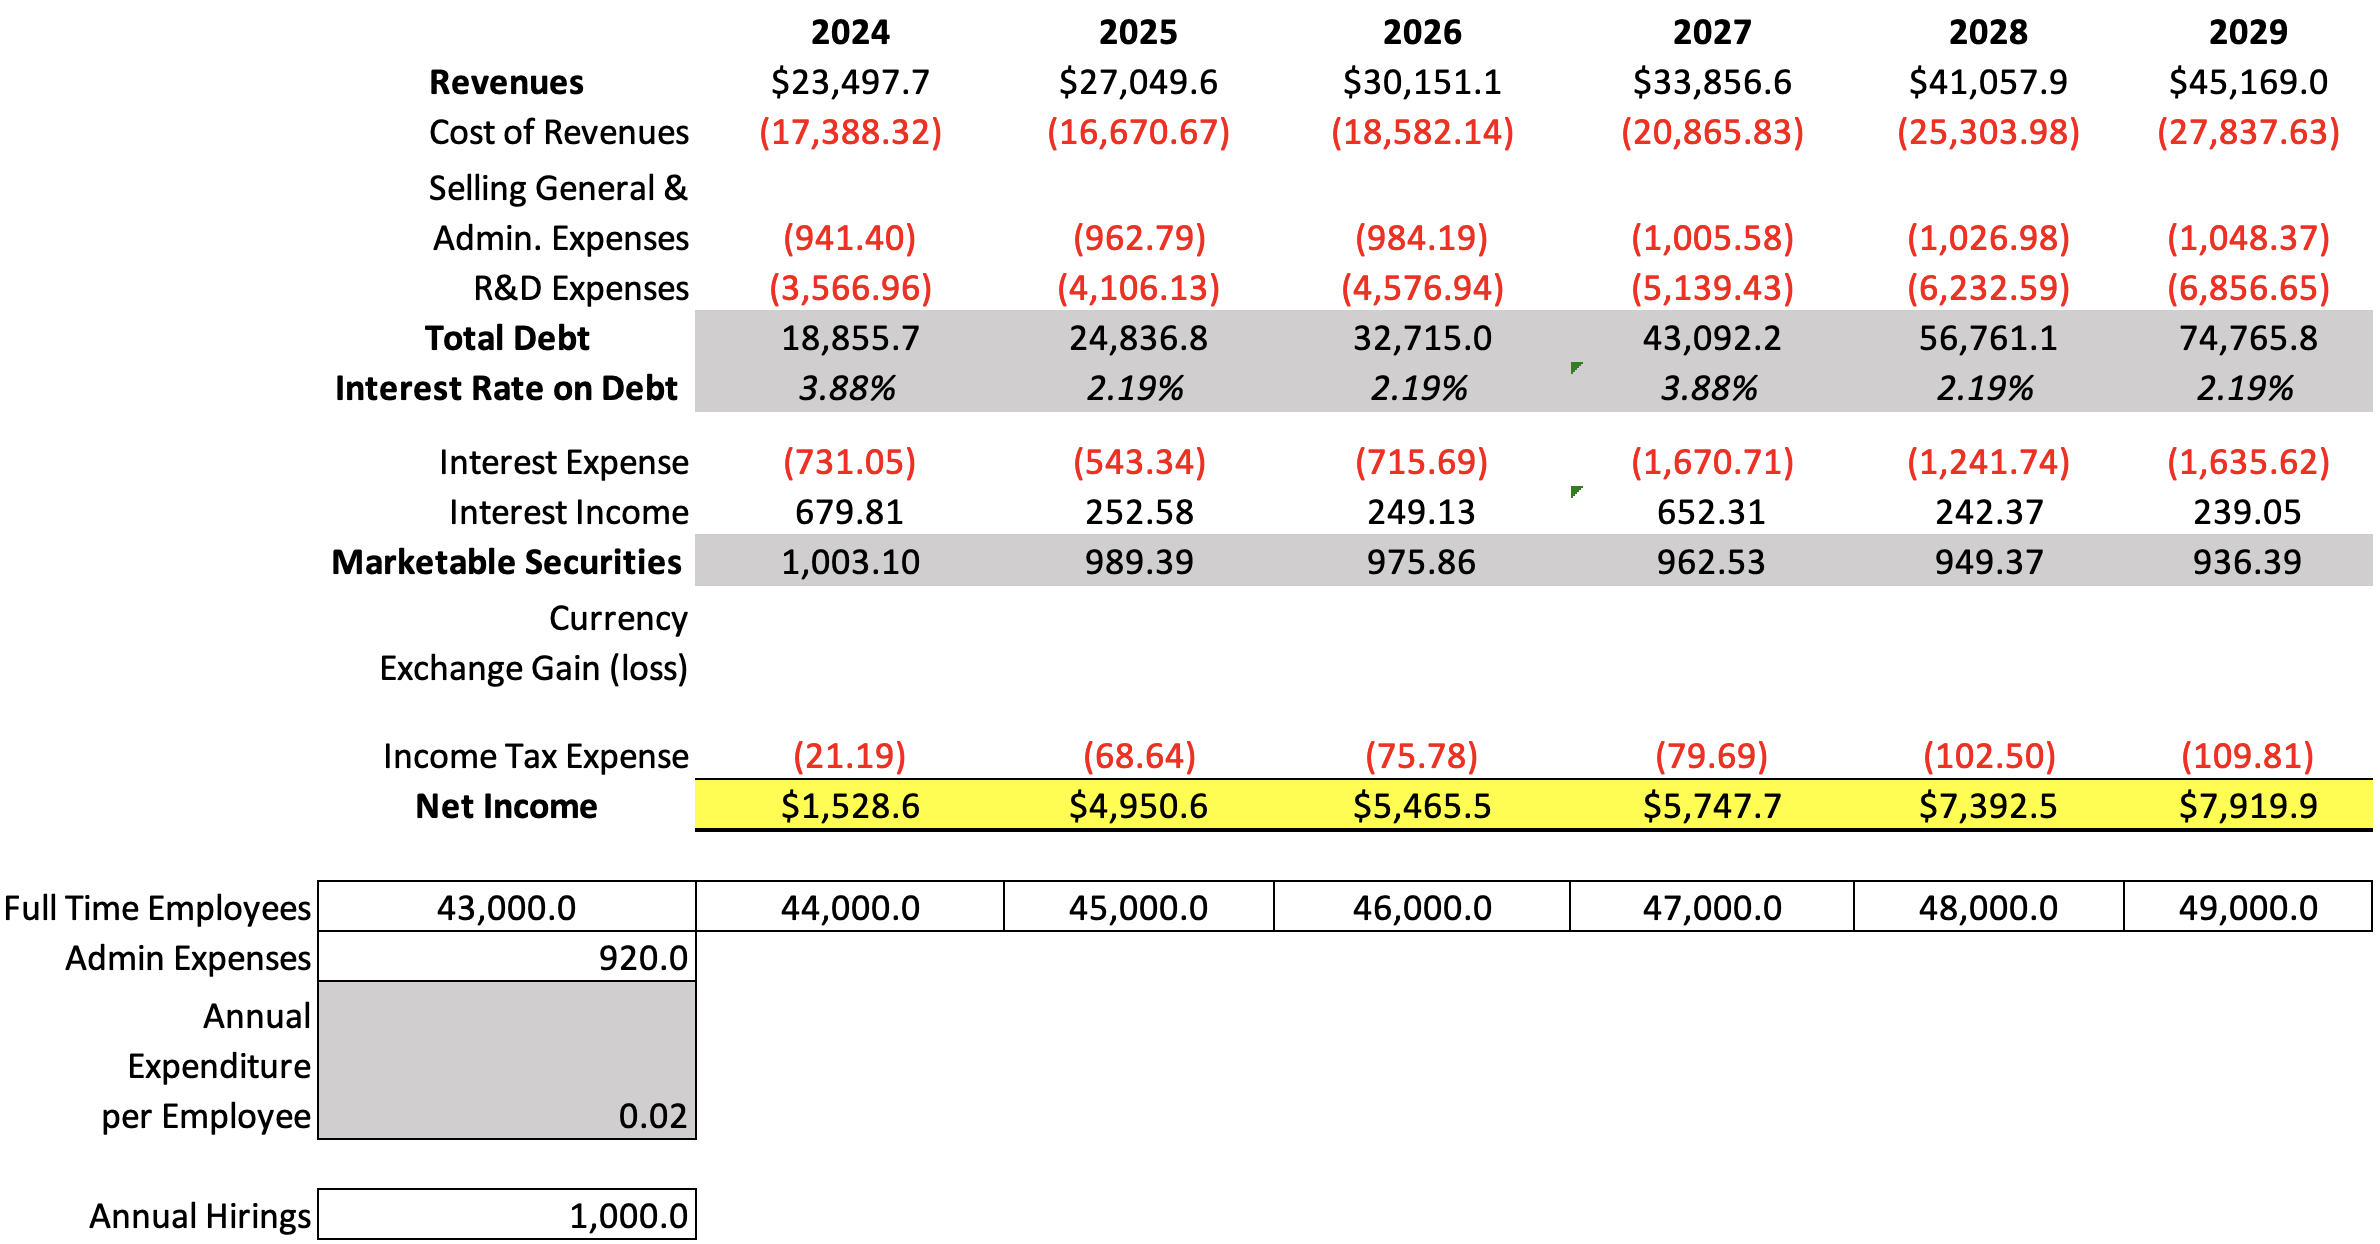
The complete revenue, net income, interest, taxes & D&A projection would look like this:
| Revenue | Net Income | Plus Taxes | Plus D&A | Plus Interest | |
| 2024 | $23,497.7 | 1,528.62 | 1,549.82 | 9,929.22 | 10,660.27 |
| 2025 | $27,049.6 | 4,950.61 | 5,019.25 | 13,398.65 | 13,942.00 |
| 2026 | $30,151.1 | 5,465.52 | 5,541.30 | 16,293.33 | 17,009.03 |
| 2027 | $33,856.6 | 5,747.67 | 5,827.37 | 17,900.79 | 19,571.50 |
| 2028 | $41,057.9 | 7,392.48 | 7,494.98 | 22,136.42 | 23,378.16 |
| 2029 | $45,169.0 | 7,919.93 | 8,029.74 | 24,137.21 | 25,772.83 |
| ^Final EBITA^ |
Finally, I will calculate the potential price at which Micron’s stock could be trading by 2029 by using the undiscounted cash flows highlighted in green in the DCF model and adding the potential future values of each of the other elements that conform to equity (current assets, marketable securities, and debt).
Current assets will grow at a 5.21% rate, thus mirroring their performance during 2021-2024TTM. Then for short-term debt and long-term debt, you can observe that currently, short-term debt represents 11.8% of the total debt load, meanwhile long-term debt represents 88.15%. So to calculate their future values I will just take out those proportions from the future total debt value I am expecting for 2029 (which was calculated in the net income phase) of $74.76B. Then, what remains is marketable securities, which were already calculated in the net income calculation process. For 2029, I expect them to be at $936.39M.
Finally, the perpetuity growth rate of 1.75% used in the model was calculated by dividing the resulting FCF growth rate of 28.80%, by the difference between it and the WACC: 28.80%/(28.80%-12.43%)=1.75%.
Author’s Calculations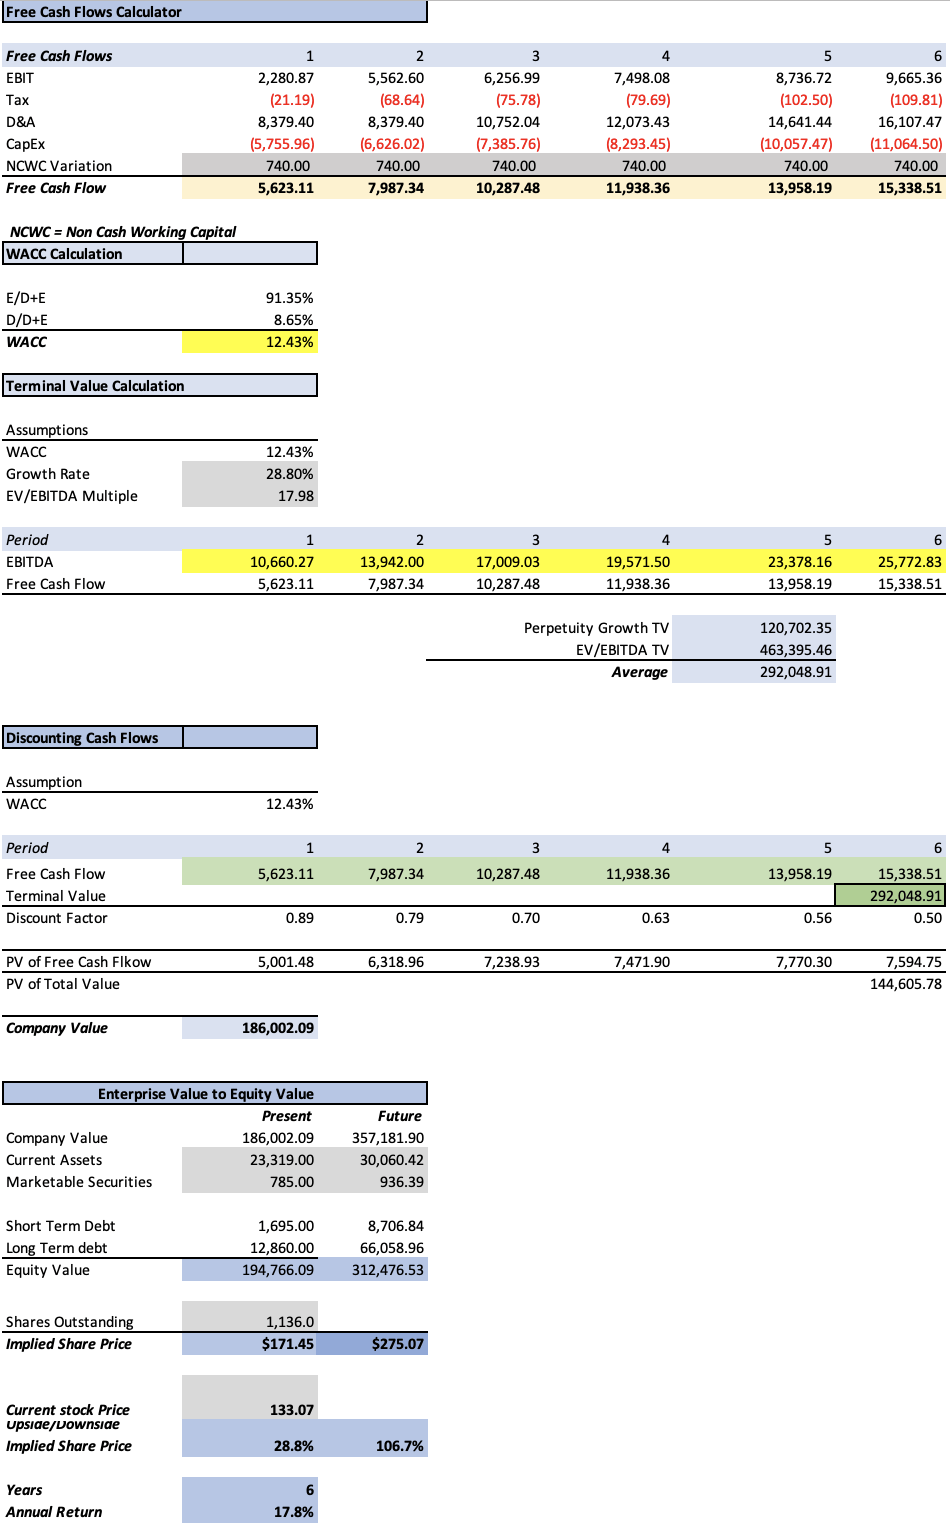
As you can see, my model suggests that Micron’s stock should be trading at $171.45 per share (which is 28.8% above the current stock price of $133.07) and that for 2029, the stock should be trading at $275.07 (which implies 17.8% annual returns throughout 2024-2029).
Alternative Scenarios
According to Citi, Micron could register $3B in HBM sales for 2025, and aside from that, I didn’t include the potential tax credits that Micron could receive from that $13B tax credit package that was prepared by the Federal government under the CHIPS Act.
The way I will include the tax credit is by dividing that $ 13 B by 17 years, which is the time frame that Micron expects they need to build the 4 factories they have planned. This gives an annual tax credit of $764.70M.
Then, for the $3B HBM revenue, I will just increase my 2025 estimate of $1.57B to $3B, and maintain the growth rates I employed.
| Revenue | Net Income | Plus Taxes | Plus D&A | Plus Interest | |
| 2024 | $23,497.7 | 2,314.52 | 1,549.82 | 9,929.22 | 10,660.27 |
| 2025 | $28,474.6 | 6,114.41 | 5,349.71 | 13,729.11 | 14,272.45 |
| 2026 | $32,288.6 | 6,801.68 | 6,036.98 | 17,551.26 | 18,266.96 |
| 2027 | $37,062.9 | 7,335.60 | 6,570.90 | 19,787.69 | 21,458.40 |
| 2028 | $45,065.7 | 9,189.09 | 8,424.39 | 24,495.03 | 25,736.77 |
| 2029 | $50,178.7 | 9,956.21 | 9,191.51 | 27,085.48 | 28,721.10 |
| ^Final EBITA^ |
After adding those two factors to the valuation, Micron’s fair price per share increased to $191.12 (which is 43.6% above the current stock price of $133.07), and the future price to $312.53 (which suggests 22.5% annual returns throughout 2029).
The perpetuity growth rate in this hypothetical model is 1.71% after diving the resulting FCF growth rate of 29.97% by the difference between it and the WACC (which is 12.43%): 29.97%/(29.97%-12.43%)=1.71%.
Author’s Calculations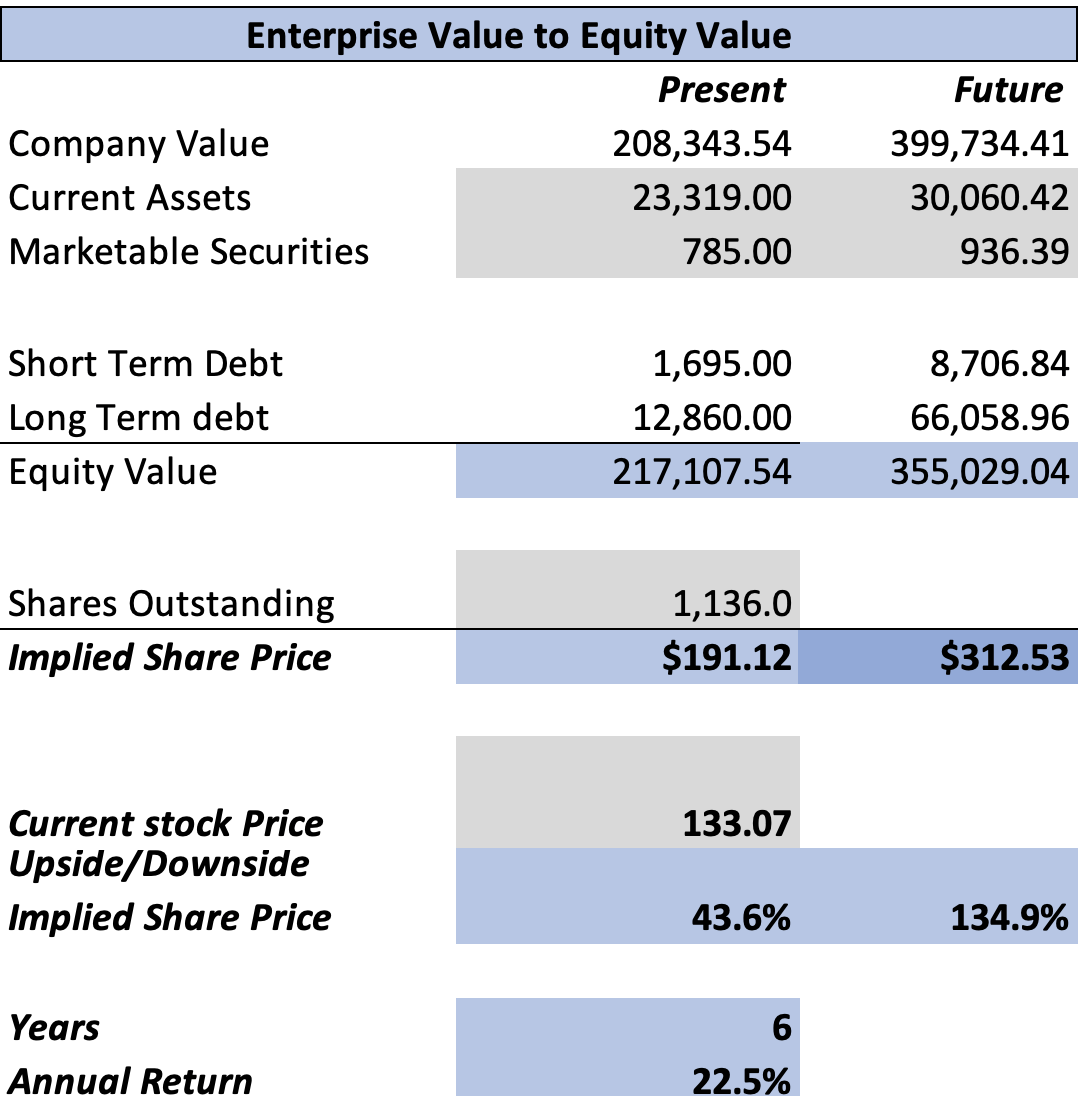
Risks to Thesis
The main risk to this thesis is the nature of Micron’s business, which is, as previously said, like a commodity. The only way Micron can stay ahead of the competition is by having the most aggressive cost-cutting strategies since the only way Micron can sell its device is if they have the best quality-price ratio.
The second risk is the violent swing in Micron’s stock. This presents both an opportunity and a risk. However, since Micron is at all-time highs, the stock is more on the risk side. If a recession does happen in 2025, and semiconductor shipments are interrupted, then the stock could violently sink.
Seeking Alpha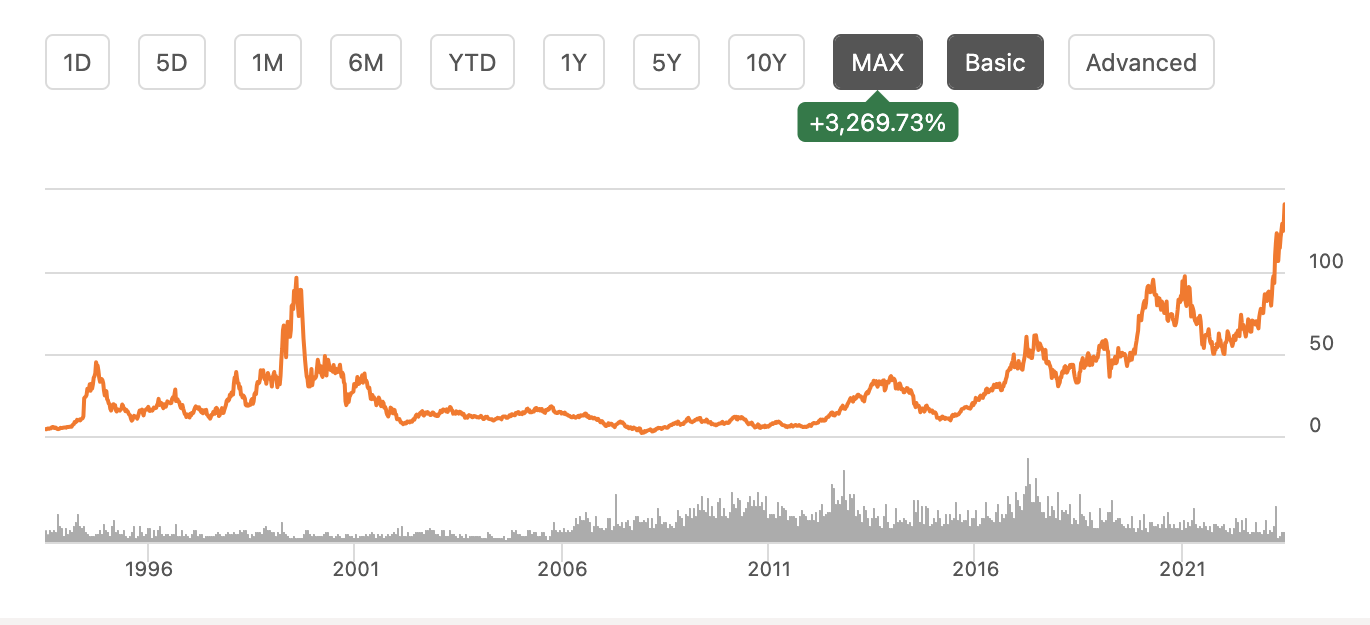
Lastly, there is the risk that Micron’s CapEx increases so much that it reduces free cash flow considerably, if this happens then the fair price per share would decrease. This can happen because of increasing costs, or if they aggressively try to stay ahead of the competition.
The Evolution of My Fair Price Estimates
My first fair price target was $122.10, which means that my current fair price estimate of $171.45 is 40.41% above that first estimate. On average I have increased my fair price estimates by 13.47% per coverage.
Author’s Calculations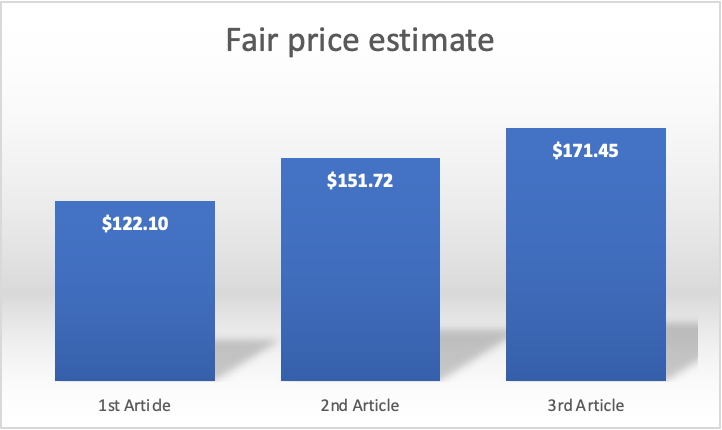
Concerning the 13.04% fair price increase from my 2nd to my 3rd article, the reason I separated the HBM memory revenue to examine it apart, aside from that, I added the potential revenue that Micron could generate with the two new factories they are planning on opening by 2029.
My EPS & revenue Estimates compared to the Average Consensus
Finally, I know that there will be doubters saying that my estimates are too far off. Well, my EPS estimates are overall 51.05% lower than those of the average consensus.
Author’s Calculations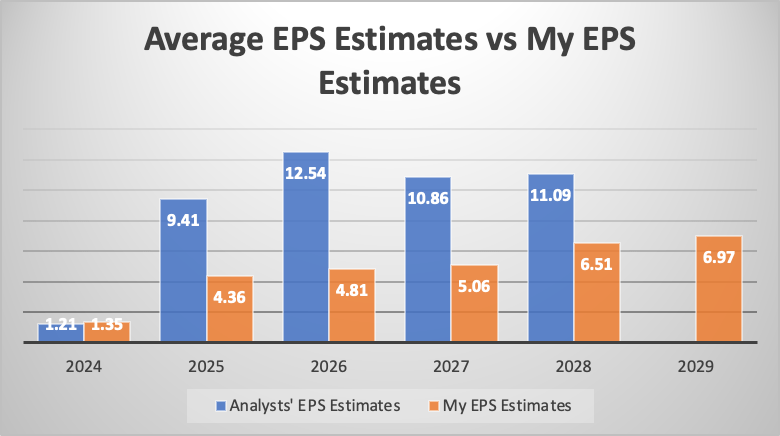
Regarding Revenue, my estimates are overall 19.94% lower than the average estimates.
Author’s Calculations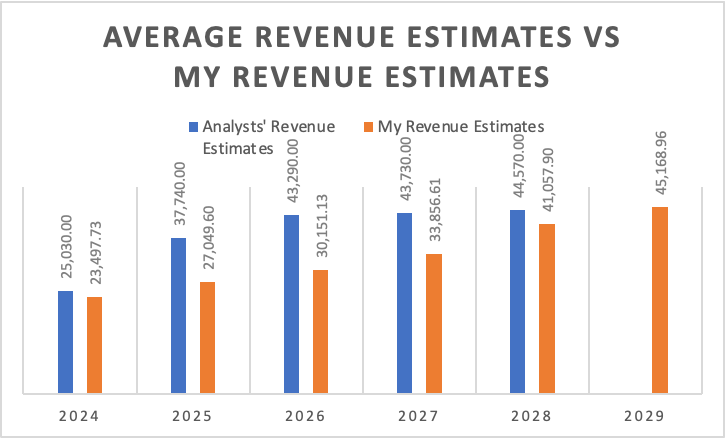
Lastly, not even my net income margins could be considered “too high”, since they are also lower than the average consensus, and by a margin of up to 10%.
Author’s Calculations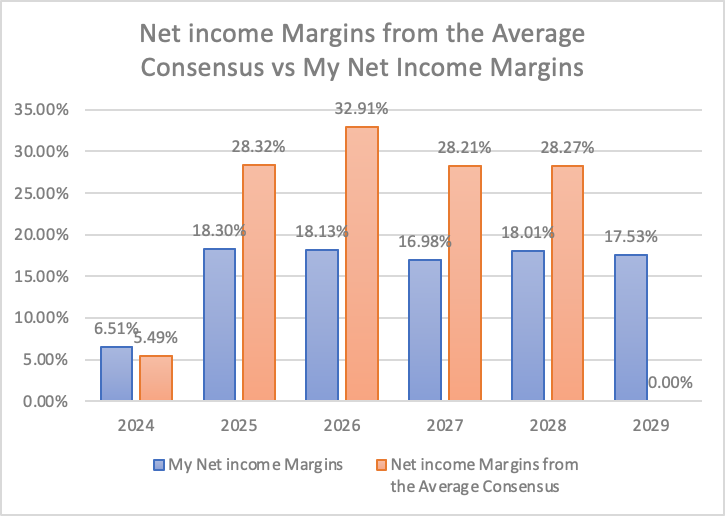
With this in mind, you can already deduct that Micron’s potential stock price target could be significantly higher than the ones I assigned.
Yes, I know that if we multiply the estimated EPS for 2024 of 1.21 by the expected forward P/E ratio of 108.74, we get a stock price of 131.57, and if we do the same calculation for 2028, the future stock price would be 131.52. This in theory could suggest that Micron’s stock price will be flat.
However, forward P/Es are set arbitrarily, which means that Micron for 2028 could attain the median P/E ratio of the sector, which is currently 23.97, instead of the estimated 11.86. This would mean that for 2028, with the same estimated EPS for that year of 11.09, the stock price could also be $265.82.
I acknowledge that over the long term, P/E ratios tend to decrease, but it’s hard to predict at what pace they will decrease. For example, the 5Y average P/E ratio of Micron is 80.25, which means that Micron’s P/E ratio has increased rather than decreased in the span of 5 years.
Seeking Alpha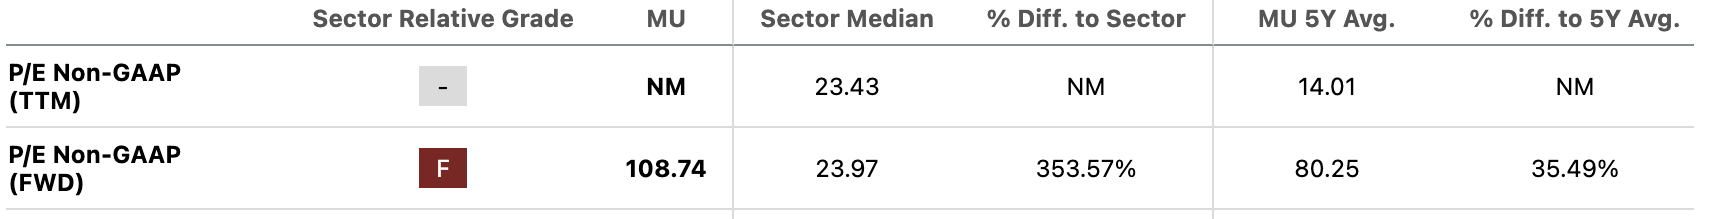
Conclusion
In conclusion, Micron still has all the odds to considerably outperform the market. My EPS estimates (that are 51.05% lower than the average consensus) and that exclude the tax credits and the $3B in HBM revenue for 2025 that Micron is expected to receive, already suggest a present fair stock price of $171.45, and a future stock price for 2029 of $275.07. The first target indicates an upside of 28.8% from the current stock price of $133.07, meanwhile, the second target indicates that until 2029, Micron could deliver 17.8% annual returns.
In future quarters, I would focus on the HBM revenue that Micron is generating and if the number of tax credits that they receive matches my estimates on the second hypothetical model. If this is the case, then I will upgrade my target to that of the second model.
Since my estimates are lower, and already imply a considerable upside, and because of the second direction in which Micron could move, I reiterate my “strong buy” rating on Micron’s stock.
Analyst’s Disclosure: I/we have no stock, option or similar derivative position in any of the companies mentioned, and no plans to initiate any such positions within the next 72 hours. I wrote this article myself, and it expresses my own opinions. I am not receiving compensation for it (other than from Seeking Alpha). I have no business relationship with any company whose stock is mentioned in this article.
Seeking Alpha’s Disclosure: Past performance is no guarantee of future results. No recommendation or advice is being given as to whether any investment is suitable for a particular investor. Any views or opinions expressed above may not reflect those of Seeking Alpha as a whole. Seeking Alpha is not a licensed securities dealer, broker or US investment adviser or investment bank. Our analysts are third party authors that include both professional investors and individual investors who may not be licensed or certified by any institute or regulatory body.