Summary:
- Google is hovering around a support area with no bullish signs in sight.
- This equity has so far fallen short of my $80 target bottoming currently at $83.
- Showing no immediate signs of a turnaround we will examine the drop that may be coming.
Tomas Ragina/iStock via Getty Images
In this article we will cover a short story about how I coped with the digital unthinkable over the festive period before moving to technical analysis and examine where Google (NASDAQ:GOOG) (NASDAQ:GOOGL) may be stopping next. Google is in a bearish three-way pattern so far stopping short of an $80 target, and if this equity surpasses this price region, we will look to the next technical price point.
The yacht has come out of the water for some annual maintenance and while enjoying the unusually warm winter Mediterranean weather while watching proceedings down at the marina the unthinkable happened.
I dropped my phone.
Nothing but a few visual murmurings coming from the screen resembling something of an Atari 64 on the blink.
As you can imagine an immediate panic ensued. What about the 6pm Geneva call? Will my mother be worried about me…. ? (Yes, I am 41!).
And there I was one minute socially solvent and within the blink of an eye socially isolated. Off to the nearest electronics shop and a mix of Spanish and English with the salesman saw me walk out minutes later with an unexpected brand new gadget.
At this point you might be thinking this is where the day gets better but unfortunately, it’s where it gets a lot worse. Recently I had seen a Google notification in my Gmail inbox about a two-step sign in process and this is where an innocuous situation turned to Google lights out. Without boring you with all the details, after signing in, the “second” step required a code being sent to a cell phone number that I happen to no longer have and have not had for years. Yes, I did think of updating it following the Google notification but I do think of doing a lot of things…
So that was it, recovery email not an immediate option I was locked out of Google.
Silence pure silence. Nothing, absolutely nothing. The initial alarm of what if they can’t reach me and I can’t reach them slowly turned to do I want them to reach me and do I want to reach them? A complete digital black out felt like virtually falling off the face of the earth back to caveman times.
And that’s where the separated thinking came from. First was WhatsApp, in your face all day every day, literally no rest from it. Throughout the 99 percent of past human civilization, you would have had to send a messenger or post a letter to reach me and vice versa. And of the last decade I am required to carry this instant messenger so I must listen to people wherever and whenever they want me to. Would it not be better for you to contact me infrequently and I process the information before looking forward to compacting a considered response while I peacefully go about my business, or do I want this thing beeping with you in my face all day every day?!
And the same for the rest of them, LinkedIn to digitally network, Gmail to post instant letters, Tinder or Grinder to digitally meet people ( If your single of course!) Instagram to digitally show what a great life you are living and how many people digitally like it. An app for this, an app for that and an app for the other. God forbid you would actually have to go out and talk to someone in person! Theoretically this won’t be new news but it is like we have morphed into digitally interacting for every emotion or need that we have.
Fortunately or unfortunately, I rectified the recovery issue and am back up and running but I will never forget the unenforced bliss of digital downtime that innocuous phone drop brought me.
Moving on to the Google share price dropping we will now look to where Google may be technically headed next. So far falling short of my $80 target by a couple of dollars there are not yet signs available that Google has bottomed.
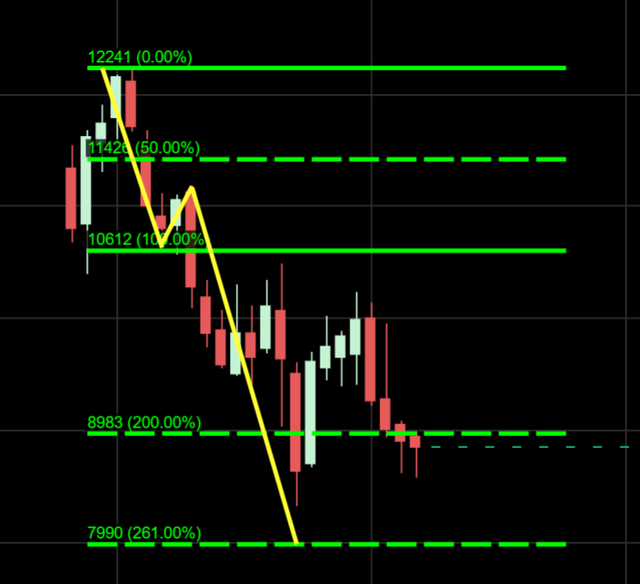
Like many major equities that have had a stock split in the past twelve months there is no future price reading yet cemented on the monthly chart so we must work with the weekly, unusually this bearish wave actually comes from within the confines of a potential bullish wave. We can see in the chart below the wave one $122-$106 with the bullish candle at $106-$110 creating the path for the southern third wave. It has already completed at its target of its wave one copy at $89 but broke it with such vigor, it was the technical next stop of the Fibonacci 261 at $80 the next target call.
Alphabet weekly bearish wave pattern (Ovalx)
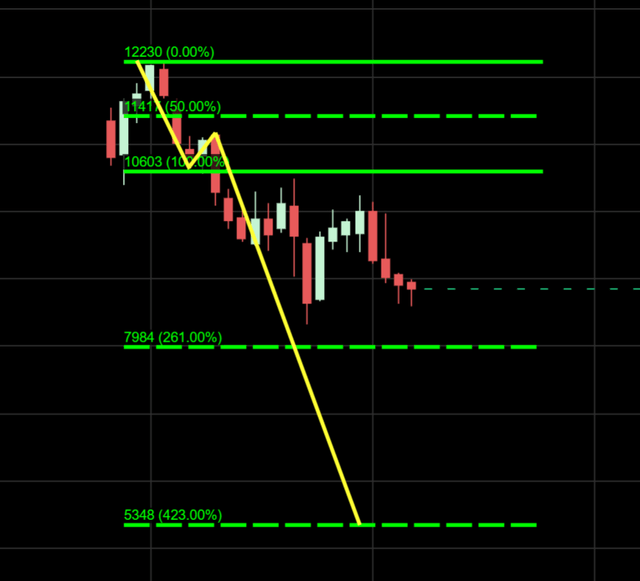
Additionally, if Google does choose to break through this region of $80 it is the Fibonacci 423 that will come next, that lies at the $53 region. We can see in the chart below that this is quite a steep drop but with markets undecided due to the inflationary concerns it is advertising that will be the spending pullback for companies which is where a lot of Google’s revenue is based. We cannot discount this technical region given how there are no live signs of a turnaround going into the end of 2022.
Alphabet weekly Fibonacci 423 price region (Ovalx)
To finalize, I will be looking for bullish wave patterns to form from now on into the Spring. It is possible that Google will turn around from this current price region, another possibility is that this equity chooses to drop to $80 before making its decision. The mid $50 region is also plausible should Google not show signs of a turnaround at the $80 area if it arrives there. I would expect google to hit its $80 target in the next 30-60 days and will be writing an updated article about the price action should it get there.
Disclosure: I/we have no stock, option or similar derivative position in any of the companies mentioned, and no plans to initiate any such positions within the next 72 hours. I wrote this article myself, and it expresses my own opinions. I am not receiving compensation for it (other than from Seeking Alpha). I have no business relationship with any company whose stock is mentioned in this article.
