
Summary:
- AT&T has struggled since its 2021 dividend cut, falling 27% by July 2023 when it hit a 28-year low.
- Since that low, when it traded at 5X earnings and a nearly 9% yield, it’s rallied 67%.
- AT&T’s strong rally has virtually eliminated any excess short-term return potential. Analysts think it might deliver 11% returns, underperforming the S&P through 2026.
- AT&T’s new consensus growth rate of 1.8% is less than half its historical norm. Its fair value yield is likely close to 7%, allowing 8% to 10% historical returns.
- This means AT&T’s 10-year total return expectations are 4% to 5% and about 2.2% adjusted for inflation. That’s almost identical to the 10-year Treasury’s 2.1% real yield. There are four higher yielding, faster growing, and higher quality blue-chip alternatives highlighted in this article, and that’s just scratching the surface of superior alternatives to AT&T.
LumerB
Last week, I showed how Verizon’s (VZ) stable fundamentals and attractive valuation might create an attractive short-term buying opportunity for high-yield investors.
While I can recommend Verizon for a certain kind of income investor, I can’t do the same for AT&T (NYSE:T), its major rival.
Many of our members and SA readers still own AT&T, a powerful cautionary tale about the dangers of high-yield dividend aristocrat investing. I’ve been warning about AT&T for several years now.
YCharts
AT&T spent two years in free fall after the dividend cut, with -27% total returns by July of 2023, compared to flat returns from the dividend aristocrats and about 10% total returns for the S&P 500.
Hartford
The data on dividend cutters is clear; historically, they have been the absolute worst investment you can own.
AT&T Has Risen From Its Lows Like A Phoenix! Or Has It?
YCharts
Since its low, a nearly 9% yield, and 5X P/E in July 2023, AT&T has been off like a rocket.
But let’s not forget what that low represented.
AT&T Share Price Hit 28-Year Low At Its July 2023 Low
YCharts
AT&T bottomed at -70% below its record high set in the 2000 tech bubble. In other words, according to the market, the company’s fundamental business, not adjusted for inflation, delivered zero fundamental value between 1995 and 2023.
Warning: AT&T’s Strong Rally Isn’t Justified
Since many of my readers and DK members still own AT&T, I wanted to warn you that the impressive total return since its low will not be sustainable in the future.
FAST Graphs, FactSet
Without question, of those 28-year lows, AT&T has delivered excellent returns, and it’s still technically modestly undervalued.
FAST Graphs, FactSet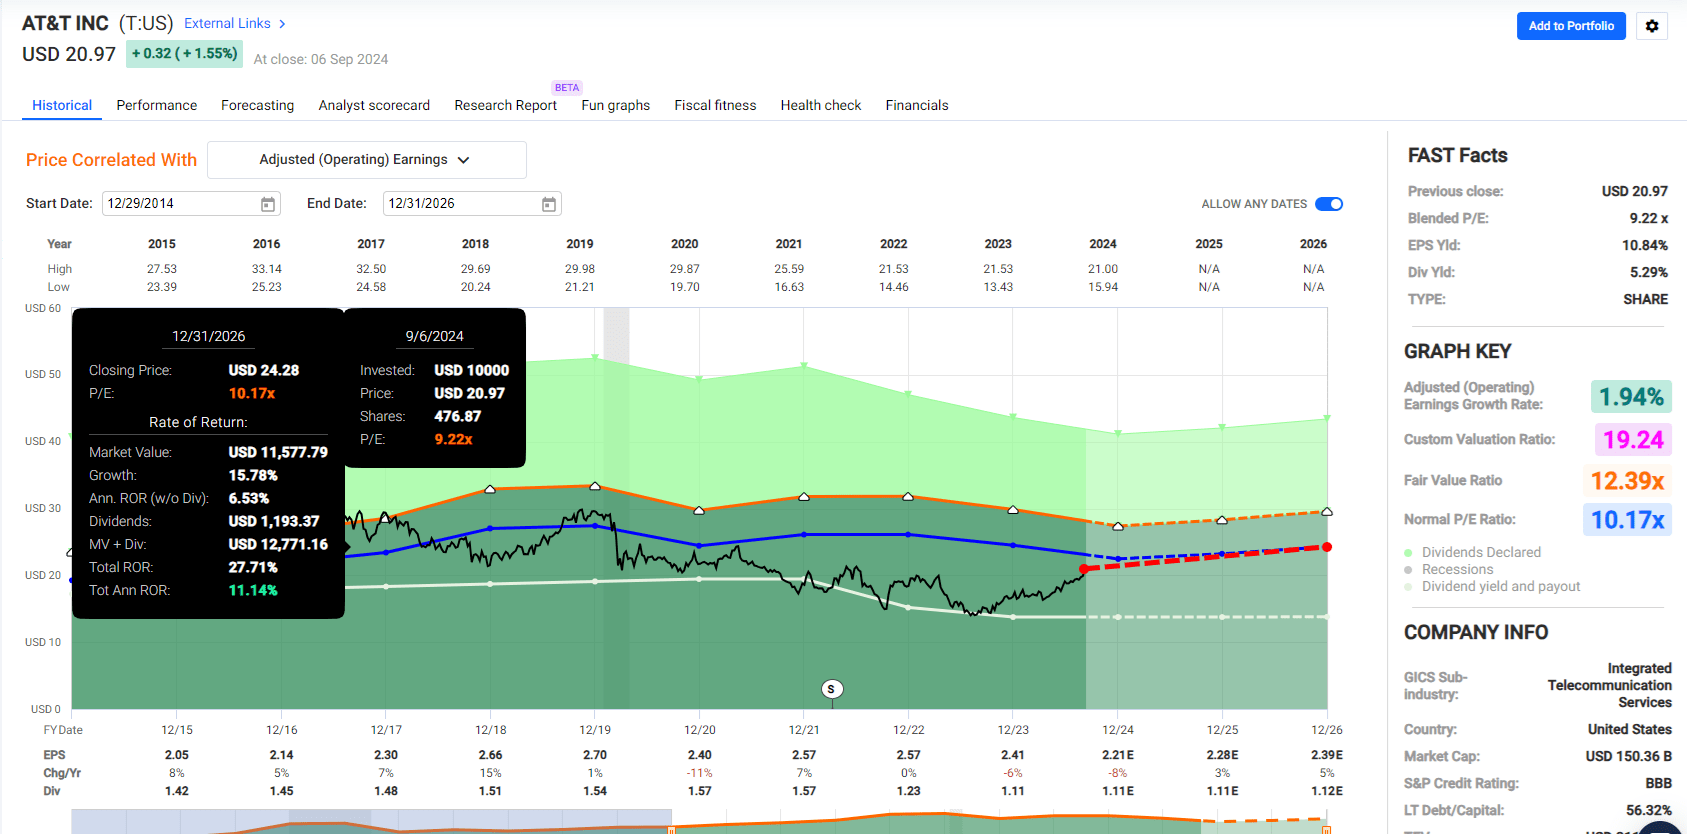
My warning isn’t meant to be a “sell AT&T now, it’s going to crash!”.
AT&T could potentially deliver around 11% annual returns for the next few years…if and only if it grows as expected and returns to its 10-year average P/E.
However, here are three reasons to potentially sell AT&T to lock in these recent profits and deploy them into superior alternatives.
Reason To Potentially Sell AT&T 1: It Might Actually Be Overvalued
AT&T’s value proposition has, for decades, been simple.
This dividend aristocrat (before May 2021) offered a very safe, very generous, and very dependably growing income.
Yield Charts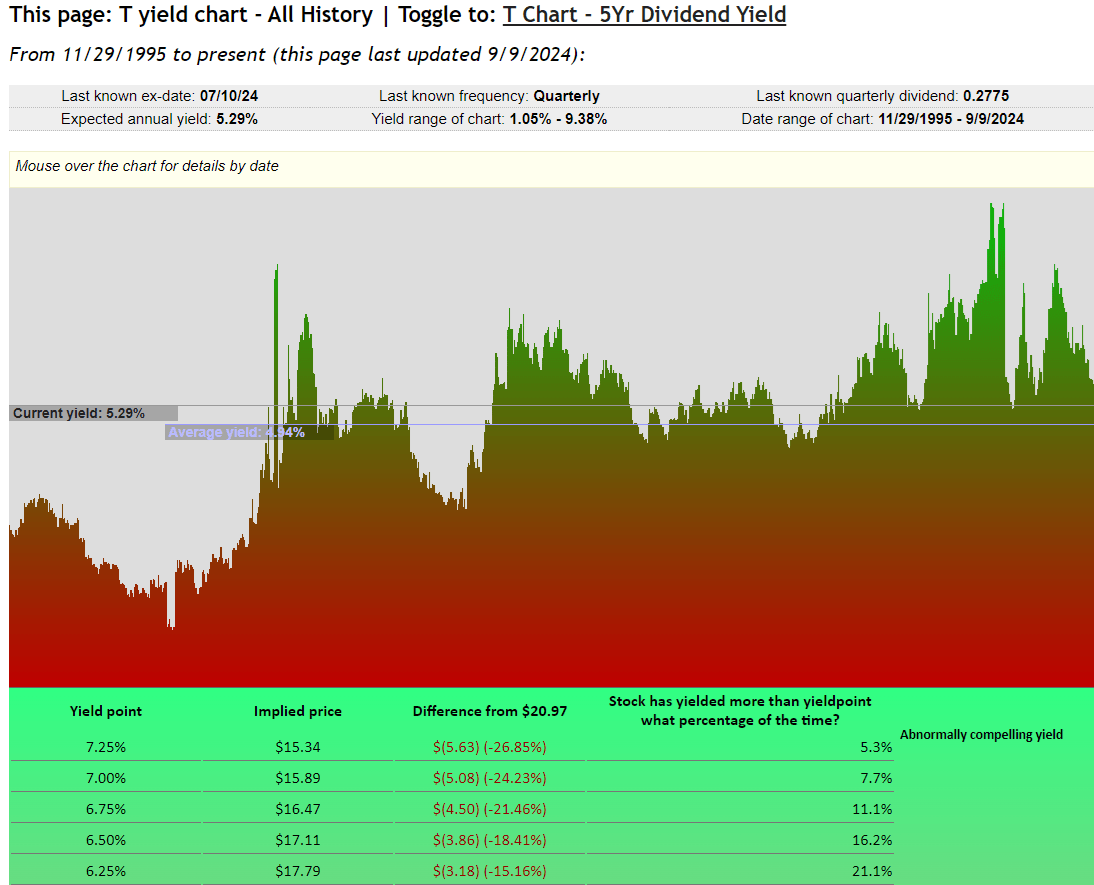
AT&T’s 28-year average yield is 4.9%. That seems to imply that a modest valuation means reversion and possibly a bit more upside on top of a 5.3% yield dividend.
A 5.3% yield and modest cap gains (28% upside potential through 2026) seem attractive in isolation.
YCharts
AT&T’s 5-year average yield of 7.1% might be closer to its long-term fair value now that it’s no longer a dividend aristocrat.
Why AT&T Has Rallied 67%…A Recovery Rally
AT&T’s Worst 50 Monthly Returns Since 1985
| AT&T | Vanguard 500 Index Investor | ||
| Year | Month | Return | Return |
| 2002 | 9 | -18.75% | -10.87% |
| 2001 | 10 | -18.66% | 1.90% |
| 2020 | 3 | -17.23% | -12.37% |
| 2002 | 4 | -16.43% | -6.07% |
| 1990 | 1 | -16.36% | -6.72% |
| 1999 | 8 | -15.86% | -0.50% |
| 2008 | 6 | -15.56% | -8.44% |
| 2003 | 2 | -14.89% | -1.52% |
| 1987 | 11 | -13.42% | -8.19% |
| 2000 | 12 | -13.08% | 0.51% |
| 2017 | 10 | -13.00% | 2.32% |
| 2008 | 9 | -12.72% | -8.91% |
| 2022 | 9 | -12.54% | -9.22% |
| 2009 | 1 | -12.31% | -8.41% |
| 2000 | 2 | -11.95% | -1.91% |
| 2000 | 1 | -11.57% | -5.03% |
| 2002 | 6 | -11.05% | -7.13% |
| 2023 | 5 | -10.98% | 0.42% |
| 1999 | 3 | -10.76% | 4.00% |
| 2002 | 8 | -10.56% | 0.65% |
| 1990 | 8 | -9.88% | -9.03% |
| 2021 | 11 | -9.62% | -0.71% |
| 2008 | 2 | -9.51% | -3.25% |
| 2022 | 7 | -9.21% | 9.21% |
| 2001 | 8 | -9.15% | -6.27% |
| 2003 | 1 | -9.01% | -2.62% |
| 2018 | 12 | -8.64% | -9.04% |
| 2007 | 11 | -8.57% | -4.19% |
| 2002 | 7 | -8.55% | -7.72% |
| 1986 | 9 | -8.52% | -8.31% |
| 1999 | 5 | -8.30% | -2.39% |
| 2016 | 10 | -8.30% | -1.83% |
| 2010 | 1 | -8.15% | -3.60% |
| 1997 | 8 | -8.13% | -5.61% |
| 1997 | 3 | -7.95% | -4.14% |
| 1990 | 6 | -7.71% | -0.66% |
| 2008 | 7 | -7.44% | -0.83% |
| 1999 | 12 | -7.39% | 5.98% |
| 2023 | 7 | -7.35% | 3.20% |
| 2018 | 10 | -7.27% | -6.85% |
| 2003 | 7 | -7.24% | 1.74% |
| 2012 | 10 | -7.18% | -1.86% |
| 2023 | 2 | -7.17% | -2.45% |
| 2022 | 2 | -7.10% | -3.00% |
| 2001 | 4 | -7.03% | 7.77% |
| 1998 | 8 | -7.02% | -14.47% |
| 2018 | 4 | -6.97% | 0.37% |
| 2001 | 6 | -6.95% | -2.45% |
| 2023 | 4 | -6.91% | 1.55% |
| 2010 | 5 | -6.75% | -8.01% |
| Average | -10.33% | -3.30% | |
| Median | -9.08% | -2.81% |
(Source: Portfolio Visualizer)
AT&T’s worst ten monthly returns average a 10.3% decline, while the 5% worst months average a 13.3% decline.
AT&T’s Best 50 Monthly Returns Since 1985
| AT&T | Vanguard 500 Index Investor | ||
| Year | Month | Return | Return |
| 2002 | 10 | 29.33% | 8.78% |
| 2022 | 10 | 20.99% | 8.08% |
| 2000 | 9 | 19.42% | -5.29% |
| 1999 | 4 | 18.70% | 3.85% |
| 2003 | 4 | 18.24% | 8.25% |
| 1998 | 9 | 16.58% | 6.41% |
| 2000 | 10 | 16.21% | -0.43% |
| 2001 | 9 | 15.18% | -8.09% |
| 1998 | 3 | 14.67% | 5.10% |
| 1988 | 1 | 14.49% | 4.17% |
| 1997 | 11 | 14.15% | 4.60% |
| 1999 | 6 | 13.45% | 5.56% |
| 1989 | 7 | 13.38% | 9.01% |
| 2001 | 7 | 13.12% | -1.00% |
| 1989 | 12 | 13.05% | 2.38% |
| 1997 | 9 | 12.99% | 5.47% |
| 2022 | 5 | 12.88% | 0.17% |
| 1993 | 8 | 12.35% | 3.79% |
| 2023 | 1 | 12.26% | 6.27% |
| 2003 | 12 | 11.98% | 5.22% |
| 1991 | 12 | 11.90% | 11.41% |
| 1998 | 12 | 11.86% | 5.81% |
| 2000 | 3 | 11.59% | 9.75% |
| 2002 | 11 | 11.07% | 5.88% |
| 1986 | 8 | 10.88% | 7.45% |
| 1987 | 9 | 10.73% | -2.29% |
| 2002 | 5 | 10.40% | -0.75% |
| 2016 | 6 | 10.37% | 0.25% |
| 1989 | 1 | 10.30% | 7.32% |
| 2016 | 12 | 10.10% | 1.96% |
| 2008 | 3 | 9.96% | -0.44% |
| 1992 | 4 | 9.84% | 2.91% |
| 2014 | 3 | 9.83% | 0.82% |
| 1986 | 6 | 9.77% | 1.67% |
| 2003 | 10 | 9.64% | 5.64% |
| 2019 | 6 | 9.58% | 7.03% |
| 1989 | 4 | 9.34% | 5.18% |
| 1992 | 7 | 9.23% | 4.04% |
| 2010 | 7 | 9.09% | 7.00% |
| 1991 | 10 | 8.99% | 1.33% |
| 2003 | 5 | 8.99% | 5.26% |
| 2006 | 7 | 8.82% | 0.61% |
| 2007 | 12 | 8.77% | -0.70% |
| 1986 | 5 | 8.72% | 5.45% |
| 1995 | 9 | 8.64% | 4.23% |
| 2021 | 3 | 8.53% | 4.37% |
| 2013 | 10 | 8.49% | 4.59% |
| 1996 | 11 | 8.23% | 7.56% |
| 1993 | 2 | 8.17% | 1.36% |
| 2017 | 11 | 8.11% | 3.06% |
| Average | 12.07% | 3.80% | |
| Median | 10.81% | 4.48% |
(Source: Portfolio Visualizer)
AT&T, like any stock, can have incredible short-term rallies from periods of exceptional weakness.
But that doesn’t make it, or most stocks, good long-term investments.
Charlie Bilello 
Since 1926, about 40% of US stocks have beaten risk-free cash (T-bills), and 60% have underperformed cash.
AT&T Historical Total Returns Since 1985
Portfolio Visualizer Premium
AT&T’s average yield since 1985, after the government broke it up (1984), is 5.5%.
It delivered 4.3% EPS growth and 9.8% annual returns during that time.
Portfolio Visualizer Premium
The average rolling 15-year return is 7.4%, a factor in its many bear markets.
Portfolio Visualizer Premium
Adjusting for inflation, AT&T delivered 1264% of total returns, compared to S&P’s 2430%.
- AT&T’s inflation-adjusted return: 7.1%
- S&P’s inflation-adjusted return: 8.9%
At first glance, you might think that 7.1% real returns are pretty good.
Ritholtz Wealth Management 
It’s equal to the S&P’s 7% real return since 1802.
However, there is a very real risk that AT&T’s future real returns will be much lower.
Reason To Potentially Sell AT&T 2: The Real Long-Term Return Potential Is 5%
Consider AT&T’s nominal total return potential and its inflation-adjusted real total return potential.
Ritholtz Wealth Management 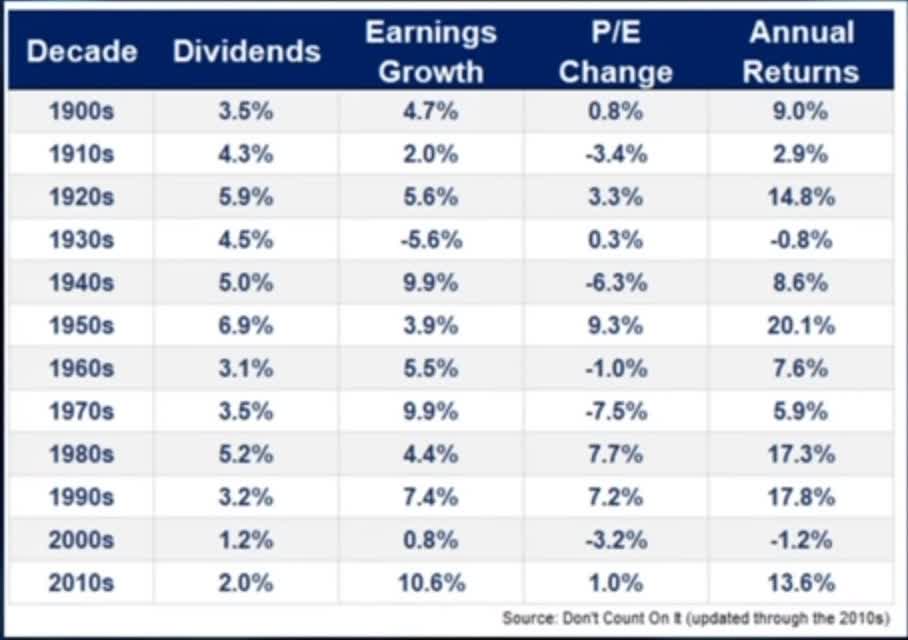
Long-term total returns are a function of yield + long-term growth, with valuations usually canceling out over time.
AT&T now has a 5.3% yield. What is the expected growth rate? It has been 4.3% since 1985.
FactSet Research 
The median long-term growth consensus from all 29 analysts covering AT&T is 1.8%, with a range of 0.3% to 3.0%.
In other words, the range for long-term total returns for AT&T is 5.6% to 8.3%.
- Consensus: 7.1% long-term annual total return potential
Portfolio Visualizer
Given AT&T’s 7.4% average 15-year rolling returns since 1985, a 7.1% long-term total return is very believable, especially for a company whose long-term growth rate has fallen by 50% in the last few decades.
YCharts
The bond market is pricing in 2.3% inflation over the next 30 years, meaning a real total return potential of 3.3% to 5%.
- 4.8% inflation-adjusted total return consensus.
Analysts expect less than 5% real returns from AT&T, significantly lower than its 7.1% historical real return.
AT&T used to be a high-yield aristocrat that could deliver the market’s historical real returns over time.
Now, its real return potential is equal to junk bonds. But with a lot of fundamental risk.
OK, that’s the long-term return potential, but what about the medium term? Maybe AT&T is expected to see a sharp spike in growth that might justify the recent rally and could cause continued strong gains for a few years?
AT&T Medium-Term Growth Consensus
| Year | Sales | Free Cash Flow | EBITDA | EBIT (Operating Income) | Net Income |
| 2023 | $36,458 | $16,768 | $43,400 | $23,461 | $14,298 |
| 2024 | $32,844 | $17,293 | $44,705 | $23,983 | $14,760 |
| 2025 | $36,966 | $17,946 | $45,811 | $25,469 | $15,774 |
| 2026 | $43,496 | $17,446 | $46,425 | $26,242 | $16,180 |
| 2027 | $60,570 | $18,549 | $46,601 | $25,802 | $15,441 |
| 2028 | $68,921 | $17,868 | $45,344 | $24,925 | $14,601 |
| 2029 | $77,212 | $19,397 | $49,227 | $28,394 | $16,725 |
| Annualized Growth 2024-2029 | 13.3% | 2.6% | 2.3% | 3.2% | 2.6% |
| Cumulative 2024-2029 | $320,009 | $108,499 | $278,113 | $154,815 | $93,481 |
(Source: FactSet)
AT&T’s revenue growth is expected to accelerate. Still, due to significantly higher growth spending and settlements for lead cabling, its actual cash flow and profits are expected to grow far more modestly.
(Source: FactSet)
AT&T’s expected growth is running 1.5 million mobile customers per year right now, but that’s expected to grow to almost zero by 2028.
Thanks to T-Mobile’s (TMUS) intense competition, the average mobile user revenue will decline from $50.40 monthly to $49.20 by 2028.
Adjusted for inflation, that’s -2.4% annual ARPU growth.
Still, 2.6% net income growth is slightly better than the 1.8% long-term consensus, so maybe EPS growth through 2029 is more impressive, given the $4.2 billion in expected buybacks?
(Source: FactSet)
Analysts expect AT&T to fund some of its growth spending with additional share issuances, reducing EPS growth to 0.6% through 2028.
- 5.3% yield + 0.6% growth = 5.9% total return potential.
Free cash flow growth is expected to grow at 3.4%
AT&T’s Consensus Dividend Profile
| Year | Dividend | FCF Per Share | Payout Ratio |
| 2023 | $1.11 | $2.18 | 50.92% |
| 2024 | $1.12 | $2.41 | 46.47% |
| 2025 | $1.13 | $2.45 | 46.12% |
| 2026 | $1.14 | $2.29 | 49.78% |
| 2027 | $1.19 | $2.56 | 46.48% |
| 2028 | $1.25 | $2.50 | 50.00% |
| 2029 | $1.24 | $2.66 | 46.62% |
| Annualized | 1.9% | 3.4% | -1.5% |
(Source: FactSet)
AT&T’s payout ratio is expected to remain stable at around 50%, with around 2% dividend growth that won’t keep up with inflation.
OK, but it’s not like AT&T is in a 50+% bubble, like high-yield stocks were in 2017, right?
AT&T at 16X Earnings Was 55% Historically Overvalued
FAST Graphs, FactSet
No, AT&T isn’t in a bubble, though its 5.3% yield might potentially make it overvalued.
- 7.1% 5-year average yield + 1.8% growth is 8.8% long-term return potential.
I believe that AT&T isn’t likely to sustain a 5.3% yield over time unless it can deliver superior growth to what’s expected.
A return to the 5-year average yield seems more likely, representing a 25% decline in price and significant valuation drag in the coming years.
- -2.9% annual valuation boost over the next decade.
In other words, 5.3% yield + 1.8% growth -2.9% valuation drag = 4.2% annual potential total return over the next decade.
2.2% inflation-adjusted total return potential over the next decade.
For context, the inflation-adjusted long-term real yield for 10-year Treasury bonds is expected to be 2.1%.
In other words, based on today’s yield, AT&T offers risk-free US treasury bond-like returns when adjusted for expected inflation.
Reason To Potentially Sell AT&T 3: The Safety & Quality Isn’t Worth It
Remember that all companies have fundamental risks.
Wide Moat Research 
44% of US stocks since 1980 fell 70% from record highs and never recovered.
S&P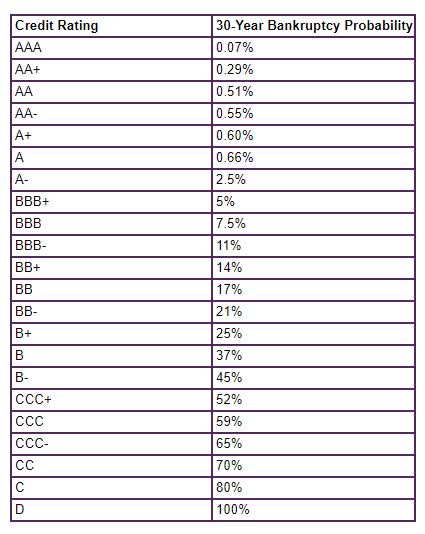
If a company defaults on its debt, it almost always files for bankruptcy, wiping out stock investors.
| Rating Agency | Credit Rating | 30-Year Default/Bankruptcy Risk | Chance of Losing 100% Of Your Investment 1 In |
| S&P | BBB Stable Outlook | 7.50% | 13.3 |
| Fitch | BBB+ Stable Outlook | 5.00% | 20.0 |
| Moody’s | Baa2 (BBB equivalent) Stable Outlook | 7.50% | 13.3 |
| Consensus | BBB Stable Outlook | 6.67% | 15.0 |
(Source: S&P, Fitch, Moody’s)
Rating agencies estimate that there is a 1 in 15 chance that investors buying AT&T will suffer a 100% loss due to bankruptcy.
Of course, if you spend the dividends, even if AT&T did go bankrupt, your losses wouldn’t be total.
So, how safe is that dividend now? With a 50% payout ratio, the dividend is well covered. But what about the rest of the safety metrics that matter?
AT&T’s Balance Sheet
FactSet
AT&T’s $130 billion debt is much better than before it merged Time Warner with Discovery and spun it off.
$130 billion in debt is irrelevant; the leverage ratio of 2.95 is on its way to 2.9X, indicating that AT&T’s balance sheet is strong, thus the BBB credit rating consensus.
The company’s $15 billion in liquidity is good, and the bond market is very confident that AT&T will still be around in 73 years and paying its debt.
FactSet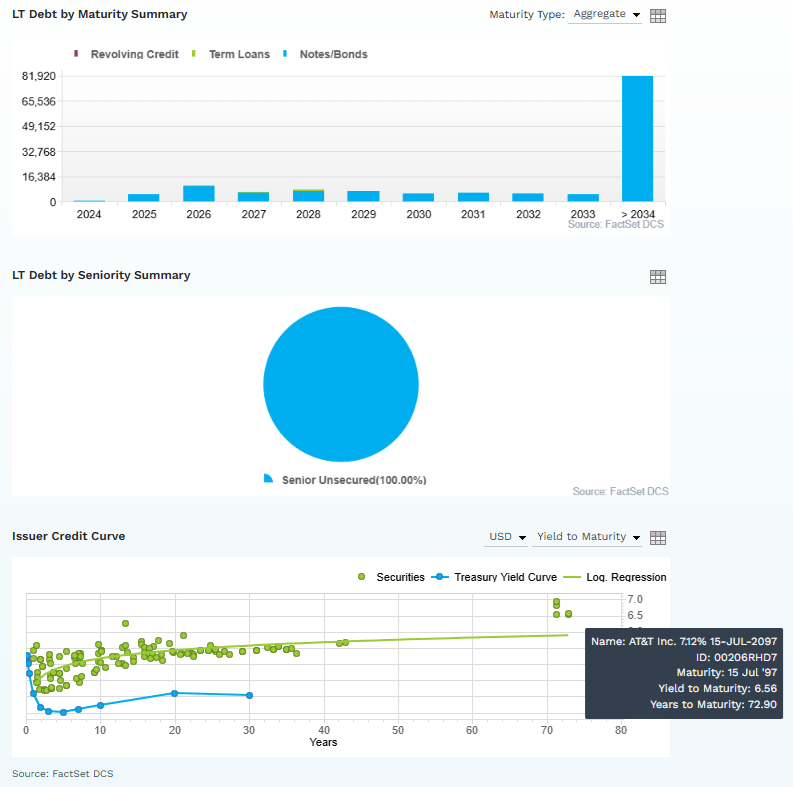
AT&T’s real-time fundamental risk can be derived from credit default swaps insurance policy bond investors trade against the risk of default each day.
FactSet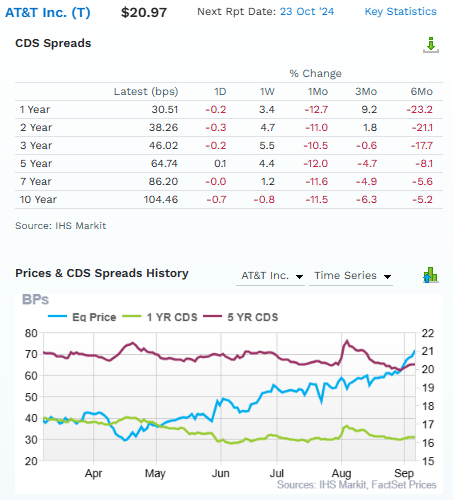
AT&T’s fundamental risk has declined by about 10% in the last six months. The strong rally has nothing to do with fundamental risk, which has remained relatively stable.
Its risk of bankruptcy in the next year is 0.3051%, and its risk within the next decade is 1.0446%.
- 30-year bankruptcy risk 3.138%
- Consistent with A-credit rating.
The bond market is optimistic that AT&T will eventually get upgraded because it’s already pricing AT&T’s default risk as if it were an A-rated company.
Why?
AT&T Balance Sheet Consensus Forecast
| Year | Total Debt (Millions) | Cash | Net Debt (Millions) | Interest Cost (Millions) | EBITDA (Millions) | Operating Cash Flow (Millions) | Average Interest Rate |
| 2023 | $127,352 | $3,583 | $122,955 | $6,875 | $44,705 | $23,983 | 5.40% |
| 2024 | $121,029 | $5,316 | $114,098 | $6,636 | $45,811 | $25,469 | 5.48% |
| 2025 | $123,267 | $7,877 | $108,359 | $6,222 | $46,425 | $26,242 | 5.05% |
| 2026 | $130,604 | $9,797 | $108,163 | $5,754 | $46,601 | $25,802 | 4.41% |
| 2027 | $130,604 | NA | $99,655 | $6,142 | $45,344 | $24,925 | 4.70% |
| 2028 | $130,604 | NA | NA | $6,922 | $49,227 | $28,394 | 5.30% |
| Annualized Growth | 0.5% | 39.8% | -4.2% | 0.1% | 1.9% | 3.4% | -0.4% |
(Source: FactSet)
AT&T’s debt is expected to grow slowly, but net debt is falling at an impressive 4%.
AT&T Leverage Consensus Forecast
| Year | Debt/EBITDA | Net Debt/EBITDA (3.5 Or Less Safe According To Credit Rating Agencies) |
Interest Coverage (4+ Safe) |
| 2023 | 2.85 | 2.75 | 3.49 |
| 2024 | 2.64 | 2.49 | 3.84 |
| 2025 | 2.66 | 2.33 | 4.22 |
| 2026 | 2.80 | 2.32 | 4.48 |
| 2027 | 2.88 | 2.20 | 4.06 |
| 2028 | 2.65 | NA | 4.10 |
| Annualized Change | -0.5% | -5.5% | 8.7% |
(Source: FactSet)
AT&T’s net leverage is expected to keep falling to 2.2X in 2027, with its interest coverage rising around 9% annually.
Rating agencies consider 3.5X net leverage ratios and 4+ interest coverage ratios safe for telecoms.
That’s the critical thing to consider when dealing with debt. Debt is always and forever 100% irrelevant.
What matters is the ratio of debt to cash flows that service debt and the stability of those cash flows.
Dividend Kings Dividend Safety Webinar 
Rating agencies set various safe leverage ratios based on the industry and cash flow stability (such as contract duration for midstream).
The more stable the cash flow, the more utility like the recurring cash flow, and the higher the safe amount of debt a company can maintain.
A corporation with 5.5X debt/EBITDA would be junk bond rated, but a utility could be BBB-rated.
A REIT like Realty Income (O) can safely maintain 6X leverage, which would send the average corporation to B-level junk bond ratings.
Cyclical companies with unstable cash flows, such as chipmakers or oil companies, would be junk bonds rated at 3X leverage, which is considered safe for BBB-rated corporations.
So you can see how debt alone is irrelevant; leverage ratios are even relevant in the context of cash flow stability.
A BBB-rated REIT can have 4X higher leverage than an oil company because the safety of a company’s balance sheet is 100% about its ability to service debt, not how much debt it has.
If AT&T were to increase its debt 10X to $1.3 trillion but its cash flow 10X as well, then even with $1.3 trillion in debt, its leverage ratio would be 2.95X, and it would be a safe balance sheet.
Overall Dividend Safety
GuruFocus 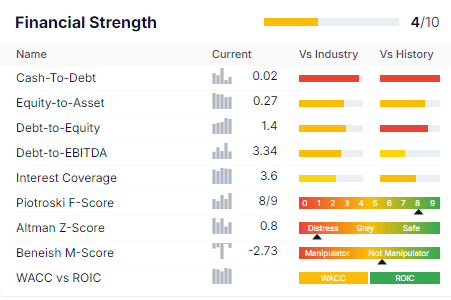
There is much more to dividend safety than just debt and payout ratios.
I consider over 1,000 total metrics, including advanced accounting metrics like F- and Z-scores (short-term bankruptcy risk, updated each quarter based on quarterly filings) and accounting fraud risk (Beneish M-score).
Good fundamentals can collapse if a company cooks its books overnight, so this risk must be accounted for.
- AT&T’s risk of accounting fraud is 17% or less.
| Rating | Dividend Kings Safety Score (Over 1,000 Metric Model) | Approximate Dividend Cut Risk (Average Recession) | Approximate Dividend Cut Risk In Pandemic Level Recession |
| 1 – unsafe | 0% to 20% | over 4% | 16+% |
| 2- below average | 21% to 40% | over 2% | 8% to 16% |
| 3 – average | 41% to 60% | 2% | 4% to 8% |
| 4 – safe | 61% to 80% | 1% | 2% to 4% |
| 5- very safe | 81% to 100% | 0.5% | 1% to 2% |
| AT&T | 83% | 0.5% | 1.85% |
| S&P Risk Rating | 80% Percentile, Very Good | BBB stable outlook credit rating = 5% 30-year bankruptcy risk | 15% or Less Max Risk Cap |
(Source: Dividend Kings Zen Research Terminal)
There isn’t a problem with AT&T’s current dividend in terms of dividend cut risk. The 50% payout ratio, safe leverage ratios, good interest coverage ratio, solid advanced accounting metrics, and profitability metrics all indicate the new dividend is very low risk.
However, the company’s overall quality at 79% is good but not great. This isn’t an Ultra SWAN quality company like many wide-moat aristocrats.
And given its lack of a moat, confirmed by negative real ARPU for mobile wireless subscribers, it never will be.
S&P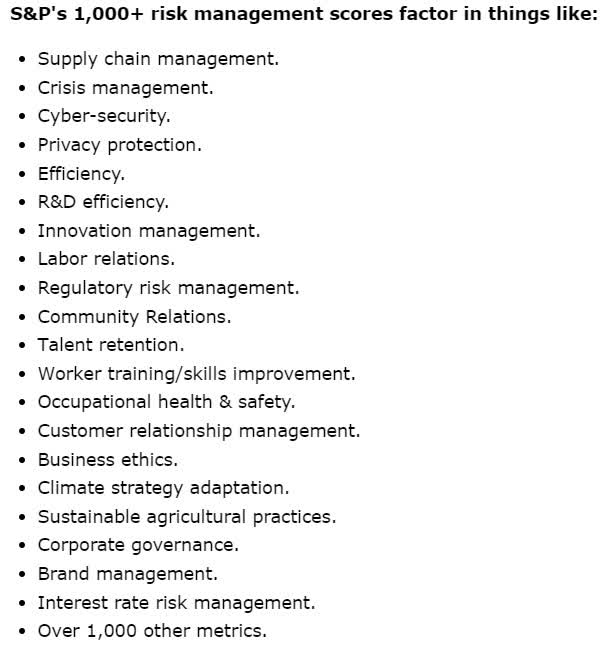
| S&P LT Risk Management Score | Rating |
| 0% to 9% | Very Poor |
| 10% to 19% | Poor |
| 20% to 29% | Suboptimal |
| 30% to 59% | Acceptable |
| 60% to 69% | Good |
| 70% to 79% | Very Good |
| 80+% | Exceptional |
| AT&T | 59% |
| Global Percentile | 80% |
(Source: S&P)
S&P thinks the new AT&T, without any media properties and with no empire-building, is managing its risks very well.
But that only means the probability of AT&T failing in the future is small, not that investors will earn strong returns or dividend growth that outpaces inflation.
Bottom Line: AT&T Isn’t Likely To Fail, But The Opportunity Cost Of Owning It Long-Term Is Too High
AT&T isn’t likely to lose investors’ money if you buy at today’s 5.3% yield.
However, given the best available data, it appears that over the next decade, investors should expect inflation-adjusted returns of approximately 2.2%.
That’s not much better than risk-free long-term US treasury bonds for a company whose safety quality and risk management are far from world-class or industry-leading best-in-breed.
With limited upside over the next 2.5 years (26% at best), less than the 35% analysts expect from S&P, and much lower than many higher-yielding, higher-quality blue chips, I can’t recommend buying AT&T at this time.
In fact, given the negative opportunity costs, I would say it’s reasonable and prudent for any investors who have enjoyed gains during the 67% rally off the July 2023 lows to consider selling to redeploy into far superior high-yield opportunities like Verizon, British American (BTI), or Enterprise Products Partners (EPD), or Scotiabank (BNS).
Superior Alternatives To AT&T
FAST Graphs, FactSet FAST Graphs, FactSet FAST Graphs, FactSet FAST Graphs, FactSet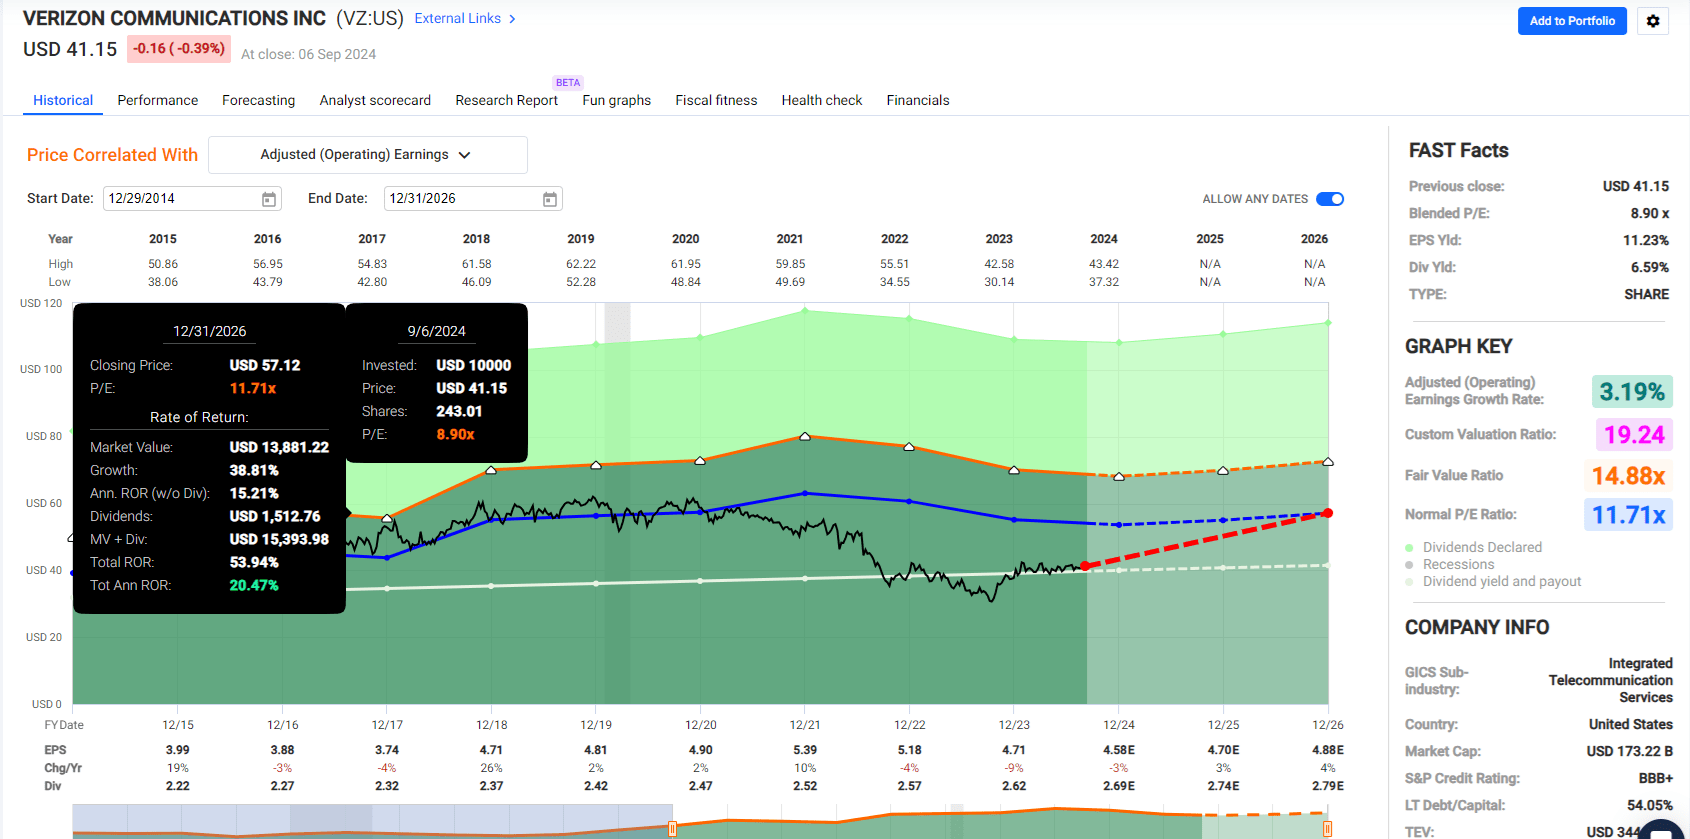


Analyst’s Disclosure: I/we have no stock, option or similar derivative position in any of the companies mentioned, and no plans to initiate any such positions within the next 72 hours. I wrote this article myself, and it expresses my own opinions. I am not receiving compensation for it (other than from Seeking Alpha). I have no business relationship with any company whose stock is mentioned in this article.
Seeking Alpha’s Disclosure: Past performance is no guarantee of future results. No recommendation or advice is being given as to whether any investment is suitable for a particular investor. Any views or opinions expressed above may not reflect those of Seeking Alpha as a whole. Seeking Alpha is not a licensed securities dealer, broker or US investment adviser or investment bank. Our analysts are third party authors that include both professional investors and individual investors who may not be licensed or certified by any institute or regulatory body.
—————————————————————————————-

Dividend Kings helps you determine the best safe dividend stocks to buy via our Automated Investment Decision Tool, Zen Research Terminal, Correction Planning Tool, and Daily Blue-Chip Deal Videos.
Membership also includes
-
Access to our 14 model portfolios.
-
my real money $2.5 million family portfolio.
-
50% discount to iREIT (our REIT-focused sister service)
-
real-time chatroom support
-
real-time email notifications of all my family portfolio buys.
-
numerous valuable investing tools
Click here for a two-week free trial, so we can help you achieve better long-term total returns and your financial dreams.