Summary:
- Cisco’s acquisition of Splunk, valued at $28 billion, is expected to enhance Cisco’s gross margins and revenue growth despite a $5.74 billion premium paid on the acquisition.
- The deal will boost Cisco’s gross margins from 64.7% to 66.5% by 2029, driven by Splunk’s higher software-focused gross margins.
- We expect Cisco’s revenue growth to increase to 6.3% on average through 2029, significantly benefiting from Splunk’s integration and cross-selling opportunities.
- Despite increased debt and interest payments, the acquisition aligns with Cisco’s strategy, leading to a Buy rating.
raisbeckfoto
In our previous analysis, we highlighted that while Cisco Systems, Inc. (NASDAQ:CSCO) remained the market leader in the switching and routing market, it faces increasing competition from both major rivals and smaller players. However, we expected its growth to be supported by its Applications and Security segments, with projected growth rates of 5.4% and 12.1% respectively through 2026.
In this analysis, we examine whether the company could benefit from the acquisition of Splunk in terms of revenue growth and profitability margins. In March 2024, the company completed the acquisition of Splunk, paying approximately $28 bln in equity (or $157 per share) for Splunk. First, we examine the terms of the deal to determine whether it is positive for shareholders. We then assess Splunk’s impact on profitability margins by compiling the company’s and Splunk’s profitability margins and determining the pre and combined margins. Lastly, we analyze the company’s revenue growth outlook with Splunk, identify the specific segment benefiting from the acquisition, and explore how Splunk supports the growth of that segment.
Premium Paid Greater Than Expected Synergies
Firstly, we explain the terms of the deal, estimate the synergies, and determine whether the acquisition benefits Cisco’s shareholders.
We begin by analyzing the terms of the deal, focusing on the costs involved to assess whether the impact on shareholders is positive. First, we calculate the premium (Price offered for the target less the Value of the target before the merger). Then, we determine whether there is a gain for Cisco by calculating the difference between the expected synergies and the total premium paid.
|
Acquisition of Splunk |
|
|
Splunk Share Price (Before Acquisition Announcement) |
$114.60 |
|
Splunk Shares Outstanding (‘mln’) |
168.50 |
|
Splunk Pre-acquisition value (VT) ($ mln) |
19,310 |
|
Splunk Share Price (After Acquisition Announcement) |
$157.00 |
|
Splunk Shares Outstanding (‘mln’) |
168.50 |
|
Total Price Offered by Cisco (PT) ($ mln) |
26,455 |
|
Total Premium (PT) ($ mln) |
7,145 |
|
Gain/Loss to Cisco |
|
|
Synergies Estimate ($ mln) |
1,403 |
|
Total Premium Paid ($ mln) |
7,145 |
|
Net Gain/Loss ($ mln) |
(5,742) |
Source: Company Data, Khaveen Investments
We calculated Splunk’s pre-acquisition value of $19.3 bln and its total payment for Splunk of $26.5 bln based on its offered price per share of $157 which is a 37% premium compared to Splunk’s share price prior to the acquisition announcement in September 2023. In total, we calculated a total premium of $7.1 bln for Cisco’s Splunk acquisition.
Additionally, we then determined whether the deal was positive for Cisco by deriving potential revenue synergies. According to the company from its previous earnings briefing, management highlighted an opportunity to convert 5,000 Cisco customers to Splunk customers. Assuming management achieves this target, we estimate revenue synergies of $1.4 bln, based on average Splunk revenue per customer of $0.28 mln based on its 2024 revenues and total Splunk customers of 15,000. Moreover, the expected revenue synergies are in line with management expectations, as they highlighted that “the revenue synergies that we’re focused on really are driven around the 5,000 accounts” and that “we get our team ramped up on how to sell Splunk”. Additionally, we added expected revenue synergies ($1,403 mln) with the total premium ($7,145 mln) to calculate a total loss of $5.74 bln.
Overall, we calculated a loss to shareholders of Cisco of $5.74 bln with the Splunk deal as we calculated its premium paid of $7.1 bln exceeds our estimates for its revenue synergies of $1.4 bln. Our calculation did not take into account potential cost synergies. However, management highlighted from its earnings briefing that the deal is “much more driven by revenue synergies than cost synergies”. Therefore, we do not expect its cost synergies to cover the loss from the deal. Notwithstanding, we examine the potential impact of the acquisition on Cisco’s profitability and revenue growth, as management had also highlighted that the deal could benefit its gross margins and revenue acceleration.
Higher Gross Margins But Lower Net Margins
In our second section, we analyze whether the acquisition of Splunk will contribute positively to Cisco’s profitability margins.
Thus, we compile the company’s and Splunk’s gross, operating, and net income margins for 2023 to determine its pre-acquisition margins. We then forecast Splunk’s gross margin of 75.7% by averaging Splunk’s 4-year gross margins. We also forecast Splunk’s operating margin to be the same as 2023 (5.7%) rather than the 4-year average, as Splunk’s operating margins are finally positive in 2023 compared to its previous 10-year negative operating margins. Furthermore, we forecast Splunk’s net income margins, similarly, using 2023 margins as its previous 10-year net margins were negative. We also forecast Cisco’s gross, operating, and net income margins using our financial model. Lastly, we forecast the total combined post-acquisition profitability margin using the weighted average profitability margin formula.
|
Profitability Margins |
2014 |
2015 |
2016 |
2017 |
2018 |
2019 |
2020 |
2021 |
2022 |
2023 |
|
Gross Margin (Cisco) |
60.3% |
60.4% |
62.7% |
63.0% |
62.3% |
62.9% |
64.3% |
64.0% |
62.5% |
62.7% |
|
Gross Margin (Splunk) |
84.7% |
82.9% |
79.8% |
80.4% |
80.9% |
81.8% |
75.5% |
72.6% |
77.7% |
77.0% |
|
Operating Margin (Cisco) |
22.1% |
23.0% |
26.2% |
26.5% |
26.0% |
28.1% |
28.6% |
27.6% |
27.2% |
27.3% |
|
Operating Margin (Splunk) |
-47.9% |
-43.1% |
-35.6% |
-14.1% |
-13.9% |
-12.2% |
-35.0% |
-42.9% |
-6.5% |
5.7% |
|
Net Margin (Cisco) |
16.7% |
18.3% |
21.8% |
20.0% |
0.2% |
22.4% |
22.7% |
21.3% |
22.9% |
22.1% |
|
Net Margin (Splunk) |
-48.1% |
-41.8% |
-36.8% |
-14.5% |
-15.3% |
-14.3% |
-40.7% |
-50.1% |
-7.6% |
6.3% |
Source: Company Data, Khaveen Investments
Based on the table above, Cisco’s historical gross margins have been moderately lower compared to Splunk, averaging around 62.5%, likely because of Splunk’s unique software business model, which has no direct manufacturing costs. Based on its previous quarterly report, Splunk highlighted that it operates as one operating segment, which is “the development, marketing, and sale of cloud services and licensed software solutions”. Comparatively, Cisco’s margins are lower, as product revenue represented 75.7% of its $56,998 mln revenue for 2023 and its product revenues require direct manufacturing costs. Additionally, both Cisco and Splunk’s gross margins have been fairly stable for the last 10 years.
Furthermore, Cisco’s operating margins and net income margins have been consistently higher than Splunk’s. However, Splunk’s operating margins and net income margins have been improving as operating margins have increased from -47.9% in 2014 to 5.7% in 2023, likely because Splunk has only begun achieving economies of scale. Based on Splunk’s revenue for the past 10 years, it has grown from a mere $303 mln in 2014 to a significant $3,654 mln in 2023, which likely allowed Splunk to finally reach the necessary revenue level to achieve economies of scale. Importantly, Splunk’s net income margin is higher than its operating margin, due to its income tax provision benefits, as the company recorded negative operating and net profits for the last 10 years. Based on its 3Q FY2024 report, Splunk recorded an income tax provision (benefit) of $17.8 mln, which increased its profit before taxes by 12.3%.
|
Margin Forecast |
2025F |
2026F |
2027F |
2028F |
2029F |
|
Gross Margin (Cisco) |
64.7% |
64.7% |
64.7% |
64.7% |
64.7% |
|
Gross Margin (Splunk) |
75.7% |
75.7% |
75.7% |
75.7% |
75.7% |
|
Total Combined Gross Margins |
65.8% |
65.9% |
66.1% |
66.3% |
66.5% |
|
Operating Margin (Cisco) |
40.4% |
40.4% |
40.4% |
40.4% |
40.4% |
|
Operating Margin (Splunk) |
5.7% |
5.7% |
5.7% |
5.7% |
5.7% |
|
Total Combined Operating Margins |
37.0% |
36.6% |
36.1% |
35.6% |
34.8% |
|
Net Margin (Cisco) |
19.2% |
19.2% |
19.2% |
19.2% |
19.2% |
|
Net Margin (Splunk) |
6.3% |
6.3% |
6.3% |
6.3% |
6.3% |
|
Total Combined Net Margins |
17.9% |
17.7% |
17.6% |
17.4% |
17.1% |
Source: Company Data, Khaveen Investments
Based on the table, we forecast the total combined gross margins of Cisco to be higher, increasing from 64.74% to 65.0% in 2025. This is because Splunk is a software-focused company and thus has higher gross margins with minimal direct manufacturing costs. Moreover, we forecasted the gross margin to reach 66.5% in 2029 as Splunk revenues grow. This is also in line with management expectations of improving gross margins, as they highlighted that Splunk will be “gross margin-accretive in fiscal ’25” from its earnings call. However, we expect the total combined operating margins to be lower to be lower at 37% in 2025 as Splunk has low operating profit margins. As a result, we also expect the combined 2025 net margins to decrease to 17.9% due to Splunk’s lower net margin. Notwithstanding, the company’s margins may improve should it realize cost synergies. However, management previously highlighted that the deal is “much more driven by revenue synergies than cost synergies”, highlighting its greater focus on revenue synergies.
Positive Revenue Growth Boost from Splunk
Lastly, we analyzed which specific segment will benefit from Splunk and how the acquisition of Splunk might support the specific segment’s growth.
Thus, we compiled both Splunk and Cisco’s segment revenue breakdown and revenue growth for the past 8 years. We then identified which segment Splunk would belong to. Lastly, we analyzed the growth trend of Splunk, the key drivers behind its growth trends, and its market growth outlook.
|
Cisco and Splunk Revenue Breakdown by Segment ($ mln) |
2016 |
2017 |
2018 |
2019 |
2020 |
2021 |
2022 |
2023 |
Average |
|
Secure, Agile Networks |
23,409 |
22,773 |
23,420 |
25,311 |
23,265 |
22,725 |
23,831 |
29,105 |
|
|
Growth % YoY |
-2.7% |
2.8% |
8.1% |
-8.1% |
-2.3% |
4.9% |
22.1% |
3.5% |
|
|
Internet for the Future |
4,424 |
4,304 |
4,426 |
4,784 |
4,180 |
4,511 |
5,276 |
5,306 |
|
|
Growth % YoY |
-2.7% |
2.8% |
8.1% |
-12.6% |
7.9% |
17.0% |
0.6% |
3.0% |
|
|
Collaboration |
4,861 |
4,729 |
4,863 |
5,256 |
4,823 |
4,727 |
4,472 |
4,052 |
|
|
Growth % YoY |
-2.7% |
2.8% |
8.1% |
-8.2% |
-2.0% |
-5.4% |
-9.4% |
-2.4% |
|
|
Optimized Application Experiences |
600 |
584 |
600 |
649 |
524 |
654 |
729 |
811 |
|
|
Growth % YoY |
-2.7% |
2.8% |
8.1% |
-19.2% |
24.8% |
11.5% |
11.2% |
5.2% |
|
|
End-to-End Security |
1,969 |
2,152 |
2,353 |
2,730 |
3,158 |
3,382 |
3,699 |
3,859 |
|
|
Growth % YoY |
9.3% |
9.3% |
16.0% |
15.7% |
7.1% |
9.4% |
4.3% |
10.2% |
|
|
Services |
11,993 |
12,300 |
12,621 |
12,899 |
13,323 |
13,804 |
13,539 |
13,856 |
|
|
Growth % YoY |
2.6% |
2.6% |
2.2% |
3.3% |
3.6% |
-1.9% |
2.3% |
2.1% |
|
|
Others |
1,996 |
1,168 |
1,050 |
281 |
28 |
15 |
11 |
9 |
|
|
Growth % YoY |
-41.5% |
-10.1% |
-73.2% |
-90.0% |
-46.4% |
-26.7% |
-18.2% |
-43.7% |
|
|
Total Cisco Revenue |
49,252 |
48,009 |
49,334 |
51,909 |
49,301 |
49,818 |
51,557 |
56,998 |
|
|
Growth % YoY |
-2.52% |
2.76% |
5.22% |
-5.02% |
1.05% |
3.49% |
10.55% |
2.2% |
|
|
Splunk Revenue |
944 |
1,309 |
1,803 |
2,359 |
2,229 |
2,674 |
3,654 |
4,208 |
|
|
Growth % YoY |
38.7% |
37.7% |
30.8% |
-5.5% |
20.0% |
36.6% |
15.2% |
24.8% |
Source: Company Data, Khaveen Investments
Based on the table above, Cisco’s 7-year average revenue growth of 2.2% is significantly lower than Splunk’s 7-average of 24.8%. However, Cisco’s growth had been relatively more stable than Splunk’s, whereas Splunk’s growth trend had been slowing down over the period from 39.7% to 15.2% in 2023. In terms of Cisco’s segment breakdown, its largest segment is Secure, Agile Networks, which is 51.1% of revenues but has been growing slowly with an average of 3.5%. On the other hand, Cisco’s security segment has the highest growth but is only 6.8% of its revenues in 2023.
Following the completion of the acquisition in Q2, Splunk’s revenue was accounted for in Cisco’s Security and Service segments. We calculated the portion of Splunk’s revenue is mainly (77%) in Security and the remainder in Services (18%). This is because Splunk is a software security platform. Furthermore, we believe Splunk falls under the “Vulnerability and Security Analytics” segment in the cybersecurity market, as Splunk’s core offerings focus on collecting, analyzing, and visualizing machine-generated data for security analytics and threat detection.
Based on the company’s management, in addition to Splunk’s current revenue contribution to Cisco, Splunk also represents a strong cross-selling opportunity for Cisco to sell additional products to its existing customers, as the company highlighted that there is an “initial target of 5,000 Cisco accounts with no Splunk presence identified as a good fit” and with management explaining the 5,000 identified accounts had “no Splunk footprint today”. From its latest earnings briefing, management provided a positive outlook that it is “integrating powerful new customer solutions and beginning to realize early synergies”. Additionally, another benefit of Splunk’s acquisition includes its strong integration with Cisco’s XDR (Extended Detection and Response), as management explained that its recently released XDR already had 230 customers and was “going to be a real important integration point with Splunk”. Based on its website, Cisco’s XDR is similar to Splunk’s business model, as Cisco’s XDR helps collect and correlate data across different data sources such as email, servers, and networks to detect, investigate, and respond to unusual threats.
|
Revenue Forecast ($ mln) |
2024 |
2025F |
2026F |
2027F |
2028F |
2029F |
Average |
|
Revenue (Cisco) |
52,428 |
54,031 |
55,683 |
57,386 |
59,141 |
60,949 |
|
|
Growth % |
3.1% |
3.1% |
3.1% |
3.1% |
3.1% |
3.1% |
|
|
Revenue (Splunk) |
1,375 |
5,692 |
6,619 |
7,698 |
8,953 |
10,412 |
|
|
Growth % |
313.9% |
16.3% |
16.3% |
16.3% |
16.3% |
75.8% |
|
|
Revenue Synergies |
281 |
351 |
468 |
701 |
1,403 |
||
|
Total Combined |
53,803 |
60,003 |
62,653 |
65,552 |
68,795 |
72,764 |
|
|
Growth % |
11.5% |
4.4% |
4.6% |
4.9% |
5.8% |
6.3% |
Source: Company Data, Khaveen Investments
We updated our previous revenue forecasts for the company at a 5-year forward average of 3.1% with combined revenues from Splunk. Additionally, based on our previous analysis, we expect Splunk to grow at the forecasted security market CAGR of 16.3% driven by cybersecurity growth drivers such as the increasing number of cyberattacks (ransomware, phishing, and data breaches) as well as the increasing digital transformation trend towards IoT, ML, and Cloud which increases the potential of new attacks. Notably, revenue for Splunk in 2024 was $1,375 mln as it had accounted for only 1 quarter of actual Splunk revenue contribution, and Splunk’s revenue in 2025 includes our full-year forecast. Other than that, we expect the total combined revenue forecast for the company to grow moderately by 6.3% on average. We also expect Splunk to provide a large contribution towards Cisco’s revenue, increasing Cisco’s pre-acquisition forward 5-year forecasted average revenues by 103%.
We compiled the discounted net income forecast to measure the total benefit that Splunk is providing to Cisco. We first calculated the incremental revenue of Splunk and its revenue synergies for each year. For example, in 2025F, we calculated it as 2025 combined revenue (Cisco + Splunk + revenue synergies) and minus against 2024 combined revenue, multiplied by Splunk net margins to get incremental net income. We then divided the incremental net income against the discount factor based on the company’s WACC of 8.6%.
|
Discounted Incremental Net Income From Splunk ($ mln) |
2025F |
2026F |
2027F |
2028F |
2029F |
Total |
|
Incremental Revenue (From Splunk) |
5,692 |
6,619 |
7,698 |
8,953 |
10,412 |
39,375 |
|
Incremental Net Income (From Splunk) |
357 |
415 |
483 |
562 |
653 |
2,470 |
|
Revenue Synergies |
281 |
351 |
468 |
701 |
1,403 |
|
|
Net Income Synergies |
50 |
62 |
82 |
122 |
240 |
|
|
Discount Factor |
1.08 |
1.17 |
1.26 |
1.36 |
1.47 |
|
|
Discounted Incremental Net Income |
377 |
409 |
448 |
502 |
607 |
2,343 |
Source: Company Data, Khaveen Investments
Based on the table, we calculated a total incremental revenue to Cisco from Splunk of 39.4 bln over the 5-year forecast period and a total incremental net income of $2.5 bln. Additionally, we estimate its revenue synergies to reach $1.4 bln by 2029, contributing to $233 mln in net income. Based on its discount rate, we calculated the total present value of the cumulative incremental net income to the company to be $2.3 bln.
Furthermore, following the recent outage caused by CrowdStrike (CRWD), we examine whether Cisco with Splunk could capitalize on the event. Both Cisco and Splunk compete directly with CrowdStrike within the “Vulnerability and Security Analytics” cybersecurity segment, specifically under Secure Information and Event Management (SIEM). This is because Cisco and Splunk’s combined SIEM product offering collects and analyzes datasets to detect software vulnerabilities. Additionally, we believe the acquisition strengthened Cisco’s SIEM offering due to better integration synergies such as SecureX Threat Response, whereby the Splunk module for SecureX enables an investigator to collect from many data sources by using Splunk as a translation layer between data models, or Secure Malware Analytics, which combines Splunk and Cisco’s security analytics for better data visualization. Moreover, we believe Splunk is still the market leader (largest SIEM market share, 29.8%) compared to CrowdStrike (below the top 10 market share) despite CrowdStrike’s strong Next-Gen SIEM (released May 2024) offering that includes Charlotte AI, a GenAI security analyst with product and documentation knowledge. This is because Splunk already has a comprehensive suite of AI SIEM embedded offerings since July 2023 such as Splunk’s AI Assistant for chatbot security queries, ML-Assisted Thresholding for detecting risk thresholds, and Splunk’s App to integrate AI and custom ML. Splunk is also one of the top leaders in Gardner’s SIEM Magic Quadrant for 2024. Moreover, we do not expect Cisco and Splunk (SIEM company) to benefit from the recent CrowdStrike outage affecting Microsoft cloud (MSFT), as Microsoft uses its own SIEM, Microsoft Sentinel.
Risk: Higher Debt from Acquisition
Company Data, Khaveen Investments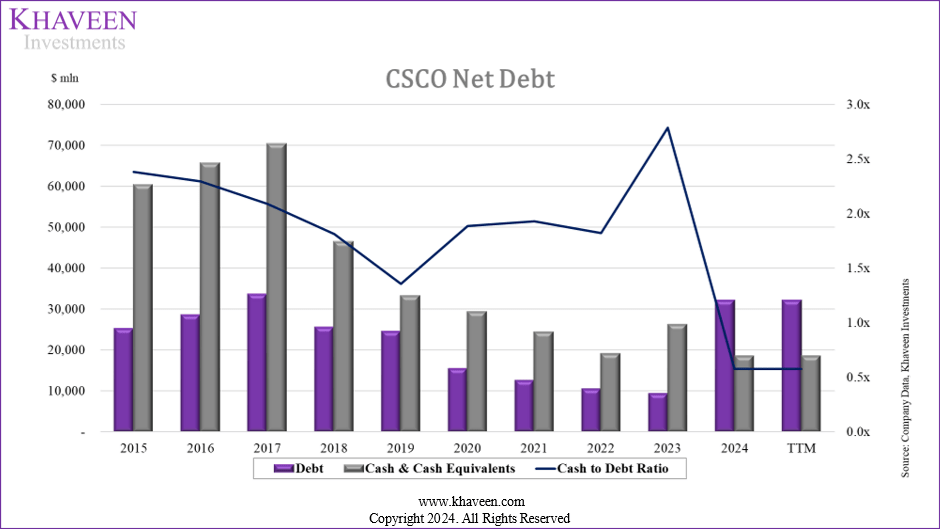
Based on the chart above, Cisco’s debt has increased significantly as a result of the acquisition, increasing from $9,452 mln to $32,243 mln in 2024. We believe this poses a risk to Cisco, as the company will now make higher interest payments and decrease its net income. During the Q3 FY2024 earnings call, management highlighted the “interest impact from the acquisition, which we expect to be a headwind of approximately $350 million per quarter”. In the latest quarter, management also highlighted that “the interest impact from financing the Splunk acquisition more than offset the positive operating impact of Splunk”. Furthermore, Cisco is currently in a net debt position compared to a net cash position previously, which increases its financial risk in terms of short-term liquidity.
Verdict
All in all, we believe Cisco’s acquisition of Splunk is a strategic but costly move, with both immediate financial impacts and long-term growth potential. The $7.1 bln premium paid for Splunk exceeds our estimated $1.4 bln in revenue synergies, leading to an estimated $5.74 bln loss. Despite this, we expect the deal to positively impact Cisco’s gross margins, raising them from 64.7% to 66.5% % by 2029 due to Splunk’s superior gross margins as a software-focused company. Additionally, we expect the deal to provide a growth boost to Cisco, with a projected 3.2% increase in our 5-year forecasts for Cisco to 6.3% on average through 2029, representing a 103% increase to Cisco’s growth over the period. Overall, while the deal may be costly, we believe the acquisition aligns with Cisco’s strategy to accelerate revenue growth.
Khaveen Investments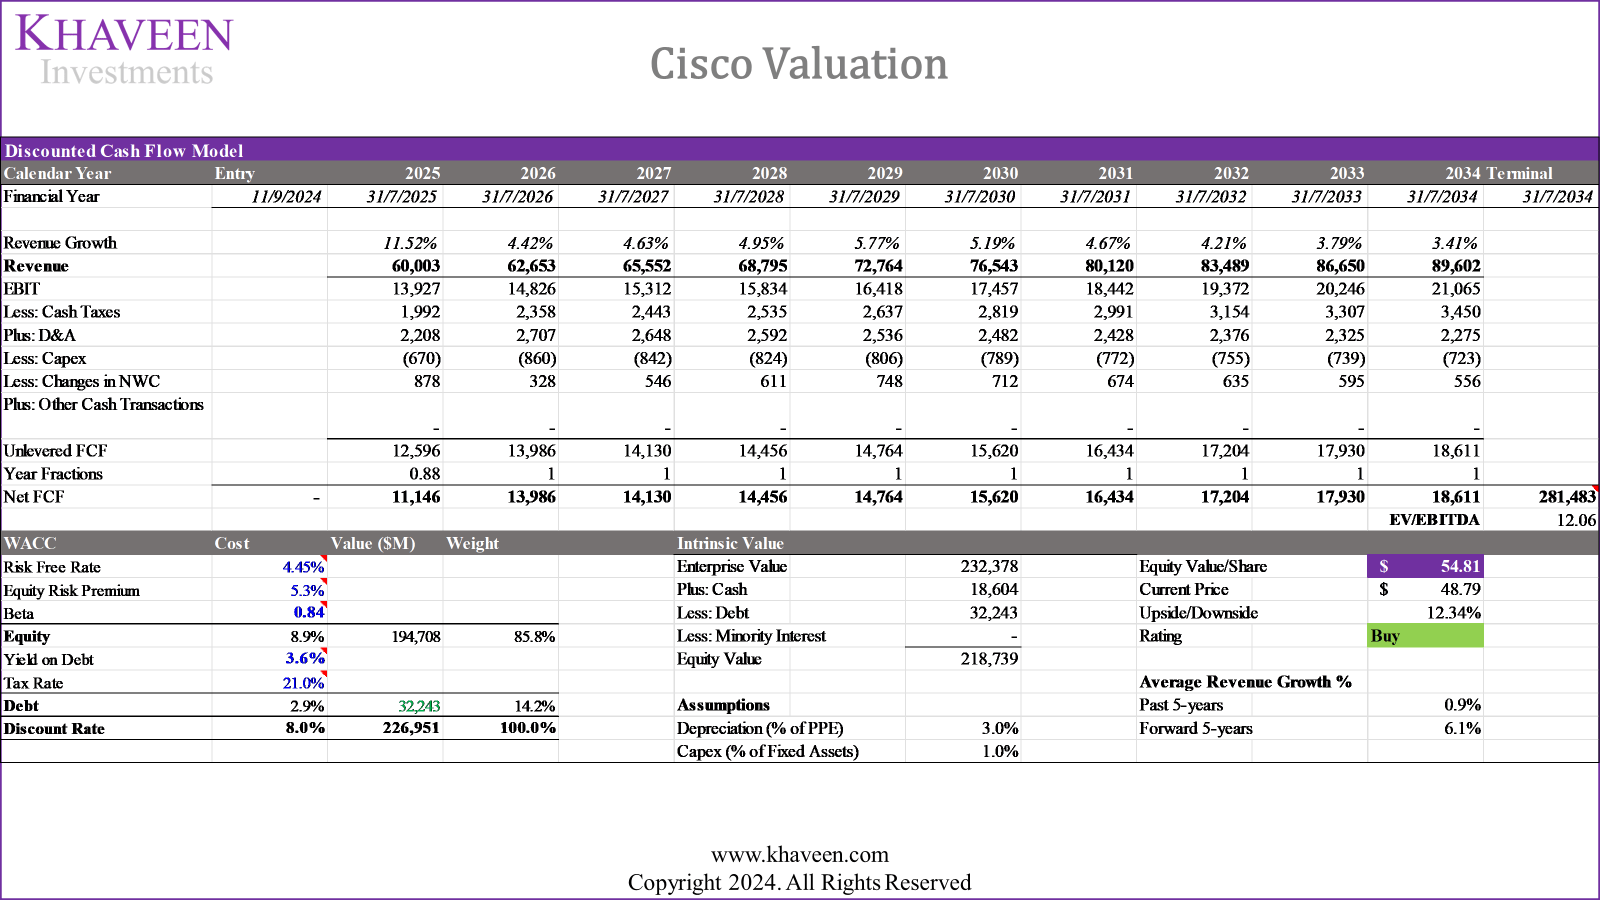
To value the company, we used a DCF valuation as we expect the company to have positive FCFs with an average FCF margin of 15.1% through 2028. Moreover, we based our capex assumption beyond 2024 on its capex only excluding other investing cash flows which is only 1.2% of fixed assets, compared to previously where we forecasted its capex based on a total investing cash flow including other investing cash flows at 6.5% of revenues. For the terminal value, we used an average EV/EBITDA based on the company’s 5-year historical average of 12.06x. Overall, we obtained an upside of 12.34% and rated the company as a Buy with a price target of $54.81. Moreover, the company’s stock is down 14% in the past year, thus further indicating an attractive valuation.
Analyst’s Disclosure: I/we have a beneficial long position in the shares of CSCO either through stock ownership, options, or other derivatives. I wrote this article myself, and it expresses my own opinions. I am not receiving compensation for it (other than from Seeking Alpha). I have no business relationship with any company whose stock is mentioned in this article.
No information in this publication is intended as investment, tax, accounting, or legal advice, or as an offer/solicitation to sell or buy. Material provided in this publication is for educational purposes only and was prepared from sources and data believed to be reliable, but we do not guarantee its accuracy or completeness.
Seeking Alpha’s Disclosure: Past performance is no guarantee of future results. No recommendation or advice is being given as to whether any investment is suitable for a particular investor. Any views or opinions expressed above may not reflect those of Seeking Alpha as a whole. Seeking Alpha is not a licensed securities dealer, broker or US investment adviser or investment bank. Our analysts are third party authors that include both professional investors and individual investors who may not be licensed or certified by any institute or regulatory body.