Summary:
- Micron is seeing growth in the HBM market but management’s market share outlook of ~20% has negatively surprised me; I expected it to be higher given Samsung’s lagging position.
- I believe the main positive surprise in Q4 was better gross margins delivery due to cost savings in DRAM production and better HBM yields. This is expected to continue.
- Micron still trades at a modest 32% premium vs its memory peers. I am not sure if this is justified as I doubt overall outperformance vs its competition.
- Despite a positive earnings reaction, the longer-term relative technicals vs the S&P500 point to a range-bound scenario with no clear bullish direction.
- HBM market share dynamics, capex intensity and FCF margins are key monitorables to track.
Meh SebastianKnight/iStock via Getty Images
Performance Assessment
I initiated coverage on Micron (NASDAQ:MU) a few days before the release of the latest Q4 FY24 results with a ‘Neutral/Hold’ rating. The company’s beat-and-raise delivery has caused the stock to rally almost 15% on the day after the earnings release, outperforming the S&P500 (SPY) (SPX):
Performance since Author’s Last Article on Micron (Seeking Alpha, Author’s Last Article on Micron)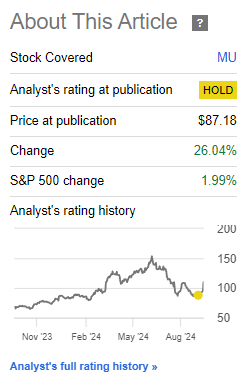
Thesis
Seeking Alpha Analysts’ and Wall St’s Ratings on Micron (Seeking Alpha – Micron’s Page)
I recognize the bullish fundamental developments in Micron. However, I struggle to align with the consensus bullish views on the stock based on the following considerations:
- Micron is seeing growth in the high bandwidth memory market, but management’s market share outlook has negatively surprised me
- Margin profile is turning around
- Micron still trades at a modest premium vs its memory peers
- Despite a positive earnings reaction, longer-term relative technicals remain unclear
- Capex intensity and FCF margins are key monitorables
Micron is seeing growth in the high bandwidth memory market, but management’s market share outlook has negatively surprised me
As mentioned in my previous note, Micron is one of the first-movers in qualifying for high bandwidth memory (HBM) products used in NVIDIA’s (NVDA) GPUs (please see my last article for a layman’s description of HBM). In the Q4 earnings call, management provided more details on the growth potential in this market (150% CAGR since 2023) and the portfolio mix contribution it would have on Micron’s portfolio:
We expect the HBM total available market (TAM) to grow from approximately $4 billion in calendar 2023 to over $25 billion in calendar 2025. As a percent of overall industry DRAM bits, we expect HBM to grow from 1.5% in calendar 2023 to around 6% in calendar 2025… our HBM is sold out for calendar 2024 and 2025, with pricing already determined for this time frame
– CEO Sanjay Mehrotra in the Q4 FY24 earnings call
Demand is red-hot, as Micron has completely sold out its HBM products for the remainder of CY24 and CY25. Importantly, the pricing for these products is already secured. I view this as a savvy move, since keeping pricing variable would probably lead to less favorable terms as supply from Samsung – which is currently in the process of securing qualification for its HBM products for use in NVIDIA’s Blackwell – comes into the market soon.
From a market positioning perspective, management has shared that it expects its HBM market share to match that of its overall DRAM market share next year:
expect to achieve HBM market share commensurate with our overall DRAM market share sometime in calendar 2025
– CEO Sanjay Mehrotra in the Q4 FY24 earnings call
I am a bit negatively surprised by this statement, since it implies that they expect to have about 20% market share in HBM next year:
Global DRAM Industry Revenue Trends (TrendForce)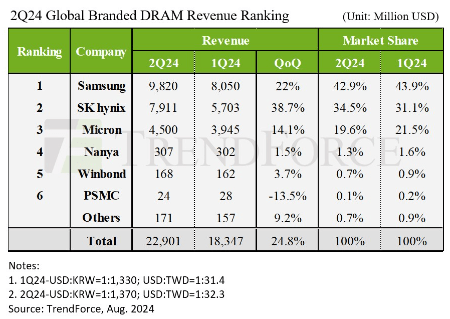
Now, the 2 main leading players in HBM currently are Micron and SK Hynix, as they were the first to qualify for NVIDIA’s Blackwell products. Samsung is a little bit further behind, but catching up. So why is Micron not expected to command a much larger share than the number 3 position it has in the DRAM market? Is SK Hynix’s share much larger than that of Micron? These are the doubts in my mind.
To assuage these doubts somewhat is Micron management’s indications that their HBM products are superior due to 20% lower power consumption and 50% higher DRAM capacity than its competitors. Nevertheless, I would be tracking the latest industry commentary on DRAMeXchange to better monitor the evolving HBM market dynamics.
Margin profile is turning around
Micron’s margin profile is finally turning around. In the latest quarter, it saw a +860bps increase in the gross margins:
Gross profit margin (Company Filings, Author’s Analysis)
And a further +110bps increase due to lower opex intensity, boosting EBIT margins from 10.0% to 19.7%:
EBIT (USD mn) (Company Filings, Author’s Analysis)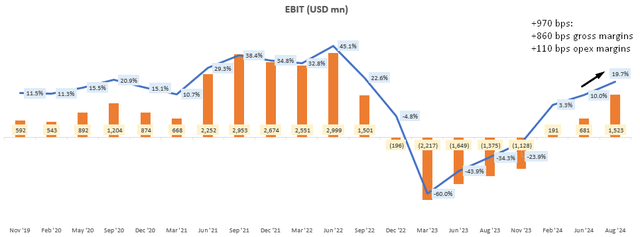
This has been driven mostly by demand tailwinds (discussed more in my last article, as Q4 FY24’s results and commentary were broadly in-line with prior trends) and also cost and yield improvements in DRAM and HBM yields:
We delivered fiscal 2024 DRAM front-end cost reductions at the high end of the outlook provided at the beginning of the year, and NAND cost reductions were consistent with our forecast… Even as our DRAM gross margins improved, our fiscal Q4 HBM gross margins were accretive to both company and DRAM gross margins, indicative of our solid HBM yield ramp
– CEO Sanjay Mehrotra in the Q4 FY24 earnings call
Management sees further scope to save costs in DRAM production and realize better HBM yields, which is a key reason for why they have surprised Wall St by delivering a 192bps beat on their gross margins guidance for Q1 FY25:
Gross Margins Guidance Surprise vs Consensus (bps) (Capital IQ, Author’s Analysis)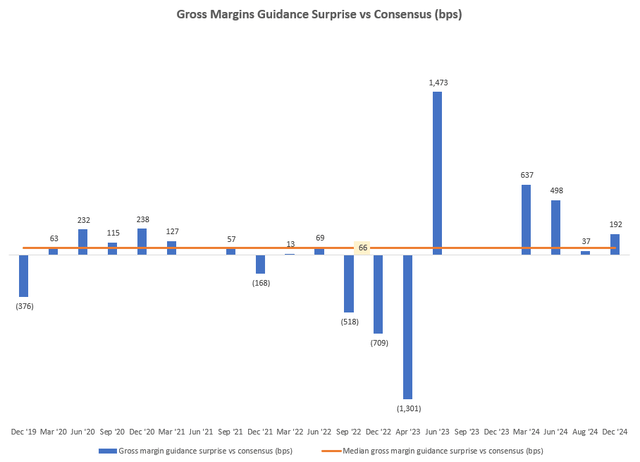
Micron trades at a modest premium vs its memory peers
Micron trades at a P/B of 2.7x, which is a 32% premium to the average 2.1x P/B of its key competitors:
P/B Comps (Capital IQ, Author’s Analysis)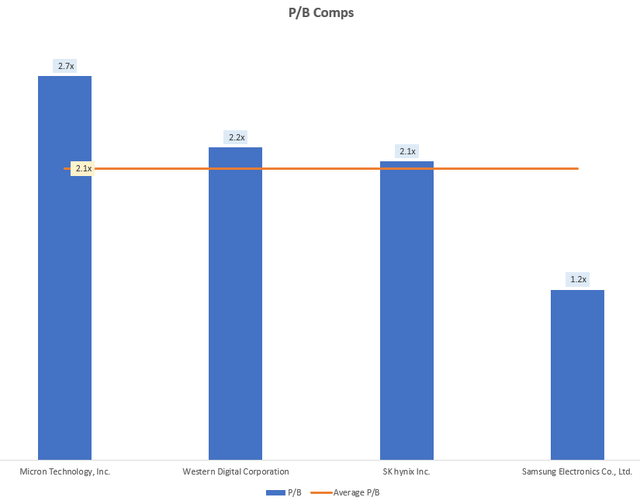
In my last article, I shared reasons for why, despite positive industry demand tailwinds, Micron may not be outperforming its peers. I still have these concerns since, as mentioned before, management’s commentary on their HBM market share outlook has been lower than what I expected.
Despite a positive earnings reaction, longer-term relative technicals remain unclear
If this is your first time reading a Hunting Alpha article using Technical Analysis, you may want to read this post, which explains how and why I read the charts the way I do. All my charts reflect total shareholder return as they are adjusted for dividends/distributions.
Relative Read of MU vs SPX500
MU vs SPX500 Technical Analysis (TradingView, Author’s Analysis)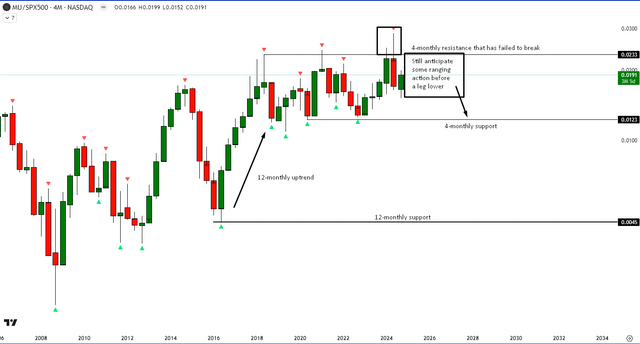
On the relative chart of MU vs the S&P500, despite a positive earnings reaction in the short term (1 day after earnings release), I do not see a material chance from a broader 4-monthly (multi-quarter) perspective. After a false breakout of the 4-monthly resistance, I continue to anticipate some sideways action and likely fall down to the 4-monthly support.
Capex intensity and FCF margins are key monitorables
In addition to tracking HBM market shares, I am also watching for risks related to overshooting on capex:
Management expects capex intensity to increase from 33.4% of TTM revenues as of Q4 FY24 to 35% for FY25, driven by construction of its greenfield fab in Idaho and to increase HBM production capacity.
TTM Capex % of Revenue (Company Filings, Author’s Analysis)
Accounting for this increase in capex intensity and assuming a ~450bps net increase in FCF margins based on a flow through of 420bps gross margin improvement in Q1 FY25 (39.5% Q1 FY25 guide vs 35.3% Q4 FY24 delivery) and assuming some more gradual improvement henceforth, I expect FY25 FCF margins to be around 5%:
TTM FCF Margin (Company Filings, Author’s Analysis)
Takeaway & Positioning
I think the biggest positive surprise in Micron’s Q4 FY24 results is the gross margins expansion driven by cost savings in DRAM production and improved HBM yields. On the demand drivers side of things, although management discussed the strong positive tailwinds particularly in HBM products, I do not view this as much of an incremental positive since my analysis of the memory market trends in DRAM, NAND, SSDs and HBM in my initiating coverage of Micron already provided awareness of these trends. In fact, management’s comment on their expectation of their HBM market share next year to be equal to that of their DRAM market share (where they command 3rd position at ~20%) is a negative surprise to me. This is because as an early mover along with SK Hynix, I expected Micron’s share to be higher as Samsung is lagging a little bit behind.
On the valuations side, Micron is priced dearly vs its key competitions, trading at a 32% premium. I am doubtful about whether or not this is justified since despite positive industry demand drivers, it is unclear whether Micron is on-track to outperform its peers overall.
Technically, relative to the S&P500, Micron remains range-bound after a false breakout on the 4-monthly chart. I do not see a clear directional bias ahead, particularly on the bullish side.
Rating: ‘Neutral/Hold’
How to interpret Hunting Alpha’s ratings:
Strong Buy: Expect the company to outperform the S&P500 on a total shareholder return basis, with higher than usual confidence. I also have a net long position in the security in my personal portfolio.
Buy: Expect the company to outperform the S&P500 on a total shareholder return basis
Neutral/hold: Expect the company to perform in-line with the S&P500 on a total shareholder return basis
Sell: Expect the company to underperform the S&P500 on a total shareholder return basis
Strong Sell: Expect the company to underperform the S&P500 on a total shareholder return basis, with higher than usual confidence
The typical time-horizon for my views is multiple quarters to more than a year. It is not set in stone. However, I will share updates on my changes in stance in a pinned comment to this article and may also publish a new article discussing the reasons for the change in view.
Analyst’s Disclosure: I/we have no stock, option or similar derivative position in any of the companies mentioned, and no plans to initiate any such positions within the next 72 hours. I wrote this article myself, and it expresses my own opinions. I am not receiving compensation for it (other than from Seeking Alpha). I have no business relationship with any company whose stock is mentioned in this article.
Seeking Alpha’s Disclosure: Past performance is no guarantee of future results. No recommendation or advice is being given as to whether any investment is suitable for a particular investor. Any views or opinions expressed above may not reflect those of Seeking Alpha as a whole. Seeking Alpha is not a licensed securities dealer, broker or US investment adviser or investment bank. Our analysts are third party authors that include both professional investors and individual investors who may not be licensed or certified by any institute or regulatory body.
