
Summary:
- Bank of America’s results on Friday were in line with our investment case, with ROTCE exceeding 15% in both Q4 and the full year.
- Net interest income, benefiting from rate hikes, grew by 22% in 2022 and is expected to grow another 10% in 2023.
- The overhead ratio improved and is expected to improve again next year; reserves are now sufficient for a mild recession in 2023.
- BAC has benefited less from rate rises than JPM and has a lower return on equity, but BAC stock is cheaper at 1.6x versus JPM’s 2.0x.
- With shares at $35.23, we expect a total return of 62% (18.5% annualized) by the end of 2025. The dividend yield is 2.5%. Buy.
tuaindeed/iStock via Getty Images
Introduction
We review our Bank of America Corporation (NYSE:BAC) investment case after Q4 2022 results released on Friday (January 13). BAC stock initially fell at market open but finished the day up 2.2%.
BAC stock has gained 35% (including dividends) since we initiated our Buy rating on Seeking Alpha in October 2019. However, relative to a year ago, the share price is currently 24% lower, even after rising 11% in the past month:
|
Bank of America Share Price (Last 1 Year) 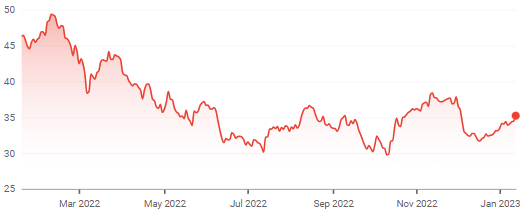 Source: Google Finance (15-Jan-23). |
BAC’s Q4 2022 results were in line with our investment case. Return on Tangible Common Equity (“ROTCE”) exceeded our 15% long-term assumption for both Q4 and the full year. Strong growth in Net Interest Income (“NII”) more than offset a modest decline in Non-Interest Revenue (“NIR), and the Overhead Ratio has continued to improve. Loan growth and Net Charge-Offs were sequentially worse in Q4, but likely due to seasonal and unusual factors. Management comments on 2023 imply that NII will grow another 10% and the Overhead Ratio will improve again. Credit allowances now assume a mild recession in 2023, so reserve builds are likely to be limited next year. Buybacks have started to reaccelerate after target capital ratios were met. BAC’s ROTCE continues to be lower than JPMorgan’s (JPM), but we believe its lower valuation already reflects this. BAC shares have a normalized P/E of 10.8x and an Dividend Yield of 2.5%. Our forecasts indicate a total return of 62% (18.5% annualized) by 2025 year-end. Buy.
Bank of America Investment Case Recap
We believe large U.S. banks like Bank of America and JP Morgan can grow their earnings at “GDP +”, thanks to their scale, diversified franchises and leading market positions:
- Large banks achieve NII on favourable Net Interest Yields, thanks to their cheap deposit funding; yields had shrunk in recent years due to Quantitative Easing (“QE”), but are now rising again
- They have large Non-Interest Revenues such as Investment Banking Fees, which tend to become elevated during periods of QE as cheap money stimulates corporate and market activity, offsetting NII weakness
- Their cost ratios tend to be stable or improving, as economies of scale and use of technology help them become more efficient
- They are now far less vulnerable to economic downturns than in the past, thanks to central banks’ willingness to deploy QE and much larger capital buffers after the 2008 crisis
The core of our investment case is that BAC will maintain a mid-teens long-term ROTCE on a growing capital base:
|
BAC Group ROTCE (Since 2013) 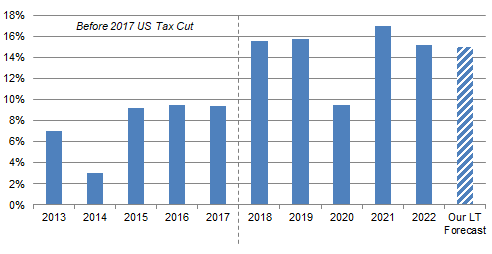 Source: BAC results supplements. NB. Excludes $2.07bn First Data JV impairment in 2019. |
Compared to its peer JPMorgan (also Buy-rated; see our review of Q4 2022 results) BAC is more weighted towards U.S. retail banking, its low-cost deposit franchise means it should benefit more from rising interest rates, and it faces less stringent regulatory capital requirements as it continues to grow in size.
Q4 2022 results are in line with our investment case, though BAC benefited less from higher rates than JPM.
BAC Q4 Results Headlines
In Q4 2022, BAC achieved a ROTCE of 15.8% in what was a mixed quarter, benefiting from higher interest rates but suffering from a lower level of corporate and capital markets activity and higher credit provisions:
|
BAC Results Headlines (Reported Basis) (Q4 2022 vs. Prior Periods) 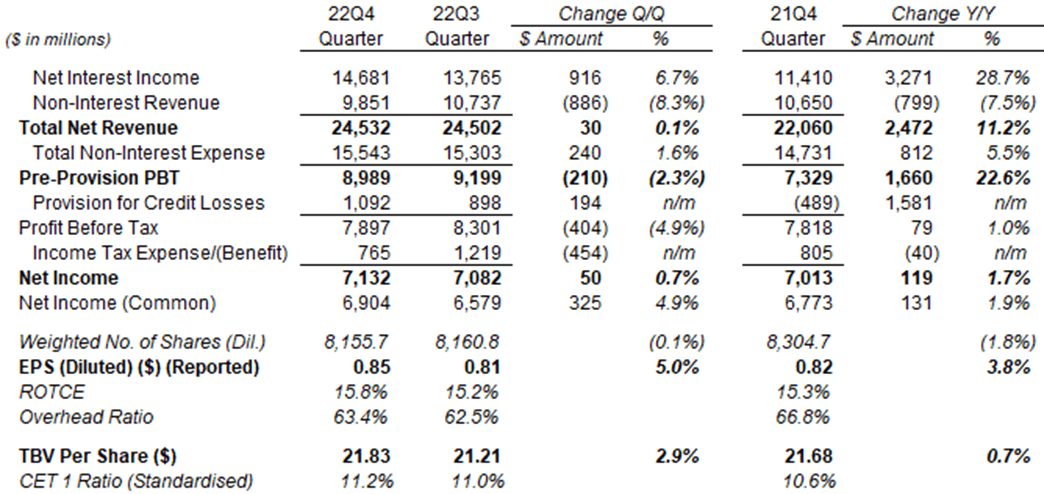 Source: BAC results supplement (Q4 2022). |
On a year-on-year basis, Total Net Revenue grew 11.2%, with a 28.7% growth in NII more than offsetting a 7.5% decline in NIR. Expenses rose just 5.5%, and the Overhead Ratio improved 3.4 ppt year-on-year. Pre-Provision Profit Before Tax (“PBT”) grew 22.6%. Credit provisions were $1.09bn, compared to a prior-year benefit of $489m, which meant Net Income grew just 1.7% year-on-year. EPS growth was 3.8%, helped by share buybacks.
The year-on-year decline in NIR is not a concern. The $799m decline could be primarily due to a $1.24bn reduction in Investment Banking (“IB”) fees, offset by stronger revenues in Sales & Trading (especially FICC) and other businesses; another $335m of the decline was due to BAC voluntarily reducing overdraft and non-sufficient funds fees in May 2022. The reduction in IB fees was market-wide and the result of poor investor confidence in Q4; in market share, BAC was actually ranked #3 in global IB fees wallet share in 2022, higher than the year before.
Sequentially, Total Net Revenue was roughly flat, with a 6.7% growth in NII and an 8.3% decline in NIR roughly offsetting each other. Expenses grew just 1.6% but still more than revenues, which meant Pre-Provision PBT fell 2.3% from Q3. Credit provisions were also $194m higher in Q4, but the effective tax rate was much lower (benefiting from ESG tax credits “and certain discrete tax benefits”), so Net Income was 0.7% higher sequentially. Preferred stock dividends were seasonally lower, so Net Income to Common Shareholders and EPS were both about 5% higher than in Q3.
The sequential decline in BAC’s Pre-Provision PBT is likely inconsequential, as it has been volatile in past quarters. The overall trend is still one of growth since a trough in Q3 2020:
|
BAC Earnings, Provisions & Pre-Tax Profit by Quarter (Since Q4 2019) 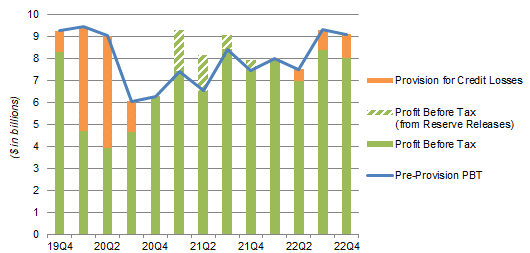 Source: BAC results supplements. NB. Figures on managed basis. |
BAC’s Q4 2022 represented a weaker quarter than JPM, which saw Pre-Provision PBT grew 32.8% year-on-year and 15.6% respectively, mostly driven by much stronger NII growth (48.2% year-on-year and 15.2% sequentially).
BAC 2022 Results Headlines
For full-year 2022, BAC achieved a ROTCE of 15.2% in what was also a mixed year, again with higher interest rates, lower corporate and capital markets activity and higher credit provisions:
|
BAC Results Headlines (Reported Basis) (2022 vs. Prior Years) 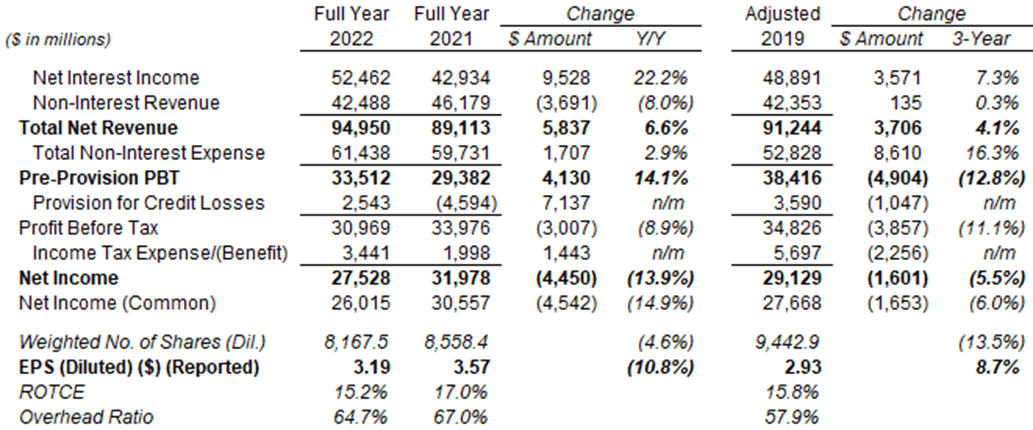 Source: BAC results supplements. NB. 2019 figures adjusted to exclude $2.072bn First Data JV impairment. |
Compared to 2019, this year BAC has a 7.3% higher NII, a similar NIR but 16% higher expenses. This meant 2022’s Overhead Ratio was 6.8 ppt worse than in 2019 and Pre-Provision PBT was 12.8% lower. Full-year credit provisions of $2.5bn were about $1bn lower than in 2019, due to Net Charge-Offs (“NCOs”) being $1.5bn lower, though reserves builds are likely not comparable due to the introduction of Current Expected Credit Losses (“CECL”) accounting standards at the start of 2020.
Q4 Had Loan Growth & Charge-Offs
BAC’s loan growth and NCOs were sequentially worse in Q4, but due to seasonal and unusual factors.
Average Total Loans & Leases in Q4 grew 10% year-on-year but just 0.5% ($4.9bn) from Q3, largely driven by a $4.5bn increase in Consumer Credit Card:
|
BAC Average Total Loans & Leases (Last 5 Quarters) 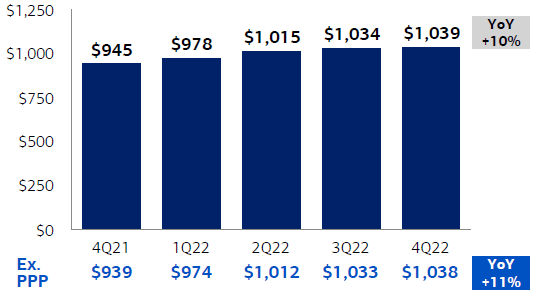 Source: BAC results presentation (Q4 2022). NB. PPP = Paycheck Protection Program. |
However, the weak sequential growth in average loan balances may be seasonal, as it was similarly low at 1.0% in Q4 2019 and 0.4% in Q4 2018. On period-end balances, Total Loans & Leases grew 1.3% in Q4 2022.
Net Charge-Offs in Q4 were similar to the two preceding quarters in Consumer but jumped to $158m in Commercial:
|
BAC Net Charge-Offs (Last 5 Quarters) 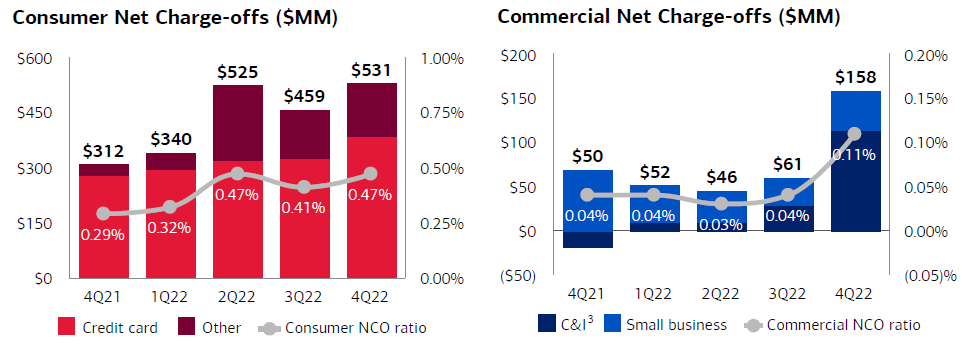 Source: BAC results presentation (Q4 2022). |
CFO Alastair Borthwick described the increase in Commercial CIO to three older deals on the earnings call:
“This quarter was a little unusual. We had three deals that we ended up having to charge off. Not correlated in any way. They’re in totally different businesses, and they’ve been hanging around for a while. But it was — two of them are fully reserved. So, they didn’t come as a surprise”
Similarly, there was a $1.6bn sequential increase in Commercial Criticized Exposure, mainly driven by Commercial Real Estate and of which $1bn was in Office, which management attributed to the downgrades that mathematically followed higher interest rate assumptions leading to lower interest coverage in their models:
|
BAC Commercial Criticized Exposure (Last 5 Quarters) 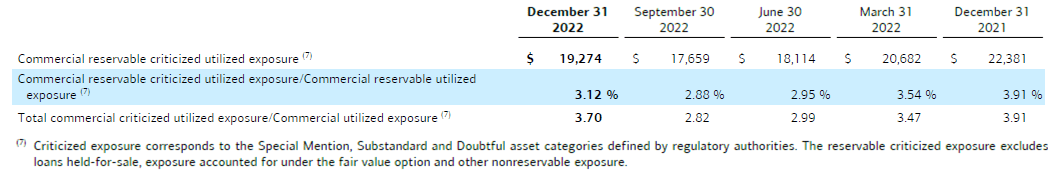 Source: BAC results supplement (Q4 2022). |
Borthwick stated that loans on Office properties account for $14-15bn in BAC’s loan book, were originated “generally at 55% LTV” (Loan-to-Value) and were 75% Class A properties. We believe any losses there would be manageable relative to BAC’s earnings power (with Pre-Provision PBT of $33.5bn in 2022).
Positive Comment on 2023 NII and Expenses
Management comments on 2023 imply that NII will grow another 10% and the Overhead Ratio will improve again.
CFO Alastair Borthwick indicate on the call that NII will likely plateau at around $14.4bn per quarter in 2023, though BAC is not giving specific guidance beyond Q1:
“Starting with the fourth quarter NII of $14.8bn, and assuming a decline of roughly $300m of Global Markets NII in Q1, which would be similar to the fourth quarter decline, that would get us to a Q1 number around $14.5bn. In addition, we have to factor in two less days of interest, which is about $250m. So, that would lower our starting point to $14.25bn. We believe the core banking book will continue to show the benefit of rates and other elements and can offset most of the day count. So, we’re expecting Q1 NII to be somewhere around $14.4 billion. Beyond Q1, with increases in rates slowing and if balances continue their recent stabilization trends expect less variability in NII for the balance of 2023.”
Management expects loan growth to be mid-single-digits in 2023.
The reduction in Global Markets NII is revenue-neutral, as they represent higher funding costs for that business’s inventory (following rate rises) that are passed on to customers and recorded as market-making revenues in NIR.
In any case, even on the NII figure alone, a $14.4bn run-rate implies a full-year total of $57.6bn, close to 10% higher than the 2022 total of $52.5bn.
Borthwick also indicated that the Overhead Ratio will improve to 62.5%, in line with average analyst estimates.
BAC Now Reserved for Mild Recession
BAC credit allowances already assume a mild recession in 2023, so reserve builds are likely to be limited next year.
Credit reserves are now based on a “mild recession” base case and management has further added a “downside scenario” which includes “a rapid rise in unemployment to peak at 5.5% early this year in 2023 and remain at 5% or above all the way through the end of 2024”.
During 2022, BAC moved from $0.4bn of reserve release in Q1, to no change in Q2 and $0.4bn of reserve build in each of Q3 and Q4. At year-end, BAC’s total credit allowances stood at $14.2bn, or 1.22% of total Loans & Leases, compared to a peak of $21.1bn and 1.96% at Q2 2020 during the COVID-19 pandemic:
|
Credit Allowances & Reserve Ratios – BAC vs. JPM 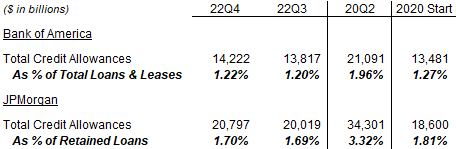 Source: Company filings. NB. JPM 2020 year-start figures are post-CECL; ratio is estimated. |
While the Q2 2020 figures are also theoretical, we believe they are a good proxy of what a bad recession would look like. As show above BAC remained profitable every quarter through 2020, and would need to reserve only about $8.6bn to reach the same reserve ratio at Q2 2020 – easily manageable relative to 2022 Pre-Provision PBT of $33.5bn.
BAC’s reserves, as a percentage of loans and leases, were slightly (5 bps) lower than at the start of 2020; in this it is similar to JPM, whose reserves are also 11 bps lower as a percentage of retained loans than at the start of 2020.
We believe that BAC (like JPM) will likely remain profitable every year even in the event of a bad recession.
BAC Buybacks Accelerating Again
BAC’s share buybacks have started to reaccelerate during Q4, after it exceeded its CET1 (Common Equity Tier-1) ratio target of 11% (compared to a regulatory minimum of 10.4% since October) to reach 11.2%. Share buybacks rose to $1bn in Q4, compared to $450m in Q3.
The next CET1 target is to reach 11.5% by the start of 2024 (compared to a regulatory minimum of 10.9%). BAC should be able to reach this while still continuing dividends and buybacks, having generated 43 bps of CET1 capital in Q4 and only using 11 bps and 6 bps for dividends and buybacks respectively.
Comparison with JPMorgan
BAC’s ROTCE continues to be lower than JPM’s, even more than in pre-COVID 2019, though not as much as during 2020 when JPM benefited much more from record investment banking revenues:
|
ROTCE By Quarter – BAC vs. JPM (Since Q4 2018) 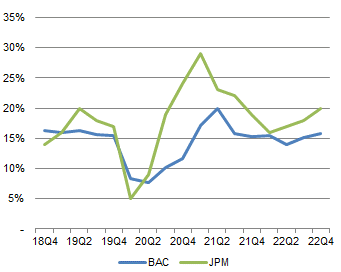 Source: Company filings. NB. BAC Q3 2019 ROTCE excludes First Data JV impairment. |
As of Q4 2022, BAC has benefited less from higher rates than JPM, with its Net Interest Yield rising much less both year-on-year and when compared to Q4 2019 (especially if we look at Net Interest Yield Excluding Markets):
|
NII, Assets & Interest Rates – BAC vs. JPM (Q4 2022 vs. Prior Years) 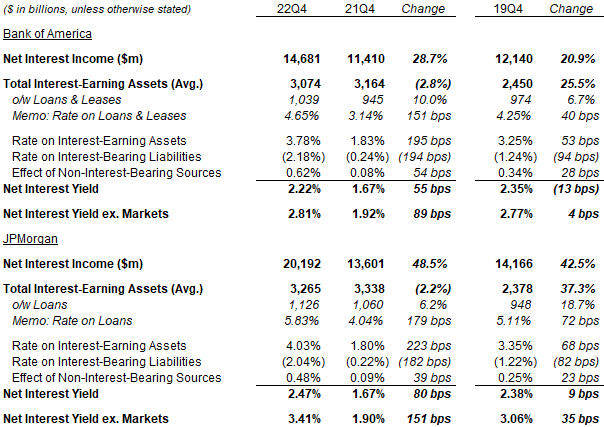 Source: Company filings. NB. BAC Q3 2019 ROTCE excludes First Data JV impairment. |
While both banks have seen similar changes from the average rates on liabilities (once non-interest-bearing sources are included), JPM has gained much more on the average rate on interest-earning assets, helped by a much larger increase in the average rate it receives on loans.
Nonetheless, we believe BAC stock’s lower valuation already reflects this and is still the more attractive stock.
BAC Stock Key Metrics
At $35.23, BAC stock is trading at 1.61x its Q4 2022 TBV of $21.83. Relative to our assumed long-term ROTCE of 15%, this implies a normalized P/E of 10.8x.
This is much cheaper than JPM stock, which is trading at a 1.96x P/TBV and a 12.6x normalized P/E (based on a long-term ROTCE of 15.5%; it is 11.5x based on management’s target ROTCE of 17%).
Relative to history, BAC shares are on 9.9x 2019 EPS and 11.0x 2022 EPS (adjusted for subsequent buybacks).
BAC stock pays a dividend of $0.22 per quarter, or $0.88 annualized, representing a Dividend Yield of 2.5%. Management targets a Payout Ratio of around 30%, and the dividend was raised by 5% (from $0.21) in July.
BAC Stock Forecasts
We update the 2022 numbers in our forecasts, but keep other assumptions mostly unchanged:
- ROTCE to be 15.0% for all years
- From 2023, Net Income to be 15% retained for growth, 30% paid out as dividends and 55% on buybacks
- Buybacks to be carried out at a P/TBV of 1.9x (was 1.7x)
- 2025 year-end P/E of 13.5x
Our new 2025 EPS forecast of $3.97 is 9% lower than before ($4.17):
|
Illustrative BAC Return Forecasts 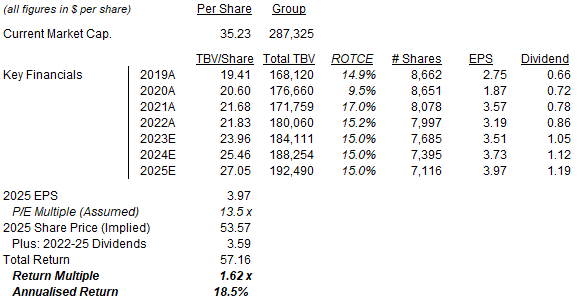 Source: Librarian Capital estimates. |
With shares at $35.23, we expect an exit price of $54 and a total return of 62% (18.5% annualized) by the end of 2025.
Most of the upside is expected to come from an upward re-rating in BAC’s P/E, but the Dividend Yield (currently 2.5% and growing) and the forecasted 6% EPS CAGR during 2022-25 alone should give a high-single-digit annualized return.
Is BAC Stock A Buy, Sell, or Hold?
We reiterate our Buy rating on Bank of America Corporation stock.
Disclosure: I/we have a beneficial long position in the shares of BAC either through stock ownership, options, or other derivatives. I wrote this article myself, and it expresses my own opinions. I am not receiving compensation for it (other than from Seeking Alpha). I have no business relationship with any company whose stock is mentioned in this article.