Summary:
- Walmart is an excellent situational stock to hold during market uncertainty because of its very reliable cash flows.
- Walmart has significantly out-performed the S&P500 index over the last year but longer term the stock has marginally under-performed the market.
- Management has been “cleaning house” over the last couple of years as it has sold off poorly performing international investments.
- At the current price I estimate that the stock is fairly priced but for investors who need a place to “hide”, Walmart would be high on my list.
jetcityimage/iStock Editorial via Getty Images
Company Description
Walmart (NYSE:WMT) is a global retailer and wholesaler (primarily of grocery and general merchandise items). It also has a significant eCommerce operation. Although predominantly a US company (82% of revenues) it also has operations in Africa, Canada, Central America, Chile, China, India and Mexico.
Since 2020 the company has been shrinking its international presence through the sale of operations in Argentina (November 2020), the United Kingdom (February 2021) and Japan (March 2021). The sales of these businesses generated significant book losses relative to what Walmart had previously paid.
I estimate that Walmart is the largest publicly owned retailer in the world by both market capitalization ($US 395.6B) and annual sales turnover ($600B). Walmart is currently the 11th largest public company in the US by market capitalization.
Walmart is organized into 3 reportable divisions as shown in the following table:
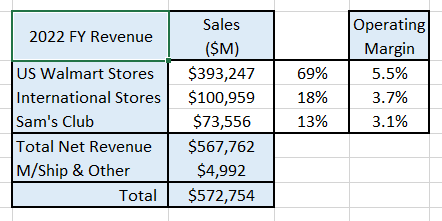
Author’s compilation using data from Walmart’s 10-K filing.
In the US Walmart stores, 56% of the revenues come from the sales of grocery items and 32% from general merchandise items. Similarly for Sam’s Club operations 64% of revenues come from the sales of groceries and consumable items. The high level of grocery item sales in the total mix is what drives the relatively low operating margins.
Business Overview
Walmart commenced operations with its first store in 1945. The company’s customer value proposition has always been based on convenience with a wide variety of products. It was the first retailer to implement the concept of “everyday low pricing”.
Walmart expanded internationally in 1992 with the formation of a joint venture in Mexico (later to become wholly owned). Over the years the company expanded its international footprint through a series of acquisitions (many of which have proven to be poor investments). The company’s international expansion peaked in 2013 and has been in decline ever since (as shown in the following chart):
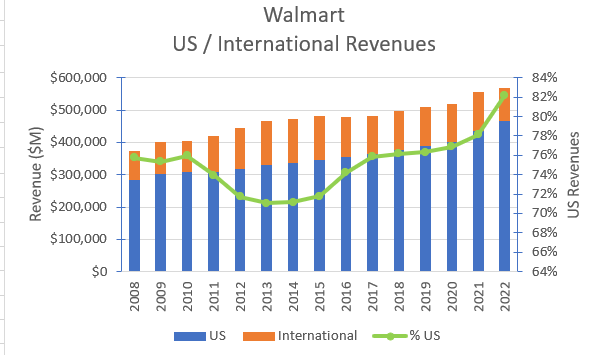
Author’s compilation using data from Walmart’s 10-K filings.
I suspect that Walmart has been exiting relatively low growth / low margin markets (Japan and Europe particularly) where the company was probably struggling to achieve acceptable returns on capital.
Addressable Market
It is difficult to get a single measure of the size of Walmart’s target market because of their focus both on grocery and general merchandise. It is fair to say that both markets are relatively mature.
According to Grand View Research the global food and grocery market at the end of 2021 was valued at $11,324B and is expected to grow at a compound rate of 3% between 2022 and 2030. Their estimate for the US market is very similar as shown in the following chart:
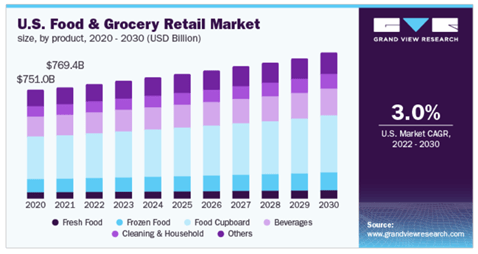
Grand View Research
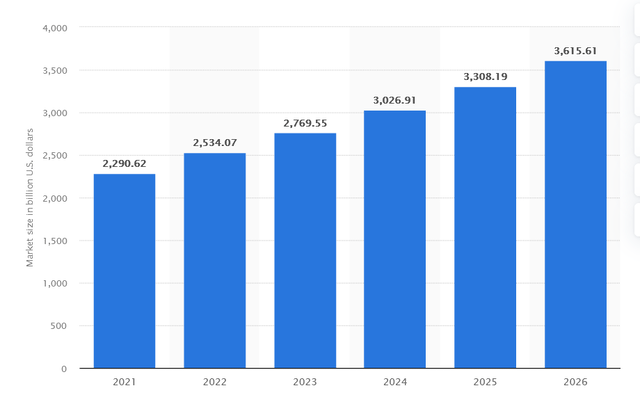
According to Statista the global department and general merchandise store markets are expected to achieve unprecedented levels of growth of around 9.6% per year until 2026 according to the following chart:
Statista
To some degree the future growth expectation is a statistical anomaly heavily influenced by the severe decline in sales caused by the worldwide COVID lockdowns in 2020 / 2021. As a result of the community imposed operating restrictions a large proportion of the general merchandise stores were closed for extended periods of time which has served to lower the base starting level.
For this reason, I think that Statista’s market growth estimate needs to be treated with some caution.
Walmart’s Strategy
Walmart’s current strategy is unsurprising for a mature company. It is focusing on strong, efficient growth opportunities within its existing footprint. The key top-line performance metrics relate to increasing same store and club sales whilst expanding its eCommerce and omni-channel offerings. The remaining elements of the strategy relate to optimizing internal efficiencies in order to reduce costs and maintain relatively high returns on invested capital.
Walmart also claims to benefit from a “flywheel effect” which is depicted in the following schematic:

Walmart Q3 2023 Earnings Presentation.
The schematic is a reasonable attempt to communicate with stakeholders about the company’s strategy and the “flywheel” has become a popular term amongst many companies who have adopted an omni-channel approach to market.
The strategy could be deemed successful if revenue growth exceeds the sector average, margins increase and higher returns on capital are achieved. We will review Walmart’s performance against these metrics in the remainder of the report.
Walmart’s Historical Financial Performance
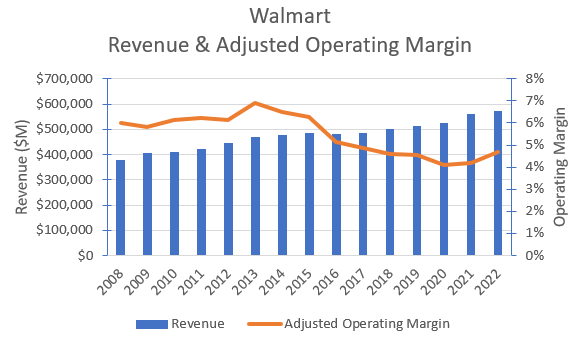
Walmart’s consolidated historical revenues and adjusted operating margins are shown in the chart below:
Author’s compilation using data from Walmart’s 10-K filings.
The chart highlights:
- Revenues have been growing at nearly 5% compounding over the last 10 years (although at a slower rate over the last 5 years due to the impacts of COVID and the sales of several international businesses).
- Operating margins have been in decline for nearly 10 years (although there is some evidence that they may have recently bottomed).
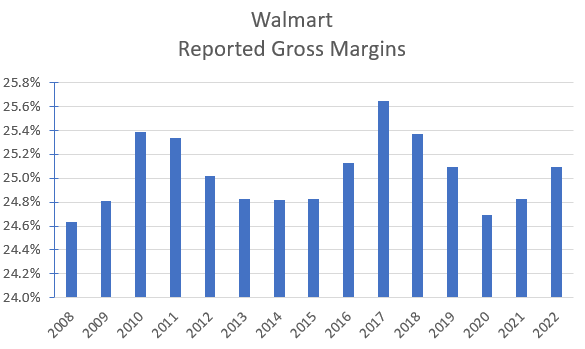
Walmart’s financial data indicates that the company has been very diligent in maintaining its gross margins and the decline in operating margins has been caused by increasing overhead expenses. The gross margin performance is shown in the following chart:
Author’s compilation using data from Walmart’s 10-K filings.
The following chart shows the historical reported margins for Walmart’s operating divisions:

Author’s compilation using data from Walmart’s 10-K filings.
The data shows that operating margins have declined across all divisions (particularly since 2013). The loss of operating margin coincides with the growth in eCommerce. Walmart has experienced above sector volume growth, but this has caused incremental expenses and the loss of productivity which have all contributed to lower operating margins.
My analysis suggests that Walmart’s gross margins and operating margins are slightly above the Sector’s medians (both are around the 55 th to 60 th percentile for the sector).
Walmart’s Moat
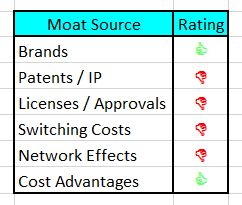
My moat assessment for Walmart is shown in the following table:
Author’s compilation.
The sources of strength in Walmart’s moat come from:
- an excellent brand which is well respected by its customer base.
- the potential cost advantages it gains from its suppliers by virtue of its scale.
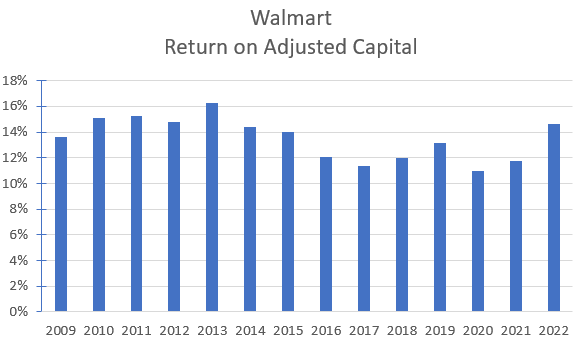
I believe that Walmart’s moat may be relatively narrow and relatively shallow. This is supported by the company’s return on invested capital (ROIC) which is shown in the chart below:
Author’s compilation using data from Walmart’s 10-K filings.
Slight care must be taken in reading this chart. The ROIC has increased recently as a result of the temporary classification to Investments of the international businesses which are being sold. Investments are subtracted from the invested capital base which makes the denominator in the ROIC calculation smaller.
In summary, Walmart’s ROIC has been in decline and like many other of its financial metrics, the ROIC is just slightly higher than the Sector median of 9.4%. As a result, I conclude that Walmart’s moat is rather weak.
Walmart’s Capital Structure
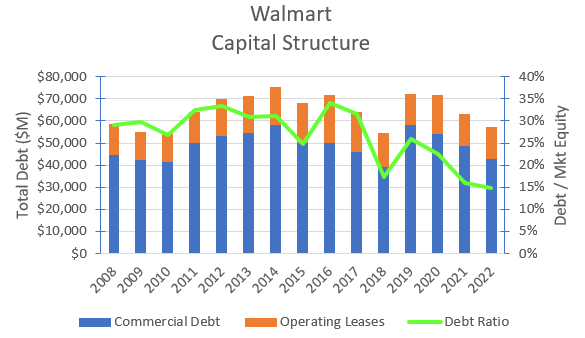
Walmart has been progressively lowering its debt ratio since its peak in 2015. At the end of their last financial year, I estimate that Walmart’s debt ratio was in the sector’s lowest quartile. This is surprising as most major companies strive to maintain many of their balance sheet metrics in line with the sector averages.
Author’s compilation using data from Walmart’s 10-K filings.
I have no concerns about Walmart’s capital structure, and they have sufficient operating cash flows to more than cover their annual interest payments. The balance sheet could easily absorb additional debt to fund a significant acquisition or to increase the level of stock buybacks.
Walmart’s Cash Flows
The following table summarizes Walmart’s cash-flows over the last 10 years:

Author’s compilation using data from Walmart’s 10-K filings.
From the table we can see that Walmart’s operations have generated $162,151 M in free cash flow after reinvestment. They have surprisingly reduced their debt levels by $14,692 M. This means that there was $137,682 M available to return to shareholders. The company paid out $65,909 M in dividends and spent $61,543 M in buying back stock.
Very few large companies return such a high proportion of their free cash flow back in dividends (it is thought to rob the company of flexibility because if the company is forced to lower its dividend rate it is viewed as a bad financial signal to the market). I think the dividend is safe as it is easily covered by the free cash flow. Walmart has increased its dividend every year since 1974 and I can see no reason why this won’t continue for the foreseeable future.
Recent Share Price Action
Yahoo Finance.
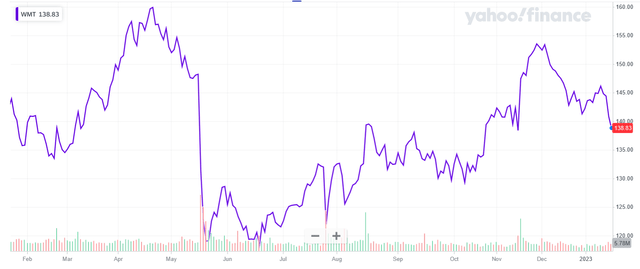
Walmart’s share price has significantly outperformed the S&P500 index over the last 12 months (particularly since August 2022) in a difficult market.
Historical Shareholder Returns

Author’s compilation.
The data indicates that Walmart can out-perform the S&P 500 index during specific periods of the economic cycle (particularly during periods of high volatility) however over the longer-term Walmart has under-performed the index.
Key Risks Facing Walmart
Walmart is a long-established company which has successfully weathered the many changes which have impacted the retail sector over the years. I suspect that in many aspects of its operations Walmart is highly ranked relative to its competitors. I reach this conclusion based on the position of many of its operating metrics relative to the sector’s median levels. However, I am certainly not suggesting that Walmart is best in class.
Walmart has demonstrated that the fundamentals of retailing are well under control. I think that the two key issues for the company into the future will be:
- How does management ensure that front-line staff can provide acceptable customer service at a reasonable cost in order to maintain its share of the traditional retail market?
- How do shareholders guard against management becoming more expansionary into the future and attempting to increase growth via poor acquisition choices?
In much of the western world the changing population demographics means that there are less people over time available to fill many of the entry level jobs within the retail sector (alternatively retailers are having to significantly increase wages in order to fill these roles). Walmart is managing this risk via their omni-channel approach, but I suspect that the pressures associated with this issue will not subside over time.
It appears that Walmart has recently learnt the folly of making poor acquisition choices as they have moved to sell off several poorly performing international businesses. Sadly, the corporate memory of these lessons is often lost as the ranks of management change over time.
My Investment Thesis for Walmart
The current macro consensus is that the US and most of the western world is heading into a recession later this year. The disagreement is about how severe the recession will be.
Based on Walmart’s performance during the 2008 / 09 recession I have not made any adjustments to the near-term revenue and margin trends.
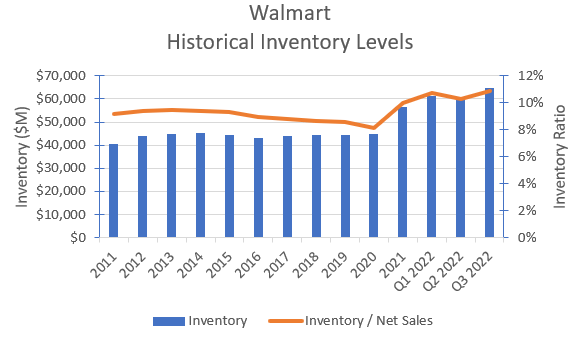
Retailers can often signal a coming recession when their inventory growth begins to outpace sales growth. The following chart shows Walmart’s historical inventory levels:
Author’s compilation
The chart indicates that Walmart’s inventory position started to deteriorate more than a year ago. This was probably caused by the COVID induced supply chain disruptions (particularly the extended lockdowns in China) which has caused many companies to “over-order” to ensure that they had sufficient buffer to be able to continue to service customers in the advent of a supply disruption.
Walmart (and many other retailers) are now also being impacted by a slow-down in net revenue growth. This is making the inventory situation worse and as indicated by the above chart the inventory ratio is now at levels not seen in recent memory.
The concern for investors is that high inventory levels are generally lowered by selling the inventory at a heavy discount. This causes the retailers’ margins to fall sharply in the near term.
My estimate for divisional revenue growth and operating margins for the calendar years 2024 to 2028 are shown in the following table:
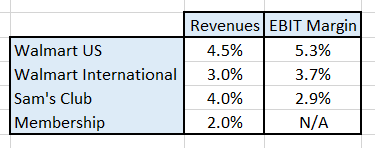
Author’s model assumptions.
Valuation Assumptions
In summary, my forecast scenario for Walmart has the following inputs:
- Consensus revenues for 2022 and 2023.
- Total revenues will then grow at 4.2% ± 0.5% for the period 2024 to 2028.
- Adjusted Operating Margins (which have been adjusted for the impact of operating lease expenses) will be 4.6% ± 0.25% to perpetuity.
- Capital productivity (as represented by Δ Sales / Net Capital) will remain within the current levels 4.0 ± 0.25.
- The current Return on Invested Operating Capital (around 14%) will decline over time before settling at 10% ± 1% in perpetuity which reflects the enduring moat around the business model.
- I have used the Capital Asset Pricing Model (CAPM) to estimate the current cost of capital to be 6.9% and I expect that the mature cost of capital will be 6.75% ± 0.25% (reflecting the low range of risks to cashflows).
- I have assumed a long-term effective tax rate of 25% which reflects the various tax rates in the countries in which Walmart’s operating profits are generated.
- For Walmart’s equity investments I have assumed that the value from the most recent 10-K filing is a market value.
- I have used the diluted share count from the most recent 10-Q as the current share count because insufficient information is provided for me to value the outstanding management options.
- Minority holdings – Walmart provides insufficient information for me to determine a market value of the minority holdings. As a proxy I have used the sector’s median price / book ratio (2.52) to value the minority holdings at $19,832 M.
- Opioids Litigation Settlement – during the 3rd quarter of their 2023 financial year Walmart made a provision of $3,300 M for the settlement of the opioid litigation. I have deducted this amount from the value of the company.
Discounted Cash Flow Valuation
The output from the DCF model is in USD:
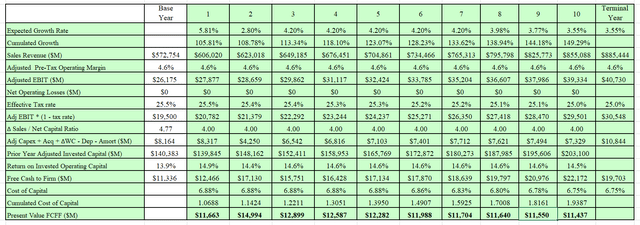
Author’s model.
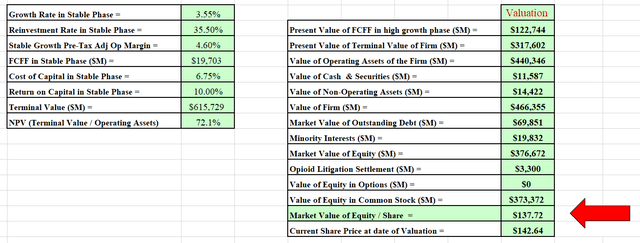
Author’s model.
The model estimates Walmart’s Enterprise Value is $466,355 M and the Equity Value is $373,372 M.
This equates to a mid-point value per share of around $138.
I have also developed a Monte Carlo simulation for the valuation based on the range of inputs for the valuation. The output of the simulation is developed after 100,000 iterations.
The Monte Carlo simulation can be used to help us to understand the major sources of sensitivity in the valuation.
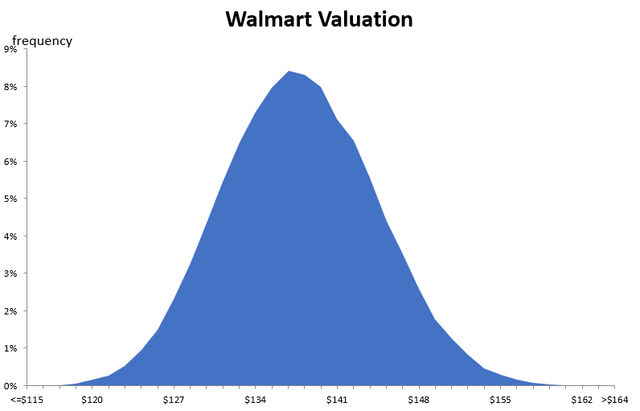
Author’s model.
The simulation informs us that the valuation is most sensitive to the cost of capital and any changes to the long-term operating margin.
The simulation indicates that at a discount rate of 6.75% – the valuation for Walmart’s is between $115 and $154 per share with a typical value around $138.
This would indicate that Walmart is currently fairly priced relative to its intrinsic value.
Final Recommendation
For each company that I value I also assess what role this company could potentially play in my portfolio. The cornerstone of my portfolio is what I term “Tier 1” companies. These are the companies that I hold for the long term and where I invest most of my cash.
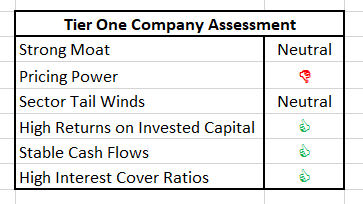
My high-level assessment for Walmart is:
Author’s model.
Although Walmart does not tick every box it is an excellent retailer. Walmart’s stable cash flows are very attractive during times of economic uncertainty (such as now). At the right price and at the right part of the economic cycle Walmart would be an excellent addition to anyone’s portfolio.
The US economy has entered a period of tightening monetary policy (interest rates have been rising) and inflation is moderating (it would appear that inflation may have peaked). Historically this has been a very risky environment for the stock market. Many investors (me included) have been trimming their equity holdings in anticipation of a future market correction.
There are some investors (who by mandate) must be fully invested. Many of these investors have been shuffling their holdings into more defensive stocks (where cash flows are more stable and reliable) and for these investors Walmart’s is very appealing. This probably accounts for why Walmart has significantly outperformed the broader market for the last year.
For existing owners of Walmart I think that the stock is currently a HOLD. I would be very comfortable buying the stock on any significant pullback below $130 but care must be taken with the entry price. A review of the long-term price chart indicates that we are closer to the top of Walmart’s trading range than the bottom.
Disclosure: I/we have no stock, option or similar derivative position in any of the companies mentioned, but may initiate a beneficial Long position through a purchase of the stock, or the purchase of call options or similar derivatives in WMT over the next 72 hours. I wrote this article myself, and it expresses my own opinions. I am not receiving compensation for it (other than from Seeking Alpha). I have no business relationship with any company whose stock is mentioned in this article.
