Summary:
- Exxon Mobil Corporation’s revenue is heavily influenced by the prices of Brent crude oil, WTI crude oil, and natural gas.
- A multiple linear regression model was used to estimate the company’s revenue for Q1 2023 based on the EIA’s short-term outlook for commodity prices.
- The regression model, with its high degree of predictability, offers valuable insights into Exxon Mobil’s revenue, making it a reliable tool for assessing the company’s performance and potential.
- Investors who are bullish on the oil and natural gas markets should consider securing positions in Exxon Mobil at the current market prices, as this is an attractive investment opportunity.
JHVEPhoto
Investment Thesis
Exxon Mobil Corporation (NYSE:XOM) is a massive global energy company with a rich history in the oil and gas industry. The company’s revenue is heavily influenced by several key factors, including the average price of Brent crude oil, West Texas Intermediate (WTI) crude oil, and natural gas. In this article, we will examine these three factors and how they impact XOM’s revenue. We will employ a regression model to predict the company’s future revenue prospects based on changes in the prices of these three commodities.
The purpose of this analysis is to provide valuable insights for investors and financial analysts evaluating the performance and potential of Exxon Mobil. The analysis also highlights the importance of each independent variable in explaining Exxon’s revenue, allowing us to make informed decisions about the company’s future. Our analysis suggests that investors who anticipate an increase in oil and gas prices in the future should consider securing a position in the company now.
Oil and Gas: Key Components in Exxon’s 2050 Energy Mix
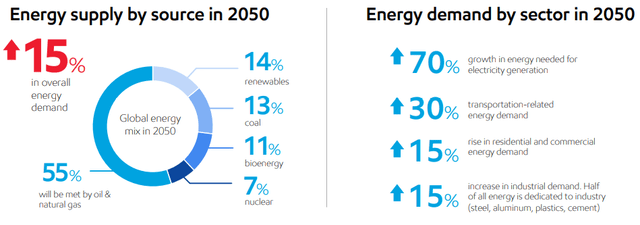
Exxon Mobil released its energy outlook last October, predicting that the world will consume 15% more energy in 2050 than it does today. The outlook projects that developing countries, which represent 80% of the world’s population, will use more energy as they aim to achieve better living standards. Many of these countries will have access to reliable, affordable energy for the first time.
According to the outlook, all energy sources will remain necessary through 2050, even in scenarios where the world aims for net-zero emissions. Exxon Mobil projects that oil and natural gas will still account for 55% of the world’s energy mix in 2050, with renewables mostly replacing coal. The outlook also projects a rise in natural gas demand, primarily to meet the increasing need for electricity and low-emission industrial heat.
Exxon Energy Outlook (Exxon Mobil 2022 Outlook File)
On the other hand, in the latest earnings call, Exxon Mobil CEO Darren Woods acknowledged that the competitive environment in the upstream oil industry is far different than in the past, with fewer players in the industry and many of their largest peers strategically underinvesting in oil. Woods believes that this underinvestment tightens the supply of capacity and tightens the markets. However, Woods also believes that their company has a competitive advantage in the industry due to their continued commitment to strengthening their capabilities in bringing on competitively sourced oil and gas in an environmentally responsible way.
Exxon’s Revenue Dynamics: A Regression Analysis of Key Predictors
In this analysis, we will use regression analysis to predict the revenue of Exxon Mobil Corporation based on the average prices of Brent crude oil, WTI crude oil, and natural gas. This regression model takes the form of a multiple linear regression, with revenue being the dependent variable and the average prices of the three commodities serving as independent variables. The coefficients of the regression equation provide an estimate of the impact on the firm’s revenue of a unit change in each of the independent variables, holding all other variables constant. Here’s the output of our model:
Quarterly Revenue = 11,978.96 +
This regression was developed using 44 quarters of data and will provide valuable insights into the company’s revenue performance and help us make informed decisions about Exxon Mobil’s future revenue based on changes in the prices of these commodities. The following regression statistics serve as a measure of the fit of the model and evaluate its quality.
| Regression Statistics | |
| R Square | 0.9686 |
| Adjusted R Square | 0.9662 |
| Standard Error | 3,912.06 |
| Observations | 44 |
- The R-square metric measures the proportion of the variation in Exxon Mobil’s revenue that can be explained by the average price of Brent crude oil, WTI crude oil, and natural gas. As such, 96.86% of the variation in revenue can be explained by the average price of the three commodities.
- The adjusted R-square takes into account the number of independent variables in the model and provides a more conservative estimate of the goodness of fit. The adjusted R-square of 0.9662 further confirms that the regression model provides a good fit for the data.
-
The standard error measures the variability of the residuals, or the differences between the actual and predicted values. The value of 3,912.06 is relatively small compared to the revenue values, suggesting that the model has a good fit.
Exxon Mobil Q1 2023 Revenue Projection
In this section, we will project the revenue of Exxon Mobil for the first quarter of 2023 using the multiple linear regression model that we developed earlier.
According to the U.S. Energy Information Administration (EIA), the Brent crude oil price is forecasted to have an average price of $83/b in 1Q23 due to the ongoing EU ban on petroleum imports from Russia. The WTI price is expected to average $77/b in 2023, while natural gas prices are expected to average $4.9/MMBtu. Accordingly, the estimated revenue for 1Q-2023 is $83,036.5 million.
EIA Short-Term Energy Outlook, January 2023 (U.S. Energy Information Administration)
Valuation
To estimate the overall value of Exxon, we will use three valuation methods: EV/Revenue, Price-to-Sales and Price-to-Earnings.
EV/Revenue
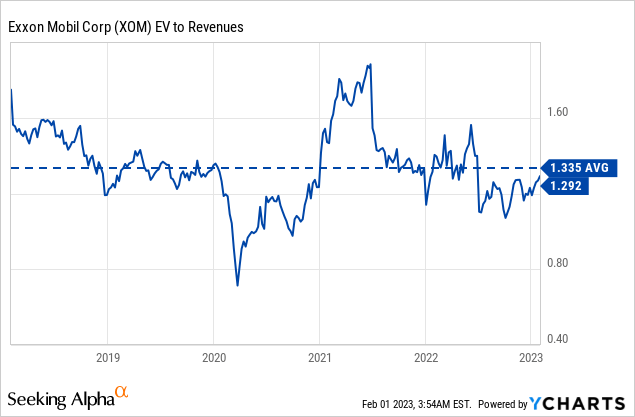
According to our projection, the twelve-month trailing revenue of Exxon Mobil by the end of the first quarter is expected to be $397,011 million. By applying the average EV/Revenue ratio of the firm over the past five years (1.335), we arrive at an estimated Enterprise Value of $530,010 million.

In order to determine the fair equity value, we will need to subtract the company’s debt and minority interest and add its cash position. As such, the fair value is estimated at $511,667 million, which is equivalent to a per-share value of $123.65.
Price Multiples
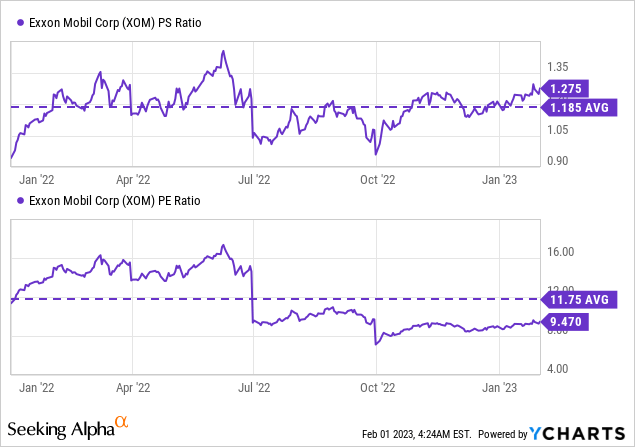
To determine the fair value using the P/E ratio, we’ll be using the average net margin of the company from the last eight quarters (10.73%) and the average P/E ratio at which the firm has been trading in the past year (11.75x). Based on these calculations, the estimated fair value per share is $120.96.
As for the Price-to-Sales ratio, we’ll be multiplying the company’s projected TTM revenue by the average P/S ratio for the same period (1.185x). This results in an estimated fair value of $113.7 per share.

The average fair value per share of Exxon Mobil based on the average of the three models is $119.44.
Model and Valuation Risks
While a regression model can provide valuable insights into the relationships between different variables and the revenue of a company like Exxon Mobil, it is important to be aware of the limitations and risks of such a model and to make decisions based on a thorough understanding of the market and the company. Accordingly, there are several risks to consider:
- First, the model is only as accurate as the data inputs. The average prices of Brent, WTI, and natural gas used in the model may not accurately reflect future market conditions. Additionally, other factors not included in the model, such as geopolitical events or changes in supply and demand, could significantly impact the price of these commodities and affect Exxon’s revenue.
- Second, the model assumes a linear relationship between the independent variables and the dependent variable, which may not hold in all cases.
- Third, the model assumes that the relationships between the independent variables and the dependent variable are constant over time. However, these relationships may change over time due to changes in market conditions, company strategies, or other factors.
- Finally, it’s important to consider that the model is based on historical data, and past performance is not a guarantee of future results. There is always a degree of uncertainty when making predictions about the future, and it is possible that the actual revenue of Exxon could be different from what is predicted by the model.
Additionally, it’s important to note that this valuation did not take into consideration any risks related to Exxon Mobil that may affect its future revenue and performance.
Key Takeaway
In conclusion, Exxon Mobil Corporation is one of the largest integrated energy companies, operating across multiple segments of the energy industry. Our analysis of the company focused on the impact of commodity prices, specifically Brent crude oil, WTI crude oil, and natural gas, on the company’s revenue. We have analyzed the impact of these three variables on the firm’s revenue and came up with a multiple linear regression model to estimate the revenue for the first quarter of 2023 based on the EIA’s short-term outlook for these commodity prices. While the model provides valuable insights, it is important to keep in mind that this regression model is just one piece of the puzzle and that investors should carefully consider all relevant factors before making any investment decisions.
Given the current market conditions, investors who are bullish on the oil and natural gas markets (like me) should consider securing positions in Exxon Mobil Corporation at the current market prices as it is an attractive investment opportunity. On the other hand, those who believe that the EIA’s forecasts are reasonable may find that Exxon Mobil Corporation is fairly valued at current market prices.
Disclosure: I/we have no stock, option or similar derivative position in any of the companies mentioned, but may initiate a beneficial Long position through a purchase of the stock, or the purchase of call options or similar derivatives in XOM over the next 72 hours. I wrote this article myself, and it expresses my own opinions. I am not receiving compensation for it (other than from Seeking Alpha). I have no business relationship with any company whose stock is mentioned in this article.
Additional disclosure: There are risks associated with investing in securities, including loss of principal. As such, before buying or selling any stock, we recommend doing your own research and reach your own conclusion or consulting a financial advisor. The information contained in this article is for informational purposes only.

