Summary:
- While the notion of a metaverse is much maligned, the broad concept represents the future of communication.
- Meta is one of the best positioned to capitalize on a fundamental shift in communication platform technologies, with 3.74 billion users.
- The share price collapse may have been an overreaction or a negative market signal regarding Meta’s growth trajectory.
- Consensus estimates need to increase by 50% just to reach the most bearish analyst estimates as of the March 17, 2022 Meta report.
- The key question is will Meta be a dominant communication platform in the future?

Hammarby Studios
The above image of a telephone booth highlights the essence of Meta Platforms (NASDAQ:META) as a communication services provider. It also gets to the heart of the matter, which is the manner in which we communicate, as well as the platforms we use to communicate, fundamentally change through time.
While the notion of a metaverse is much maligned, I have no doubt that the broad concept represents the future of communication. As to when and how it evolves remains an open question. Given Meta’s massive user base of 3.74 billion people, the company is one of the best positioned to capitalize on a fundamental shift in communication platform technologies.
The key question is will Meta be a dominant communication platform in the future?
Performance Review
At the time of our March 17, 2022 Meta report, “Meta Platforms Is An Asymmetric Innovation Opportunity”, the consensus earnings estimate for 2022 was $12.42 per share and Meta was trading at 15x estimates. As this multiple was quite low in relation to consensus growth estimates, it was clear that the market was pricing in a miss to expectations. The following is how I summarized the situation at the time (emphasis added):
…earnings appear likely to fall in the mid-$8 to high $13 EPS range in 2022. As a result, the low analyst estimate of $10.80 for 2022 appears to be quite likely. This likelihood may be in the process of being priced into Meta’s shares given that they are trading at only 15x the consensus earnings estimate for 2022.
Meta earned $8.59 per share in 2022. While within my estimated range, it was at the bottom and 20% below the lowest analyst estimate at the time. Though within the realm of possibilities, the earnings miss was quite large at -30% to consensus.
The market’s extreme negative reaction to the earnings miss was the biggest surprise, as Meta’s share price decline was outside the low end of my estimated risk/reward spectrum in March 2022.
Surprise
Meta bottomed at $88 on November 11, 2022 at 10x 2022 reported earnings, 56% below the price as of the March 2022 report. On December 2, 2022, I made the following observation regarding Meta’s sector:
Of note, the sector valuation comparison hints at the multitude of attractive opportunities in the communication services sector.
In early December 2022, trading at 10x earnings compared to Disney at 24x, Meta was one of those opportunities. The depth of Meta’s decline was quite surprising given that -35%, or $129, was the lowest support level identified in the March 2022 report:
I find a test of the -35% price target to be unlikely. Additionally, this was the panic low during the COVID crash which was during an extraordinarily negative economic backdrop.
The surprise decline of 56% to $88 per share may have been the result of a normal market overreaction. It is also possible that the extreme negative reaction was a signal, and that the market sees a fundamental change in Meta’s growth trajectory.
Fundamentals
Consensus estimates for Meta have fundamentally changed since the March 2022 report. The following table compares current earnings estimates to those at the time. I have highlighted in yellow consensus estimates today and the lowest analyst estimates as of March 17, 2022.
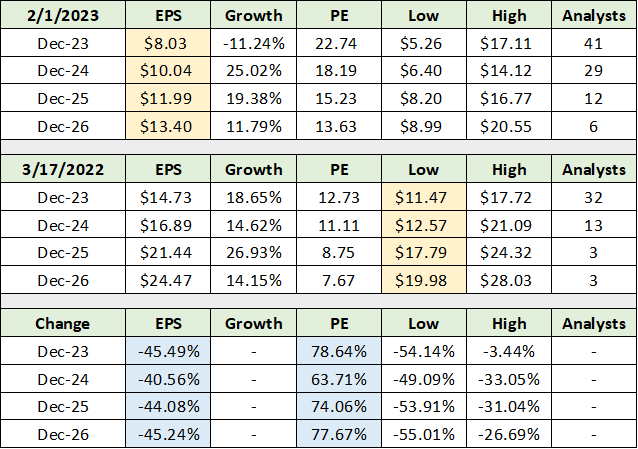
Source: Seeking Alpha. Created by Brian Kapp, stoxdox
The lower section of the table displays the percentage changes in consensus estimates and valuations since March 2022 (highlighted in blue). Earnings estimates have collapsed by approximately 45% across all years while the valuation multiple has grown by 78%. Looking to mid-decade, consensus estimates need to increase by 50% just to reach the most bearish analyst estimates as of March 17, 2022.
Given the uniformity of consensus EPS estimate reductions between -40% to -45% for each year, it is likely that estimates are now too bearish into the mid-decade time frame. The following table displays the same comparison as above using consensus sales estimates.
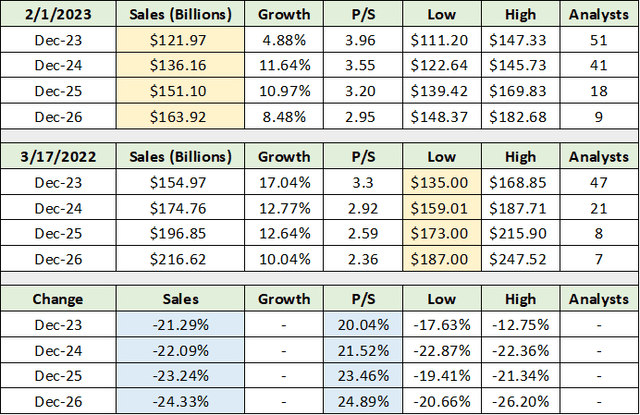
Source: Seeking Alpha. Created by Brian Kapp, stoxdox
I have highlighted in blue the key percentage changes. Sales estimates have been ratcheted down uniformly through mid-decade, in the -21% to -24% range. Highlighted in yellow, consensus sales estimates are now well below the most bearish estimates as of March 2022.
With respect to both earnings and sales, while consensus estimates may now be too bearish, the growth trajectory has undeniably shifted lower. Growth estimates have collapsed through mid-decade. At the same time, Meta’s valuation has exploded. As a result, the following conclusion from the March 2022 report is now called into question (emphasis added):
The strong technical backdrop combined with Meta’s deeply discounted valuation and superior growth prospects creates an asymmetric risk/reward opportunity in a blue-chip growth stock.
Primary Concern
Meta’s 23% share price pop in response to its Q4 2022 earnings results announced Monday highlights the primary concern surrounding the Meta investment case. The positive response was a reaction to Meta declaring 2023 the year of efficiency (or higher margins), as well as a new $40 billion share repurchase program.
The efficiency announcement is largely a nonevent from my perspective, as there was never any doubt that Meta could expand its margins from recent levels. Its current cost structure reflects an unusually heavy investment cycle as the company ramps up to compete as the future communications platform.
What I do doubt is Meta’s sales growth potential, which is a much larger issue than is its cost structure in the short term. The reason for this is that growth opens the door to asymmetric upside potential, as multiple expansion on growth is a powerful force over time. On the other hand, short-term margin improvement is more of a one-time multiple expansion effect.
As the estimate reductions above attest, Meta has an earnings and sales growth problem. Looking longer term, from a valuation perspective, sales growth is the primary risk.
Share Repurchases
The company announced a $40 billion share buyback program in its Q4 earnings release. This also contributed to the 23% share price pop on Monday. As the valuation is no longer deeply discounted and growth is the primary risk, it is not clear that this is a significant positive development.
It is not material to the Meta investment case because Meta has been buying back its shares for some time, with little to show for it in terms of share count reduction. For example, the company spent $120 billion buying back stock since 2013. Over this time, the share count has grown by 185 million.
The vast majority of Meta’s share repurchases occurred after 2017, accounting for $114 billion of the $120 billion spent. Since 2017, the share count has been reduced by 254 million. This equates to an 8.5% reduction since the end of 2017. From a per share perspective, an 8.5% reduction is immaterial, while $114 billion is a large opportunity cost.
Given the lack of share count reduction from the share repurchases to date, the buybacks have largely functioned as a deferred cash compensation expense. Stock-based compensation is an actual cash expense for Meta. This could change in the future, though there is no evidence to suggest it will. Meta’s share-based compensation expenses of $11 billion in 2022 and $9 billion in 2021 place the $40 billion buyback plan in the proper light.
The Metaverse
In light of the Metaverse, Meta’s Reality Labs division posted a -17% sales decline in Q4 2022. Sales were flat for the full year. The stagnation of Meta’s future growth vehicle may shed light on the company’s return to efficiency and share repurchase program. The competitive field remains wide open as the Metaverse has yet to reach a breakout point along its growth S curve.
Technicals
The deterioration in Meta’s fundamentals is mirrored in its technical backdrop, as can be seen in the 10-year monthly chart below. Key resistance levels are marked by the orange lines and the support levels are represented by the green lines.
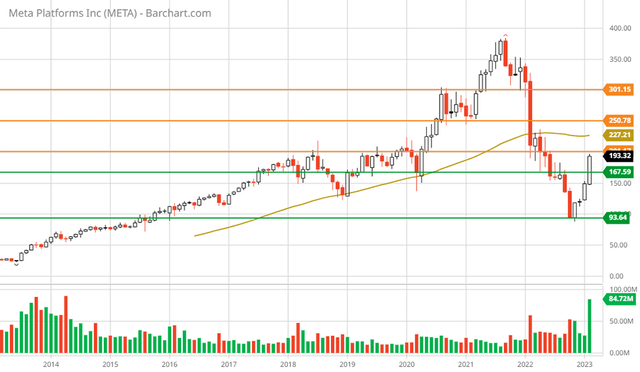
Meta Platforms 10-year monthly chart (Created by Brian Kapp using a chart from Barchart.com)
Meta’s technical deterioration is largely due to breaching the prior lows of 2020 and 2018. The long-term uptrend has been disrupted, technically speaking. The following 5-year weekly chart provides a closer look.
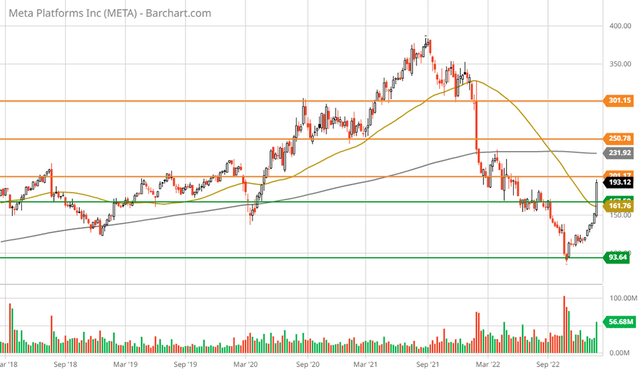
Meta Platforms 5-year weekly chart (Created by Brian Kapp using a chart from Barchart.com)
Meta is entering what should be a heavy resistance zone between $200 and $250 per share (first orange lines). The 200-week moving average (the grey line) is near $230. Given the upward valuation adjustment and greatly reduced growth profile, the $230 to $250 region looks to be a stiff ceiling in the nearer term. As can be seen in the 2-year daily chart below, the $250 level also represents the initial gap lower in early 2022.
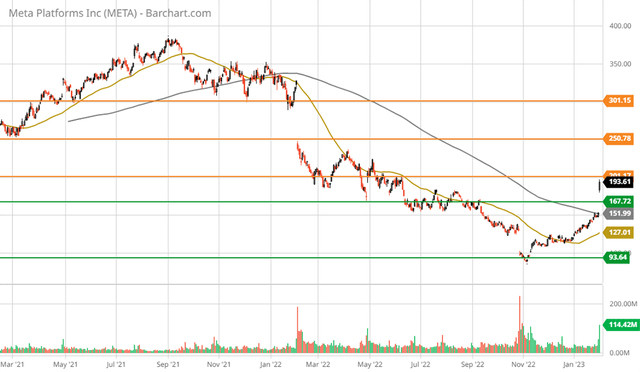
Meta Platforms 2-year daily chart (Created by Brian Kapp using a chart from Barchart.com)
Resistance should be quite heavy, near $250. This level represents technical upside potential of 35%. Nearest support is near the gap higher on the recent earnings report, which is in the area of $150 to $167. The downside to the lower end is -19%. The $150 area is near the 200-day moving average which suggests that the $150 to $167 area is likely to offer strong support.
It should be noted that Meta is overextended in the short term, as the 50-day moving average is near $127 and -32% lower.
Summary
The risk/reward asymmetry has certainly shifted toward neutral since the March 17, 2022 report. Is Meta a maturing ad platform or is it a communication platform operating in the metaverse? That is the question.
Today, Meta is a maturing ad platform that is aggressively investing its $50 billion of operating cash flow into becoming the metaverse communication platform. As the Reality Labs stagnation attests, the growth trajectory of these investments is highly uncertain.
Removing stock-based compensation from operating cash flow produces a modified free cash flow run rate of $30 billion in 2022, which is in line with annual results since 2019. The company’s capex is trending toward the same $30 billion area.
At a $500 billion valuation today, Meta is trading at 17x my modified free cash flow estimate, for a free cash flow yield of 6%. While Meta could certainly trade to the $250 area, the $150 area remains a near-term technical risk following the recent gap higher. Overextension from the 50-day moving average at $127 with flattish sales guidance increases the risk of a lower retest.
The risk/reward spectrum over the nearer term is in balance at -32% to +35%. Longer term, the level of investment the company is undertaking is massive and may offer additional upside. With a global communication platform user base of 3.74 billion people, Meta is well positioned to capture the opportunities of the coming communications transition.
Disclosure: I/we have no stock, option or similar derivative position in any of the companies mentioned, and no plans to initiate any such positions within the next 72 hours. I wrote this article myself, and it expresses my own opinions. I am not receiving compensation for it. I have no business relationship with any company whose stock is mentioned in this article.
To learn more about our research and services, visit the stoxdox Membership page on the SA Marketplace. The stoxdox membership service is designed to empower investors with a continual stream of opportunities by providing the highest quality, unbiased, professional analysis delivered in an actionable format; stoxdox filters the noise.

