Summary:
- Higher interest rates and inflation increase the volatility in the stock price of Bank of America Corporation.
- The recent decline in the share price of BAC during 2022 is generating a strong buying interest at the lower channel line in the support area of $29 based on the similarity.
- A breakout from the descending broadening wedge in BAC.PK and the appearance of an inside week indicate price compression and increase the likelihood of an upside breakout at $25.57.
Justin Sullivan
The Bank of America Corporation (BAC) provides a variety of financial services to individuals, businesses, and institutions. Through a series of mergers and acquisitions, BAC has become a major player in the banking industry with thousands of branches in multiple countries. BAC also issued Bank of America Corporation 5.875 NCM PFD HH (NYSE:BAC.PK), which is preferred stock and represents ownership in the bank. The dividend for BAC.PK is dependent on interest rates and the bank’s financial performance. Due to strong financial performance, BAC has generated substantial revenue over the past few years. The total revenue for 2022 is $92.41 billion, which is very similar to the 2021 levels. From 2013 to 2022, the revenue increased by 10.08%.
The strong financial performance of BAC is also evident in the bank’s dividend history. The dividend has a compound annual growth rate of 10.26%. The financial strength of BAC has a significant effect on the performance of the preferred stock; consequently, the stock prices of BAC and BAC.PK are highly correlated. BAC.PK has a dividend payout of $1.47 per share and appears to be an outstanding investment option in BAC due to fixed dividend payments, which are attractive to investors due to a steady income stream. In addition, preferred stock is the preferable alternative during liquidation or bankruptcy, allowing shareholders to receive dividends and high claims on the bank’s assets.
This article identifies the BAC and BAC.PK stocks as attractive investment opportunities for investors, based on the price compression at the lower trend line and the inverted head-and-shoulders. I think that BAC is emerging from a strong bottom comparable to the bottoms of 2011, 2016, and 2020, and the price is expected to increase in the coming years.
Historical Price Evaluation
Price Behavior Before Great Recession
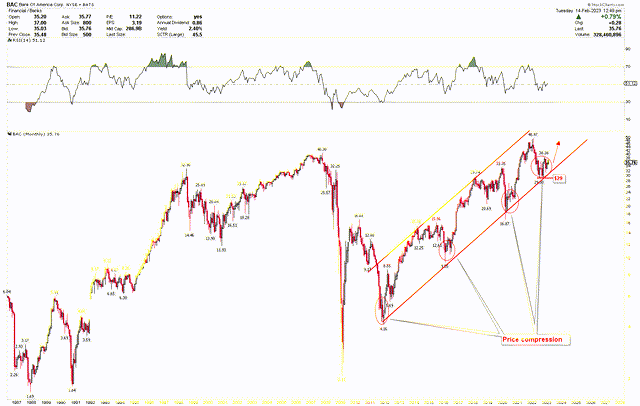
According to the double bottom seen in 1987 and 1990, the monthly chart below exhibits strong price behavior. The low in 1987 was $1.69, while the low in 1990 was $1.87. This double bottom resulted in a strong stock price rebound to mark a high at $40.30 in 2007. However, a massive decline of 94.76% occurred between 2007’s high of $40.30 and 2009’s low of $2.11, due to the occurrence of the great recession in the United States. It took many years for the economy to recover to pre-crisis levels of employment and output after the recession ended in June 2009. The economic recovery was slow due to high household and financial institution debt payments. The high debt resulted in the bursting of the housing bubble and the housing market correction.
After a significant drop to $2.11, the price of BAC rebounded sharply to $16.68 to establish a new high. From 2009 to 2011, the stock price of BAC was highly volatile, but the price is now rising within the red channel lines, from the 2011 low of $4.16 to the 2022 high of $48.97. It is very interesting to observe that when the price reaches the lower channel line, there is a period of consolidation followed by a price advance. This consolidation at the lower channel line indicates that the stock price of BAC tends to compress prior to a run higher. The chart also presents 2011, 2016, and 2020 lows at $4.16, $9.55, and $16.87, respectively.
Monthly Chart for BAC (StockCharts.com)
Price Behavior After Great Recession
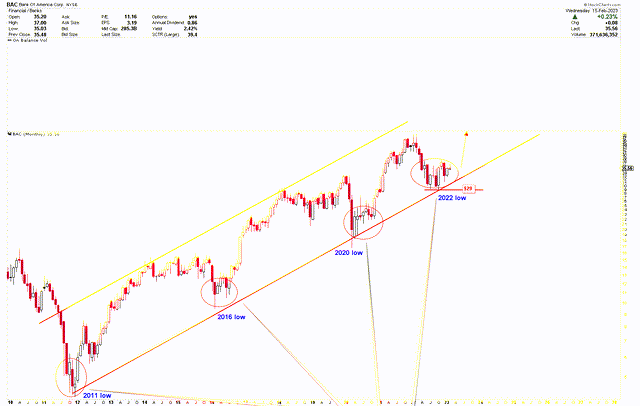
The price increment in 2013 was based on the 2011 low of $4.16 and reaches $15.96 prior to a reversal. This increase was the result of the recovery of the US economy from the global financial crisis. Consumer and investor confidence increased as a result of the improved economic conditions, which had a positive impact on the stock price of BAC. To recover from the 2009 financial crisis, BAC made significant efforts to reduce costs and increase efficiency, which increased the bank’s profitability and stock price. Due to the expansion of the U.S. economy, the price bottomed out again after a significant correction to the lower channel line and climbed from $9.55 to $33.35. Additionally, the Trump administration deregulated the financial sector, which benefited BAC by reducing compliance costs and increasing revenue growth opportunities. BAC’s annual revenue increased by 10.08% as a result of the bank’s cost-cutting initiatives and emphasis on digital banking.
BAC’s stock price peaked at $33.35 in 2020, after which a market correction ensued. Following the market correction, BAC’s share price rose from a 2020 low of $16.87 to an all-time high of $48.97. This increase was due to the number of economic stimulative measures taken by the Federal Reserve in 2020 in response to the Covid-19 crisis. This includes near-zero interest rates and bond purchases to inject liquidity into the market, which helped the BAC stock price. Due to the bank’s strong capital position and risk management practices, which inspired confidence in the ability to manage crises, the BAC stock price also increased. The increase in stock prices was also attributable to decreased expenses and robust earnings in the first half of 2020.
Monthly Chart for BAC (StockCharts.com)
Present Situation & Future Outlook
The price is currently consolidating in wide ranges at the lower channel line above the $29 region, indicating compression. This pattern is similar to the patterns of 2011, 2016, and 2020. If the BAC stock price confirms the bottom, the price is likely to increase. The inflation in the United States broke a 40-year record and the Federal Reserve is increasing the interest rates to fight the inflationary environment. Currently, the Federal Reserve has increased the interest rates above 4% but the Consumer Price Index (CPI) remains at 6.4%. According to the previous article, the weekly chart for BAC shows that the price has emerged with an inverted head and shoulder pattern and is likely to break higher. Price has already hit $38, the neckline of the inverted head and shoulder, and is currently deciding whether to break out. A break above $38 will confirm the bottom at the red channel support line and signal the beginning of the next bull run higher. Based on the monthly chart above, the RSI is also attempting to close above the midpoint, indicating that the price is currently at a significant level of breakout.
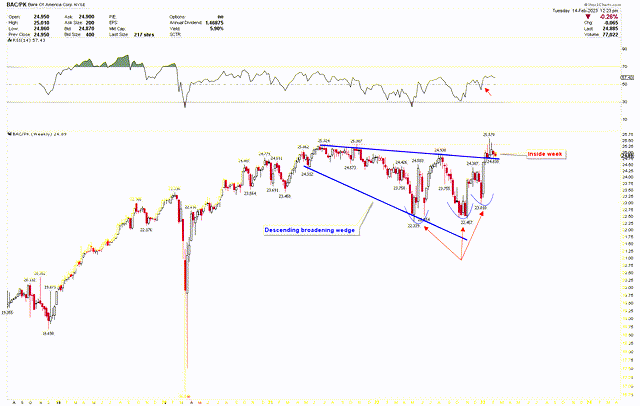
The weekly chart below shows the strongly bullish structure for BAC.PK. The chart presents the emergence of a descending broadening wedge from May 2021 to December 2022. The appearance of a descending broadening wedge indicates that bears are losing ground and bulls are gaining traction. The chart shows that an inverted head and shoulders pattern emerged, with the left shoulder forming a double bottom. The pattern was broken on January 1st, with a strong bullish move above the wedge’s upper trend line. After the breakout, the price consolidates between $24.83 and $25.57 and produced an inside-week candle. The inside candle forms when the price of the weekly candle consolidates within the previous candle’s high-to-low range. This indicates a significant price compression and breakout. A price consolidation following a breakout from the descending broadening wedge suggests more upside. The RSI is also trading above 50, indicating the possibility of an upside breakout in the instrument.
BAC.PK weekly outlook (StockCharts.com)
Market Risk
Despite strong financial performance and supportive technical formations, BAC faces risk as the Federal Reserve raises interest rates. Inflation remains high, and the Federal Reserve may raise interest rates in the long run, which will have a significant impact on market volatility. High inflation and interest rates have a negative impact on the economy because the cost of borrowing money increases, making it more difficult for consumers to finance large purchases such as homes and cars. This activity slows down economic growth. Higher interest rates also make borrowing money for business expansions more expensive, contributing to an economic slowdown. On the other hand, the price is consolidating at the support line, but a break below $29 raises the risk of a further downside because the price will break out of the channel. The descending broadening wedge has been broken by BAC.PK, indicating strongly bullish price action and higher prices. A break below the right shoulder of the inverted head and shoulders at $23.01, on the other hand, will negate the bullish outlook and lead to further downside.
Conclusion
Based on the above, it is clear that BAC generates significant revenue and pays a high dividend to shareholders. The BAC share price is currently exhibiting the same type of price compression seen prior to the rallies of 2013, 2017, and 2021. History repeats in the stock market due to human behavior, market psychology, and economic cycles. The long-term price trend remains upward, and prices tend to consolidate in broad ranges before a run higher. The economic conditions in 2023 are different as compared to 2009, but the possibility of a recession in 2023 increases the volatility in the stock market. The BAC stock price has a boundary of $38, and if this level is breached, the price will have a greater chance of increasing. A break below $29, on the other hand, will negate the bullish outlook. BAC.PK is a good investment opportunity, due to a fixed dividend and strong technical breakout. A technical breakout from a descending broadening wedge and the appearance of an inside candle indicates that any move above $25.57 in BAC.PK will emerge with a strong bullish price behavior. Investors can consider BAC.PK as a strong opportunity to add to portfolios in order to generate consistent income.
Editor’s Note: This article discusses one or more securities that do not trade on a major U.S. exchange. Please be aware of the risks associated with these stocks.
Disclosure: I/we have no stock, option or similar derivative position in any of the companies mentioned, and no plans to initiate any such positions within the next 72 hours. I wrote this article myself, and it expresses my own opinions. I am not receiving compensation for it (other than from Seeking Alpha). I have no business relationship with any company whose stock is mentioned in this article.
