Summary:
- We briefly discuss the importance of capital allocation decisions by executive officers.
- We take a close look at 3M’s capital allocations over the past 10 years.
- We highlight those that we believe have made sense for long-term shareholders, versus those that are more questionable.
- Our review is rather mixed overall, and investors are justified in keeping a close eye on how the company allocates excess cash going forward.
josefkubes
The importance of capital allocation
A corporate management team is responsible for ensuring the long-term success of a company on behalf of its shareholders. To this end, much of their attention is focused on the more apparent aspects of operating a business: customer relationships, competitive rivalry, operational efficiency, human resources, marketing, R&D, supply chains, etc. Yet, there is another important area that deserves considerable management attention: capital allocation. Determining what to do with a company’s excess capital can pose significant challenges to corporate executives, as Warren Buffett emphasized in his 1987 annual letter to shareholders:
Most bosses rise to the top because they have excelled in an area such as marketing, production, engineering, administration or, sometimes, institutional politics. Once they become CEOs, they face new responsibilities. They now must make capital allocation decisions, a critical job that they may have never tackled and that is not easily mastered.
As Buffett highlights, corporate executives do not commonly rise to the top due to their shrewd capital allocation decisions, yet this is a critically important skill – especially for companies that generate substantial cash flows – as the effectiveness of how this capital is redeployed can have a decisive impact on the long-term value creation of a company.
To drive the point home, take the example of 3M which has generated an average of over $5 billion per year in free cash flow over the past decade. Compare that to its total assets of $46.5 billion at the end of 2022. Basically, one might say that a company like 3M generates sufficient excess capital to create another 3M every decade or less. So how it decides to deploy shareholders’ capital is indeed highly consequential.
—
Let us assume that a company has an adequate and sustainable capital structure with appropriately low debt levels, what can it do with the cash that it generates from its business?
The first option is to invest in growing the business organically. This refers to a company using its capital to expand or streamline business operations – for example, investing in R&D to create new products, building a new factory to grow and optimize production capacity, hiring new staff to expand in a new geography or business area, etc. Basically all of the things that you would expect companies to do in order to grow their sales organically via volume (and pricing) every year. Needless to say, the key element here is the rate of return at which capital is being reinvested into the business. Whether these investments in organic growth yield a return on capital of 5% or 15% obviously makes all the difference in the world.
Another option is to grow the business externally via mergers & acquisitions (M&A). Instead of using capital to expand operations internally, companies can use these resources to acquire or merge with other businesses. This can be a tempting option because it has a more instantaneous impact on growth relative to organic investments, but it is arguably also a riskier way to allocate capital. Companies engaging in M&A can often experience buyer’s remorse due to a lack of due diligence, overpaying for an acquisition target, overestimating synergies, and integration issues.
Beyond investing in the business organically and via M&A, another way to allocate capital is to pay out dividends, which amounts to a distribution of profits to shareholders. For the vast majority of established companies, and especially those that generate a significant amount of cash from their business operations and have limited opportunities to reinvest capital at high rates of return, this is a sensible way to allocate a portion of excess capital. Such companies typically pay out quarterly or yearly dividends, either as a certain ‘payout ratio’ of earnings, or a ‘progressive’ dividend, which is expected to grow every year. Some companies elect to pay out a small regular dividend, and then periodically pay out a large special dividend when excess cash builds up on the balance sheet. All of these dividend policies have their pros and cons, but overall few shareholders would argue against the regular distribution of a share of profits to them. The only disadvantage to dividends is that clearly, they do not contribute to growing a company, and are considered as taxable income for investors, even when reinvested via dividend reinvestment plans (DRIPs).
One final option is to use capital to buy back one’s own shares from the marketplace. Unlike organic or external investments, share buybacks do not add to a company’s productive base or ability to produce a growing stream of sales, profits, and cash flows. Nor do they represent a return of capital to shareholders proper, as dividends do. Rather, share buybacks – provided they reduce the diluted number of shares outstanding – amount to concentrating ownership, thus making each existing share more valuable to shareholders. Importantly, because buybacks are predominantly done by purchasing shares in the open market, where prices can fluctuate meaningfully, management teams could – in theory – enhance their value by purchasing stock when prices are at a discount to intrinsic worth, and refrain from buying when their stock is overvalued. Regrettably, the reality is quite different. More often than not, the value of stock buybacks to shareholders is significantly diminished by the severe dilution from stock options and stock grants, as well as the largely value-agnostic approach to buybacks by most corporate executives.
3M’s capital allocations over the past 10 years
Let’s take a close look at 3M’s (NYSE:MMM) capital allocation decisions over the past decade. We’ll start with the high-level overview to set the scene, and then dive into each category in more detail. As previously mentioned, we’ve excluded the issuance/repayment of debt from this analysis, as well as changes in working capital, in order to focus on the remaining items.
As shown below, 3M has had to allocate close to $75 billion of capital over the past 10 years between capex, acquisitions, dividends, and stock buybacks. That figure is nearly twice its total assets, and well in excess of the company’s current market capitalization of about $62 billion.
Nearly $29 billion, or 38% of total, have been returned to shareholders via dividends. Another $25 billion has been used to repurchase stock (net of cash received from the exercise of options), representing a third of total capital allocated. Capital expenditures amounted for a cumulative $15.5 billion, or 21% of total. And finally, the amount spent on acquisitions (net of divestitures) was about $5.6 billion, or 7% of total.
3M capital allocation analysis (Refinitiv)
Let us now go into more detail for each of these capital allocation options, following the order we used in the previous section:
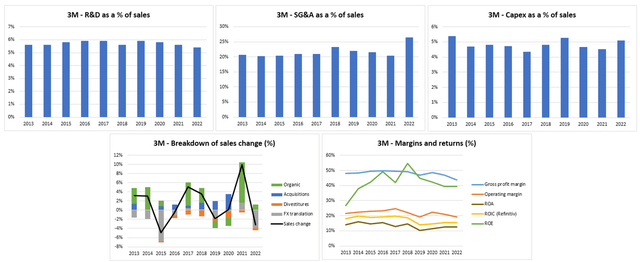
Starting with investments in growing the business organically, the graphs below display R&D and selling, general & administrative (SG&A) expenses, as well as capital expenditures, all expressed as a percentage of sales.
3M has spent an average of 5.7% of sales on R&D, compared with a median of 5.5% in the Global Innovation 1000 and a median of 2-3% for diversified industrial firms, according to Morningstar. The company was ranked 37th in the Boston Consulting Group’s Most Innovative Companies of 2022 survey. Historically, the company has deservedly been lauded as an innovation powerhouse, successfully translating R&D spending into new products and generating high returns on incremental capital. More recently, however, it appears that returns on R&D spending have trended downward, as evidenced by the evolution in organic growth, margins, and return levels (although other factors also influence these metrics).
SG&A has normally averaged about 21% of sales, which is slightly above the median for industrial companies. Note that in 2022, the SG&A figure is impacted by special item costs related to the Combat Arms Earplugs litigation, certain impairment costs related to exiting PFAS manufacturing, costs related to exiting Russia, and divestiture-related restructuring charges.
And finally, capital expenditures (CAPEX) have averaged 4.8% of sales, which is significantly higher than the capex spent of its peer group on average (composed of Honeywell International Inc, Caterpillar Inc, General Electric Co, Illinois Tool Works Inc, Emerson Electric Co, Roper Technologies Inc, and Parker-Hannifin Corp.)
Overall, it would be difficult to argue that 3M has neglected to invest in growing its business organically this past decade. But in more recent years, it may be fair to question the efficacy of these investments to drive profitable growth and generate high returns on incremental invested capital. This is of course very difficult to assess in isolation of the other factors that have impacted the firm’s financial performance.
R&D, SG&A, Capex as a % of sales. Breakdown of sales change. Margins and returns (Refinitiv, 10-Ks)
Next up is M&A (net of business divestments). As shown in the overview above, while M&A has not traditionally been a key component of 3M’s capital allocation decisions, things have gradually changed on that front, especially since Michael Roman became CEO in July 2018. Over the past decade, some of 3M’s main acquisitions include Capital Safety (acquired for $2.5 billion in June 2015), Scott Safety (acquired for $2 billion in October 2017), and finally Acelity (acquired for $6.72 billion in May 2019).
Regarding the purchase of Acelity, which was the largest acquisition ever made by the company, it’s fair to say that it left most investors rather underwhelmed. This was mainly due to the seemingly high purchase price of around 4.5x forward sales, for a business that was expected to grow mid-single digit and with EBITDA margins in the high 20s. In other words, only with the realization of meaningful synergies would such a deal have any chance of creating meaningful value to shareholders. Management has previously reported that the expected cost synergies of 8% of revenue remain on track, but in fairness, as of today it’s difficult to estimate where things stand regarding the integration of Acelity. Moreover, investors were further aggravated by the fact that on the back of this acquisition, the company decided to meaningfully reduce stock buybacks in 2019 and 2020 in order to protect its credit rating. This resulted in the all-too-familiar picture of a management team increasing buybacks at the highs, and reducing them when shares are at multi-year lows. Lastly, many investors felt that the timing of the acquisition, arguably near the top of a business cycle and in the midst of an ongoing restructuring, was ill-judged.
Supposedly, acquisitions may continue to play a larger role in 3M’s capital allocation under its current management team. This may give certain investors some hesitation, as it somewhat departs from the firm’s historical operating model, while others might argue that in its current state, 3M’s business likely requires some transformational deal(s) to rejuvenate its product portfolio and revive growth.
On a brighter note, let’s move on to dividends. 3M is of course famous for having one of the best track records in the entire market when it comes to dividend longevity. The company has paid dividends without interruption for more than 100 years, and it has raised its dividend for 64 years in a row. This makes 3M a so-called ‘Dividend King’, referring to a group of 48 U.S. companies with 50+ consecutive years of dividend increases.
The charts below display the company’s dividend history over the past 20 years, as well as payout ratios as a percentage of earnings, cash from operations, and free cash flow:
Dividend profile 2003-2022 (Refinitiv)
Undoubtedly, investors have been treated well by 3M as far as dividends are concerned. Over the past two decades, the dividend has grown at a compounded annual growth rate (CAGR) of 8.3%, and the forward dividend yield has averaged about 2.8% throughout that period. The dividend has of course grown at a much slower rate in recent years, in part due to all the reasons we know to have impacted the global economy including increasing trade restrictions, the Covid pandemic, supply chain disruptions, and war in Ukraine. While the dividend payout ratio, as a percentage of earnings per share, has gradually increased from about 40% historically to 60% currently, most investors consider 3M’s dividend as safe presently.
On the whole, dividends represent the lion’s share of 3M’s past capital allocations, with nearly $29 billion having been returned to shareholders just these last 10 years. The dividend is a reliable source of regular income for many of the company’s shareholders, and the current forward yield of 5.7% is highly attractive, being higher than it was in the midst of the financial crisis of 2008/09, although the near-term prospects for dividend growth appear muted.
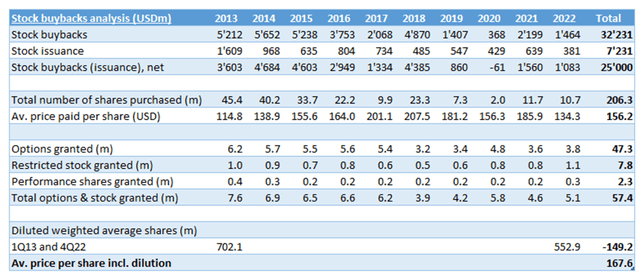
Finally, we come to stock buybacks. As shown in the table below, 3M has used $32.2 billion over the past 10 years to repurchase some 206.3 million shares. This represents an average buying price of about $156 per share. Looking at it by fiscal year, one can see some of the frustration that shareholders have been experiencing, with buybacks being made at relatively high prices in 2017, 2018, and 2021, while buybacks were significantly scaled back when prices were lower in 2019, 2020, as well as throughout this past year. Of course, hindsight is a beautiful thing…
Between 2013 and 2022, the company has also issued a total of 57.4 million options and stock grants to executives, officers, and employees. To put things into perspective, that’s over a quarter of the 206 million shares it repurchased. As some of these options and grants were exercised, 3M received a total of $7.2 billion in cash.
Stock buybacks & issuance (10-Ks)
So one can see that on the surface, 3M has spent $32.2 billion over the past 10 years to repurchase some 206.3 million shares at an average price of about $156. But in reality, it has only spent $25 billion in capital to reduce the fully diluted share count by how much, exactly? Well, if we compare the weighted average diluted share count in 1Q13 to that of 4Q22, we see a reduction of about 149 million shares. So $25 billion spent on reducing the diluted share count by 149 million shares, or a buying price of $167.60 per share, including the dilutive impact of stock options and grants.
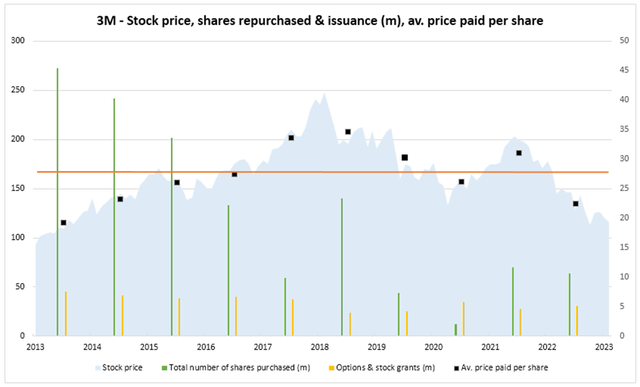
Looking at the chart below, we can see 3M’s stock price as the shaded blue area, as well as the average price paid for buybacks per year (both on the left scale). The green and yellow bars represent the number of shares repurchased and options/grants issued respectively (both on the right scale). The horizontal orange bar, which shows the average price paid inclusion dilution, leaves much to be desired, and it’s easy to see why investors rightly expect more from 3M’s management in terms of creating value, or at least not destroying value, with buybacks.
Stock buybacks & issuance (10-Ks)
Conclusion
This article has aimed to briefly discuss the importance of capital allocation decisions by management teams, and take a close look at 3M’s capital allocations over the past 10 years. We’ve highlighted those that we believe make sense for long-term shareholders, including investments in driving organic growth at appropriate rates of return on capital, and returning capital to shareholders via dividends – versus those that are more questionable, and perhaps even a cause for concern to some, such as acquisitions and buybacks.
Clearly, none of the main capital allocation options are easy. Investing in organic growth at 15%+ rates of return is certainly not easy. It requires innovation, and productivity. As investors, we all know only too well that acquiring good businesses at fair prices is equally hard, if not harder in private markets. Arguably, dividends are the easiest of options in that they represent a risk-free return of capital to shareholders, but they obviously do not contribute to maintaining or growing the company’s productive base. Still, for the vast majority of mature companies, paying out an appropriate portion of earnings as dividends makes perfect sense, as there simply aren’t enough value adding options to redeploy the amount of excess cash they generate. Last but not least, stock buybacks and stock based compensation (SBC) continue to generate a significant amount of debate and polarization, on numerous counts. Some consider buybacks as a return of capital to shareholders proper, in the same right as dividends. Some might even go as far as arguing that stock options shouldn’t be expensed on a company’s P&L, as was the case prior to 2006. Others, on the contrary, definitely consider stock options as both an expense and a source of dilution. Thus, they are rightly wary of the dilutive impact of stock based compensation, as well as most management team’s value-agnostic at best, and value-destructive at worst, approach to stock buybacks.
Overall, while 3M doesn’t rank as the worst example of capital allocation we’ve encountered over time, this review of past capital allocation decisions is rather mixed, and the developments of recent years justify that investors keep a close eye on how the company allocates excess cash going forward.
Disclosure: I/we have a beneficial long position in the shares of MMM either through stock ownership, options, or other derivatives. I wrote this article myself, and it expresses my own opinions. I am not receiving compensation for it (other than from Seeking Alpha). I have no business relationship with any company whose stock is mentioned in this article.
Additional disclosure: The content of this article is for informational purpose only. It constitutes neither a solicitation or an offer or recommendation to buy or sell any investment instruments or to engage in any other transactions.
The information provided in this article is provided “as is” and “as available” without warranty of any kind. Your use of this information is entirely at your own risk. Although the information in this article is obtained or compiled from sources we believe to be reliable, we cannot and do not guarantee or make any representation or warranty, either expressed or implied, as to the accuracy, validity, sequence, timeliness, completeness or continued availability of any information or data made available in this article. In no event shall Oyat be liable for any decision made or action or inaction taken in reliance on any information or data in this article or on any linked documents.
All trading in financial instruments entails risk. Investors should evaluate their intended investments in light of their knowledge and experience, financial positions and investment objectives – or speak to a financial adviser – before making any investment decisions. Past performance is not indicative of future results.
