Summary:
- Tesla, Inc. deserves a look even from conservative value investors.
- After fantastic execution from mid 2020 to present, Tesla is profitable on growing revenue.
- Ongoing market volatility, inflationary pressures, and a possible recession may provide buying opportunities at new lows.
- Based on a straightforward comparable peer valuation, I recommend bargain hunters stay on the sidelines and wait for new Tesla lows below $100.

PeopleImages/E+ via Getty Images
My Approach to Tesla
I am generally a conservative value investor, perhaps to a fault. I was without conviction as Tesla, Inc. (NASDAQ:TSLA) reached ever-higher peaks from mid 2020 to late 2021. Over that period, I never held Tesla directly and even carefully limited my exposure within exchange-traded funds (“ETFs”).
However, I remain a portfolio management student and I understand the contradiction; most portfolios should include some growth exposure. An overly conservative, value portfolio often underperforms growth.
Recently, Tesla has retreated below $200 and may slide further on inflation, economic uncertainty, and banking instability. It would make sense to review Tesla’s past performance and be ready with a targeted buy range.
How Tesla Became Attractive On Value
Tesla Price, Revenue, and Ratios
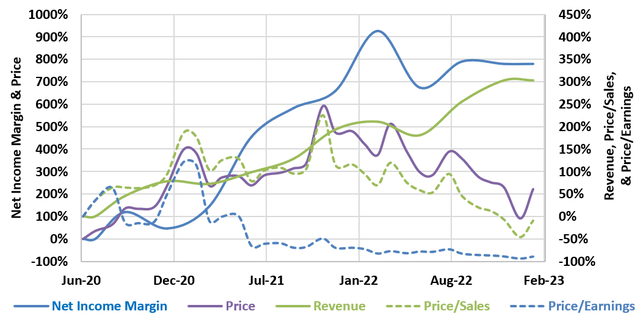
Since mid 2020, Tesla has outperformed most expectations. Net Income Margin (solid blue line plotted against the left axis) is the star of the show; improving almost 800% over the period. At same time, Revenue (solid green line plotted against the right axis) increased over 300% while price (solid purple line line plotted against the left axis) increased only 220%.
The combined effect of Tesla’s exponential margin improvement, strong revenue growth, and current price below $200 is value. Price/Sales (dashed green line plotted against the right axis) is 9% lower while P/E (dashed blue line plotted against the right axis) is about 90% lower than mid 2020.
Tesla’s Relative Value to Auto Manufacturers
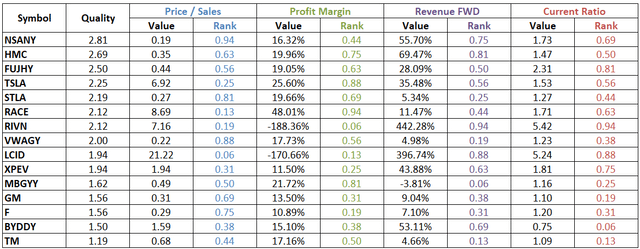
Tesla and its auto manufacturing peers were evaluated using a quality matrix with factors including Price/Sales, Profit Margin, Forward Revenue, and Current Ratio. The values for each factor was normalized by means of statistical percent ranking with relation to the group. The quality matrix was calculated as the sum of the percent ranks of the factors.
Auto Manufacturers: Relative Valuation
The above chart is sorted in descending order of the best quality (highest matrix score) to the poorest quality (lowest matrix score).
Auto Manufacturers: Relative Valuation Plot
Author
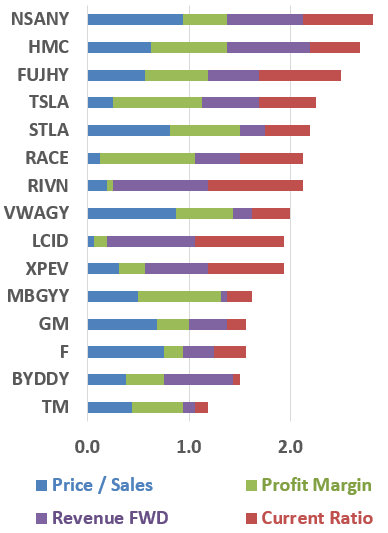
The quality matrix is presented graphically in the stacked bar chart to the left, with cumulative inputs for each factor.
Based on this analysis, Tesla is reasonably valued with relation to legacy automakers including Nissan Motor Co., Ltd. (OTCPK:NSANY), Honda Motor Co., Ltd. (HMC), and Subaru Corporation (OTCPK:FUJHY).
Further, Tesla appears to be a better value than its EV peers including Rivian Automotive, Inc. (RIVN), Lucid Group Inc. (LCID), XPeng Inc. (XPEV), and BYD Company Limited (OTCPK:BYDDY).
Quality Matrix Limitations
Investors should consider the quality matrix a screen only. The matrix factors, normalization method, and weights could all be adjusted and yield different results. Further, the matrix is based on the most readily available and common metrics. These metrics can change rapidly with share price or as new company reports are released. It does not include company-specific data available in quarterly reports and presentations. Every investment decision regarding an individual equity should be based on comprehensive analysis of that equity.
Tesla Share Price: Lower Limits
Average Price/Sales and PE ratios were calculated for the same auto manufacturers listed above and used in the following valuation.
Comparables Valuation
The lower end target Tesla price was calculated based on comparable peer average ratios and estimated 1st quarter 2023 revenues. Based on average Price/Sales and PE ratios lower limits were calculated at $92.99 and $55.94 respectively. Obviously the values are well below current market price of around $190. However, $92.99 (based on comparable Price/Sales) is only about 10% lower than Tesla’s 52 week low of $101.81.
Conclusions
Although Price/Sales and P/E ratios are calculated from empirical data, they also reflect current sentiment and outlook. Clearly my lower price targets will shock some current Tesla bulls and long-term holders; I expect to hear from both groups in comments.
However, I’m in an enviable and contradictory position. While I am bullish on Tesla, Inc., I currently don’t own a single share. I am long-term bullish on Tesla while the market may be at the beginning of a long-term slide on inflation, rising interest rates, financial sector instability, and what many have described as a historic bubble. I’m hoping to buy Tesla at or near its lowest price in a declining and volatile market.
In the moment of action remember the value of silence and order. -Phormio of Athens.
Editor’s Note: This article discusses one or more securities that do not trade on a major U.S. exchange. Please be aware of the risks associated with these stocks.
Disclosure: I/we have no stock, option or similar derivative position in any of the companies mentioned, and no plans to initiate any such positions within the next 72 hours. I wrote this article myself, and it expresses my own opinions. I am not receiving compensation for it (other than from Seeking Alpha). I have no business relationship with any company whose stock is mentioned in this article.


