
Summary:
- Micron’s substantial increase in inventory is due to weaker demand growth compared to supply growth in the PC and smartphone markets.
- Market pricing for DRAM and NAND has declined in 2023, impacting Micron’s financial results for two quarters.
- Pricing may stabilize as memory manufacturers reduce capital expenditures, aligning supply growth with demand growth.
- Revised projections anticipate weak profitability in FY2023 but expect improvements and a positive pricing outlook in the long term.
vzphotos
In our previous analysis of Micron Technology, Inc. (NASDAQ:MU), we identified weaker ASPs as a key factor that negatively impacted the company’s revenue growth and led to underperformance relative to our initial forecast. However, we noted that Micron had outlined a plan to significantly reduce its capital expenditures for FY2023, which we believed could help stabilize market pricing, as our projections indicated that market supply growth would be lower than demand growth.
In this current analysis of Micron, we conducted a comprehensive examination of the company following its Q2 FY2023 earnings release. The reported revenues showed a substantial decline of -26% YoY TTM, which fell well below our growth expectations compared to our initial FY2023 forecast of 23.21%. Consequently, we delved into an evaluation of Micron to determine whether our outlook on the company needed revision in light of these developments within Micron and the overall memory market.
Firstly, we thoroughly analyzed the inventory build-up observed in Q2 FY2023 and investigated the underlying factors contributing to this situation, considering both supply and demand growth dynamics. Furthermore, we examined the factors for Micron’s poor performance in recent quarters, specifically focusing on weak pricing growth. We sought to identify the factors influencing market pricing, as well as the dynamics of market demand and supply growth.
Finally, we evaluated the company’s profitability by examining its gross, net and FCF margins. We identified the factors impacting the weaker margins and update our outlook on the company accordingly. Subsequently, we incorporated these revised projections into our valuation model based on DCF and determine a new price target.
Higher Inventories as Demand Growth Underperforms Supply Growth
|
Days Inventory Ratio |
2015 |
2016 |
2017 |
2018 |
2019 |
2020 |
2021 |
2022 |
TTM |
Average |
|
Micron |
105.31 |
138.02 |
136.72 |
158.38 |
218.42 |
207.37 |
163.30 |
208.83 |
294.93 |
153.18 |
|
Samsung (OTCPK:SSNLF) |
66.31 |
68.49 |
69.72 |
94.49 |
87.98 |
91.15 |
105.32 |
116.03 |
126.20 |
78.94 |
|
SK Hynix |
59.37 |
66.82 |
67.05 |
84.91 |
94.22 |
98.93 |
114.25 |
154.73 |
N/A |
84.72 |
|
Inventory Turnover Ratio |
2015 |
2016 |
2017 |
2018 |
2019 |
2020 |
2021 |
2022 |
TTM |
Average |
|
Micron |
3.47 |
2.64 |
2.67 |
2.30 |
1.67 |
1.76 |
2.24 |
1.75 |
1.24 |
2.60 |
|
Samsung |
5.50 |
5.33 |
5.23 |
3.86 |
4.15 |
4.00 |
3.47 |
3.15 |
2.89 |
5.34 |
|
SK Hynix |
6.15 |
5.46 |
5.44 |
4.3 |
3.87 |
3.69 |
3.19 |
2.36 |
N/A |
4.81 |
Source: Company Data, Morningstar, Khaveen Investments
We analyze the efficiency ratios for the inventory of the top 3 memory makers including Micron, Samsung and SK Hynix. Based on the table, all 3 companies have had increasing days inventory which is the highest in the past 10 years. For Micron, the company has the highest days inventory ratio among competitors and is well above its 10-year average. Additionally, the inventory turnover ratios have declined to the lowest in the past 10 years. This is because according to Micron, the industry is facing a negative market environment that is the worst in the past 13 years based on its latest earnings briefing. Below, we examine the factors for the surge in inventory levels.
Supply Growth
|
Estimated Micron Supply Growth |
Annualized H1 2023 (Calculated) |
Our FY2023 Forecast |
Difference |
|
DRAM |
2.1% |
1.8% |
0.3% |
|
NAND |
3.1% |
1.6% |
1.5% |
Source: Company Data, Khaveen Investments
Firstly, in terms of supply growth, we computed our estimate for the company’s H1 FY2023 supply growth and compared it to our previous estimates from our last coverage of Micron. Based on the company’s H1 FY2023, we derived an annualized supply growth of 2.1% and 3.1% for Micron’s DRAM and NAND growth respectively. Thus, we calculated its annualized H1 2023 supply growth as being only slightly lower by 0.3% for DRAM and 1.5% for NAND compared to our previous forecasts.
Demand Growth
|
Micron Demand Growth |
Annualized H1 2023 (Calculated) |
Our FY2023 Forecast |
Difference |
|
DRAM |
3.60% |
14.80% |
-11.20% |
|
NAND |
16.17% |
32.70% |
-16.53% |
Source: Company Data, Khaveen Investments
In terms of demand, we computed the company’s annualized H1 2023 demand growth based on our market demand calculations where we updated the end markets including PC and smartphones. From the table, the annualized H1 2023 demand growth is lower than our previous demand forecasts for 2023 with a difference of -11.2% (‘DRAM’) and -16.5% (NAND), indicating lower demand for 2023.
Net Change
|
Micron Demand vs Supply Net Change |
Supply Growth Difference |
Demand Growth Difference |
Net Difference |
|
DRAM |
0.3% |
-11.2% |
11.5% |
|
NAND |
1.5% |
-16.5% |
18.0% |
Source: Company Data, Khaveen Investments
Therefore, we derived the net change between the calculated H1 2023 annualized supply and demand growth compared to our forecasts in the table above. For DRAM, the change in demand growth is lower compared to the change in supply growth. Similarly in NAND, the change in demand growth is also lower compared to the change in supply growth. Thus, the demand for both DRAM and NAND is indicated to have weakened faster than the slowdown in supply growth, which we believe led to the buildup in inventory. We believe the net increase in supply caused by the larger decline in demand growth relative to supply is the reason behind the decline in the company’s ASPs.
Lower Capex
|
Estimated Micron (FY) ($ mln) |
2022 |
2023 (Annualized) |
Our Previous Forecast |
|
Micron Capex |
12,067 |
9,308 |
8,273 |
|
Micron Depreciation |
7,116 |
7,726 |
7,116 |
|
Net Capex |
4,951 |
1,582 |
1,157 |
|
Capex Change |
-3,369 |
-3,794 |
Source: Company Data, Khaveen Investments
In H1 2023, the company’s capex had been reduced from $5.8 bln in the prior year compared to $4.6 bln. Factoring in depreciation, we obtained net capex which shows a large decline from $2.46 bln to $791 mln, a decrease of 68%. This translates to an annualized net capex of $1.58 bln which is higher compared to our previous forecast of $1.15 bln but still lower than the full-year 2022 net capex of $4.95 bln. According to Micron’s latest quarterly report, the company highlighted that it had “reduced wafer starts and capital expenditures” citing the “challenging pricing environment” and increased inventory levels”. Moreover, the company guided its capex lower to $7 bln in its latest earnings briefing from $7.5 bln at the midpoint in its previous briefing.
End Market Weakness
|
Micron Demand Growth |
Annualized DRAM (H1 FY23) |
Annualized NAND (H1 FY23) |
|
Mobile Phones |
6.7% |
8.3% |
|
Consumer Electronics |
0.0% |
0.0% |
|
PCs |
-12.9% |
3% |
|
ICT Infrastructure |
8.4% |
28.1% |
|
Industrials |
1.7% |
1.70% |
|
Auto |
31.5% |
91.1% |
|
Total Demand Growth % |
3.6% |
19.7% |
Source: Company Data, Khaveen Investments
In terms of demand, we compiled our demand growth estimates for H1 2023 to be lower than our previous projections due to the poor PC and smartphone end-market growth which is challenged by various headwinds as discussed in our previous analyses and continued to decline by an annualized rate of 10% and 22% respectively in FY2023. Thus, we estimated the actual DRAM and NAND demand growth to be only 3.6% and 19.7%.
Updated Demand Forecast
|
Forecasted DRAM Demand Growth |
2022 |
2023F |
2024F |
2025F |
|
Mobile Phones |
5.2% |
21.9% |
20.3% |
20.3% |
|
Consumer Electronics |
4.5% |
4.5% |
4.5% |
4.5% |
|
PCs |
-6.4% |
-1.4% |
32.5% |
19.9% |
|
ICT Infrastructure |
12% |
8% |
8% |
8% |
|
Industrials |
1.70% |
1.70% |
1.70% |
1.70% |
|
Auto |
34% |
32% |
32% |
32% |
|
Total DRAM Demand Growth % |
5.3% |
10.7% |
15.9% |
14.6% |
|
Forecasted NAND Demand Growth |
2022 |
2023F |
2024F |
2025F |
|
Mobile Phones |
6.7% |
23.7% |
22.0% |
22.0% |
|
Consumer Electronics |
4.5% |
4.5% |
4.5% |
4.5% |
|
PCs |
11% |
9% |
45% |
32% |
|
ICT Infrastructure |
28.1% |
28.1% |
24.1% |
24.7% |
|
Industrials |
1.70% |
1.70% |
1.70% |
1.70% |
|
Auto |
70.7% |
62.8% |
62.8% |
62.8% |
|
Total NAND Demand Growth % |
15.9% |
22.2% |
25.7% |
27.6% |
Source: Company Data, Khaveen Investments
We updated our forecast for the DRAM and NAND demand growth by each market breakdown including Mobile, Consumer Electronics, PCs, ICT Infrastructure, Industrials and Auto.
For the PC market, we updated our projections with our PC market sales growth forecast of -11.7% in 2022 in our analysis of Intel. This is lower compared to Micron’s management’s expectations from its last earnings briefing for “PC unit volume to decline by mid-single-digit percentage”. Though, this is still an improvement compared to 2022 where the PC market declined by 16%. As such, we forecasted the DRAM and NAND demand growth to be -1.4% and 17% for the PC market which represents an improvement to 2022. Additionally, the company stated that its customers’ inventory levels have improved and expect increased demand in H2.
In the smartphone market, total sales declined by 11.3% in 2022 according to the IDC but was forecasted to recover to a positive growth of 2.8% in 2023 but lower than the previous forecast of 5%. Based on our updated forecast, we projected the smartphone DRAM and NAND total demand growth of 21.9% and 33% respectively. Moreover, the company expects increased demand for smartphone DRAM and NAND in H2 2023.
We maintained our previous forecasts for the remaining markets including consumer electronics, ICT infrastructure, industrials, and automotive. Overall, despite the lower PC and smartphone market forecast outlook, we still see demand growth for DRAM and NAND firms and stronger compared to 2022. However, in our previous analysis, we forecasted higher DRAM and NAND growth of 14.8% and 32.7% respectively.
Updated Supply Forecast
According to Micron’s management, the company “now expects that the industry bit supply growth for DRAM and NAND in calendar 2023 will be below demand growth”, this is in line with our analysis previously where we expected supply growth for DRAM and NAND markets to be below demand growth for 2023. Thus, management outlook guidance further supports our expectations of the company managing the supply situation to control pricing.
However, the company highlighted that the company is “further reducing” its supply and has reduced its capex guidance to $7 bln from a midpoint of $7.25 bln in the Q1 earnings briefing and $8 bln before that.
For our Micron forecasts, we based our capex forecast in 2023 on the company’s guidance of $7 bln. After accounting for depreciation for Micron, we derived the net capex total forecast in 2023.
|
Micron Supply Forecast |
2019 |
2020 |
2021 |
2022 |
2023F |
2024F |
2025F |
2026F |
|
Micron DRAM Supply |
36,667 |
37,494 |
39,707 |
41,737 |
41,686 |
44,234 |
46,903 |
50,123 |
|
Growth % |
13.1% |
2.3% |
5.9% |
5.1% |
-0.1% |
6.1% |
6.0% |
6.9% |
|
Micron NAND Supply |
56,213 |
80,383 |
90,339 |
104,011 |
103,811 |
113,760 |
124,181 |
136,751 |
|
Growth % |
-2.2% |
43.0% |
12.4% |
15.1% |
-0.2% |
9.6% |
9.2% |
10.1% |
|
Micron DRAM Increase |
4,251 |
827 |
2,213 |
2,030 |
-51 |
2,548 |
2,669 |
3,220 |
|
Micron NAND Increase |
-1,274 |
24,170 |
9,956 |
13,672 |
-201 |
9,949 |
10,421 |
12,570 |
|
DRAM Shipments Increase/Capex |
1.418 |
0.455 |
0.777 |
0.549 |
0.594 |
0.594 |
0.594 |
0.594 |
|
NAND Shipments Increase/Capex |
-0.425 |
13.302 |
3.494 |
3.698 |
6.832 |
6.832 |
6.832 |
6.832 |
Source: Company Data, Khaveen Investments
Based on our new capex forecast for Micron, we updated our supply projections for the company’s full-year supply growth to be negative at -0.1% for DRAM and -0.2% for NAND compared to positive supply growth in 2023.
Updated Net Shipments Forecast
|
Micron Shipments Forecast |
2023F |
2024F |
2025F |
|
Total DRAM Demand Growth % |
10.7% |
15.9% |
14.6% |
|
Total NAND Demand Growth % |
25.8% |
31.3% |
30.0% |
|
Total DRAM Supply Growth % |
-0.1% |
6.1% |
6.0% |
|
Total NAND Supply Growth % |
-0.2% |
9.6% |
9.2% |
|
DRAM Unit Shipments |
-0.1% |
6.1% |
6.0% |
|
NAND Unit Shipments |
-0.2% |
9.6% |
9.2% |
Source: Company Data, Khaveen Investments
We updated our net shipment projections for Micron in 2023. We did this by updating our demand vs supply growth projections which we based the shipments on the lower demand or supply growth. From 2023 through 2025, we projected supply growth to be lower for each year, thus we based its shipments growth on supply growth as the limiting factor.
Overall, we believe the company’s inventory buildup was due to larger declines in demand growth compared to supply growth as PC and smartphone end markets deteriorated during the period. However, we expect shipment growth to be limited by supply growth going forward as Micron further reduced capex and we projected supply growth to be below its demand growth through 2026. For DRAM, our updated shipment projections for 2023 are substantially lower than our previous forecast (14.8%) with a 3-year average of 4% versus 14.6% previously. Whereas for NAND, our updated unit shipments growth for 2023 has changed only a little compared to our previous analysis but with a lower 3-year average of 6.2% compared to 9.3% previously.
Market Pricing Weakness with Inventory Glut
We compiled the company’s Q1 2023 TTM revenue growth for DRAM and NAND and compared it with the company’s Q3 2022 TTM performance. We have broken down the DRAM and NAND revenue growth based on unit shipments and ASP growth. We compared these growth rates with our full year 2023 previous forecast to examine the difference between our projections and its actual performance.
|
Micron DRAM (Calendar Year) |
Q4 ’21 |
Q1 ’22 |
Q2 ’22 |
Q3 ’22 |
Q4 ’22 |
Q1 ’23 |
Q3 2022 TTM |
Q1 2023 TTM |
Our Forecast (Q3 2023 TTM) |
|
Unit Shipment Growth % |
-6% |
8% |
10% |
-13% |
-25% |
16% |
-3% |
-17% |
1.8% |
|
ASP Growth % |
-2.5% |
-5% |
-0.4% |
-12.50% |
-21% |
-17% |
-19% |
-43% |
35.30% |
|
DRAM Revenue QoQ Growth % |
-8.3% |
2.5% |
9.6% |
-24.2% |
-41.1% |
-3.6% |
-22% |
-53% |
37.74% |
|
Micron NAND (Calendar Year) |
Q4 ’21 |
Q1 ’22 |
Q2 ’22 |
Q3 ’22 |
Q4 ’22 |
Q1 ’23 |
Q3 2022 TTM |
Q1 2023 TTM |
Our Forecast (2023) |
|
Unit Shipment Growth % |
0% |
-1% |
17.5% |
-22% |
-15% |
7% |
-9% |
-16% |
1.6% |
|
ASP Growth % |
-5.0% |
5.0% |
-0.5% |
-7.5% |
-21.6% |
-25.0% |
-8% |
-46% |
41.1% |
|
NAND Revenue QoQ Growth % |
-4.7% |
4.2% |
16.9% |
-27.9% |
-33.3% |
-19.5% |
-16% |
-55% |
43.36% |
Source: Micron, Khaveen Investments
In Q1 2023 TTM, the company’s DRAM and NAND revenues declined by 53% and 55% YoY. This represents larger declines for both DRAM and NAND compared to its Q3 2022 TTM growth. Its Q1 TTM revenue growth is also well below our forecast for the full-year 2023 DRAM and NAND growth.
The underperformance of DRAM and NAND growth for Micron is due to massive declines in ASPs in Q1 TTM, higher declines compared to Q3 TTM. In contrast, we previously forecasted ASPs to recover in 2023 at double-digit growth as the top memory makers manage supply growth to balance the market. However, its ASPs in DRAM continued to decline even in Q1 2023 at a similar pace in Q4 2022 whereas although NAND ASP growth improved from the previous quarter, it remains negative.
In terms of shipments, the Q1 TTM shipment growth for NAND and DRAM are both below our forecasts and worse compared to Q3 TTM. However, Q1 includes the poor performance of Q3 and Q4 2022. In Q1 2023, the company’s unit shipment growth turned to positive sequential growth.
Overall, the negative growth in Q1 2023 was significantly below our expectations mainly driven by large declines in pricing growth which is in contrast with our expectations of improving pricing in 2023. For pricing growth to meet our initial ASP projections, we calculated that it should have shown an increase of 8% and 9% for DRAM and NAND for each quarter. However, the actual pricing growth is well below these levels.
Based on our calculations, we estimate that pricing growth must be 54% and 70% for DRAM and NAND respectively to meet our original projections for ASP growth in 2023. We believe that while we expect pricing to be supported in the second half due to lower supply growth than demand, we discussed whether this could be achieved in the points below.
We analyzed why the company’s ASP was down below by examining factors such as market pricing declines, market supply and market demand.
Market Pricing Declines
JCMIT, Semico, Khaveen Investments ICInsights, Semico, Khaveen Investments

Pricing experienced large declines for DRAM and NAND in 2022. We updated our long-term pricing forecast model for DRAM and NAND respectively with 2021 and 2022 data. Our new long-term trend line indicates the long-term pricing at $0.07/GB for NAND and $0.53/GB for DRAM in 2023.
JCMIT, PCPartPicker, Khaveen Investments JCMIT, PCPartPicker, Khaveen Investments
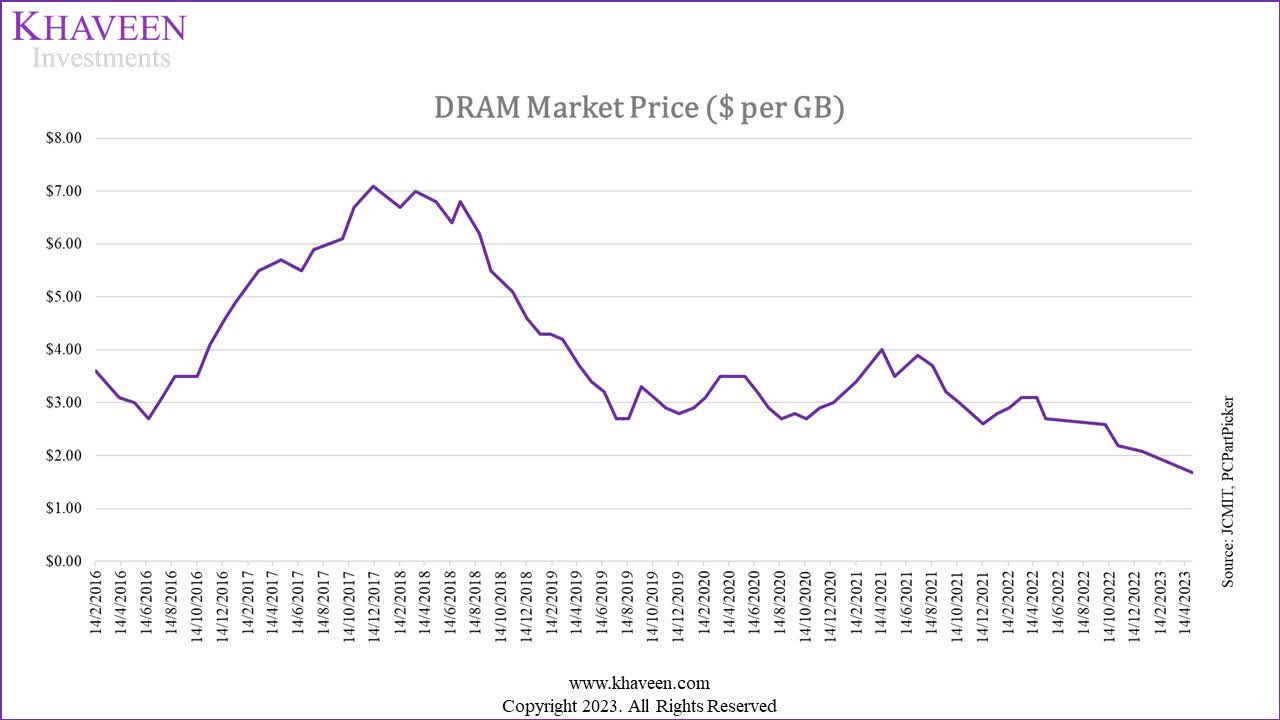
Based on the chart above of our compiled market pricing data, in Q1 2023 TTM, DRAM and NAND market pricing declined by 44% and 49.4% respectively, which is in line with Micron’s ASP declines of around 43% (‘DRAM’) and 46% (NAND). Furthermore, market pricing continued to deteriorate in 2023 with DRAM pricing down by 18.9% from $2.1/Gb to $1.7/Gb while NAND pricing also declined by 19.4% from $0.05/Gb to $0.04/Gb. Compared to our forecasts, the annualized market pricing for DRAM (-56.7%) and NAND (-58%) is significantly different from our full-year projections of positive increases for ASPs by 35.3% (‘DRAM’) and 41% (NAND). As we concluded earlier that the reason for the company’s ASP decline was due to the positive net change in excess supply, we similarly believe the reason for the market pricing decline is due to a positive net change in market excess supply, which we examine next.
Market Supply
|
Capex Forecast ($ mln) |
2021 |
2022 |
2023F |
2024F |
2025F |
2026F |
|
Micron |
10,030 |
12,067 |
7,000 |
12,865 |
13,138 |
14,380 |
|
SK Hynix |
10,905 |
15,289 |
7,644 |
15,726 |
17,859 |
20,283 |
|
Samsung Memory |
16,060 |
13,435 |
13,435 |
13,435 |
13,435 |
13,435 |
|
Total |
36,995 |
40,791 |
28,079 |
42,026 |
44,432 |
48,098 |
|
Growth % |
16.15% |
10.26% |
-31.16% |
49.67% |
5.72% |
8.25% |
|
Depreciation Forecast ($ mln) |
2021 |
2022 |
2023F |
2024F |
2025F |
2026F |
|
Micron |
6,214 |
7,116 |
7,116 |
7,116 |
7,116 |
7,116 |
|
SK Hynix |
9,308 |
10,955 |
10,955 |
10,955 |
10,955 |
10,955 |
|
Samsung Memory |
6,541 |
6,541 |
6,541 |
6,541 |
6,541 |
6,541 |
|
Net Capex Forecast ($ mln) |
2021 |
2022 |
2023F |
2024F |
2025F |
2026F |
|
Micron |
3,816 |
4,951 |
-116 |
5,749 |
6,022 |
7,264 |
|
SK Hynix |
1,597 |
4,333 |
-3,311 |
4,771 |
6,904 |
9,328 |
|
Samsung Memory |
9,519 |
6,894 |
6,894 |
6,894 |
6,894 |
6,894 |
|
Total |
14,932 |
16,178 |
3,467 |
17,414 |
19,820 |
23,486 |
|
Growth % |
23.22% |
8.35% |
-78.57% |
402.26% |
13.82% |
18.50% |
Source: Company Data, Khaveen Investments
We updated our capex projections for the companies. For Micron, we based our capex forecast in 2023 on the company’s guidance of $7 bln. In addition, SK Hynix had also guided that it is planning to cut capex by half in 2023, thus we estimate it based on its 2022 capex adjusted by 50% down. However, Samsung indicated that the company would continue to maintain capex levels similar to 2022 thus we maintain our capex forecast for the company.
After accounting for depreciation for the three companies, we derived the net capex total forecast in 2023, where we obtained a growth rate of -78.6% compared to 26% in our previous forecast. Furthermore, we updated our supply growth model for DRAM and NAND markets below through 2026 based on our new net capex forecasts for the top memory makers.
|
Supply |
2023F |
2024F |
2025F |
2026F |
|
DRAM |
188,726 |
201,643 |
216,461 |
233,927 |
|
Growth % |
0.8% |
6.8% |
7.3% |
8.1% |
|
NAND |
1,108,718 |
1,417,425 |
1,763,815 |
2,162,828 |
|
Growth % |
8.1% |
27.8% |
24.4% |
22.6% |
Source: Company Data, Khaveen Investments
Additionally, we compared our previous supply projections with our latest supply projections below to examine the change compared to our previous forecasts.
|
2023 |
Supply (Previous Forecast) |
Supply (Latest Forecast) |
|
Total DRAM Growth % |
5.3% |
0.8% |
|
Total NAND Growth % |
13% |
8.1% |
Source: Company Data, Khaveen Investments
Compared to our previous forecasts, we now project the market supply growth for both DRAM and NAND lower at 0.8% (‘DRAM’) and 8.1% (‘NAND’) which is a difference of 4.5% and 4.9% respectively. We believe this bodes well for market pricing with the reduction in supply growth.
Market Demand
|
Forecasted DRAM Demand Growth |
2022 |
2023F |
2024F |
2025F |
|
Mobile Phones |
5.2% |
21.9% |
20.3% |
20.3% |
|
Consumer Electronics |
4.5% |
4.5% |
4.5% |
4.5% |
|
PCs |
-6.4% |
-1.4% |
32.5% |
19.9% |
|
ICT Infrastructure |
12% |
8% |
8% |
8% |
|
Industrials |
1.70% |
1.70% |
1.70% |
1.70% |
|
Auto |
23% |
32% |
32% |
32% |
|
Total DRAM Demand Growth % |
5.1% |
10.7% |
15.9% |
14.6% |
|
Forecasted NAND Demand Growth |
2022 |
2023F |
2024F |
2025F |
|
Mobile Phones |
6.7% |
23.7% |
22.0% |
22.0% |
|
Consumer Electronics |
4.5% |
4.5% |
4.5% |
4.5% |
|
PCs |
3% |
9% |
45% |
32% |
|
ICT Infrastructure |
28.1% |
28.1% |
24.1% |
24.7% |
|
Industrials |
1.70% |
1.70% |
1.70% |
1.70% |
|
Auto |
70.7% |
62.8% |
62.8% |
62.8% |
|
Total NAND Demand Growth % |
15.1% |
22.2% |
25.7% |
27.6% |
Source: Company Data, Khaveen Investments
Furthermore, we updated our demand forecast for the market DRAM and NAND growth and compiled it with our supply projections. Our new demand projections reflect our updated forecasts of the PC end market which we forecasted to continue remaining in decline for 2023 at -11.7% in our analysis of Intel as well as an updated smartphone market based on market forecast CAGR by IDC.
|
2023 |
Demand (Previous Forecast) |
Demand (Latest Forecast) |
|
Total DRAM Growth % |
14.8% |
10.8% |
|
Total NAND Growth % |
32.7% |
25.8% |
Source: Company Data, Khaveen Investments
Based on our updated estimated full-year 2023 demand growth for DRAM and NAND, we compared this with our previous forecast. Our demand projections for 2023 are weaker in our updated forecast for both DRAM and NAND markets as we expect weak end market sales outlook for PC and smartphones to persist in 2023.
|
Market Demand Forecast |
2023F |
2024F |
2025F |
2026F |
|
DRAM |
207,232 |
240,130 |
275,156 |
311,221 |
|
Growth % |
10.7% |
15.9% |
14.6% |
13.1% |
|
NAND |
1,245,618 |
1,565,613 |
1,997,190 |
2,449,268 |
|
Growth % |
22.2% |
25.7% |
27.6% |
22.6% |
|
Market Supply Forecast |
2023F |
2024F |
2025F |
2026F |
|
DRAM |
188,726 |
201,643 |
216,461 |
233,927 |
|
Growth % |
0.8% |
6.8% |
7.3% |
8.1% |
|
NAND |
1,102,375 |
1,411,081 |
1,757,471 |
2,156,484 |
|
Growth % |
8.1% |
28.0% |
24.5% |
22.7% |
|
Net Difference |
2023F |
2024F |
2025F |
2026F |
|
DRAM |
9.9% |
9.0% |
7.2% |
5.0% |
|
NAND |
14.0% |
-2.3% |
3.0% |
-0.1% |
Source: Company Data, Khaveen Investments
|
Market Growth Net Change |
Supply |
Demand |
Net Difference |
|
DRAM |
-4.50% |
-4.90% |
0.40% |
|
NAND |
-4.90% |
-10.50% |
5.60% |
Source: Company Data, Khaveen Investments
We compiled our net change in our growth projections for demand and supply for DRAM and NAND in 2023. Based on the table, the net change for DRAM and NAND indicates lower demand growth relative to supply growth, which we believe could support market pricing.
|
DRAM Market Pricing Forecast |
2020 |
2021 |
2022 |
2023F |
2024F |
2025F |
|
ASP ($/GB) |
0.41 |
0.53 |
0.42 |
0.58 |
0.60 |
0.61 |
|
Growth % |
8.2% |
29.6% |
-21.9% |
39.9% |
3.0% |
1.9% |
|
NAND Market Pricing Forecast |
2020 |
2021 |
2022 |
2023F |
2024F |
2025F |
|
ASP ($/GB) |
0.08 |
0.077 |
0.050 |
0.082 |
0.072 |
0.074 |
|
Growth % |
23.8% |
21.0% |
-12.5% |
65.9% |
1.9% |
17.3% |
Source: Company Data, Khaveen Investments
Overall, we see supply growth being lower than demand growth through 2026, which we believe could support market pricing. We believe the main factor for the company’s decline in ASPs is due to market pricing which has been down severely in 2023. However, we believe pricing could be supported as we modeled supply growth to be even lower than demand growth for the market as the top memory makers reduce capex in 2023. We updated our long-term DRAM and NAND pricing projection model and adjusted it by the difference between our supply and demand forecasts to derive a market ASP growth forecast for 40% (‘DRAM’) and 65.9% (NAND) in 2023. Our projections show lower ASP forecasts for Micron but represent a higher growth rate as pricing declined significantly in 2022. To sum it up, our pricing outlook has not changed and we continue to expect pricing to recover and grow positively based on our long-term pricing model.
Profitability Impacted by Market Weakness
Negative Margins
|
Micron |
Q2 FY2023 TTM |
Our FY2023 Forecast |
|
Gross Margins |
27.51% |
51.56% |
|
Operating Margins |
9% |
33.05% |
|
Net Margins |
7% |
25.55% |
|
FCF Margins |
-7% |
17.16% |
Source: Company Data, Khaveen Investments
We examined the company’s Q2 FY2023 TTM profitability by compiling its gross, operating, net and FCF margins in the period and compared it with our FY2023 forecasts. Based on the table, the company’s gross margins were significantly lower in Q2 TTM with a difference of 24% at 27.51% compared to our previous gross margins forecast of 51.6%. Moreover, the company’s operating net margins and net margins were also much lower compared to our forecast with a difference of between 24% and 18.5%. Additionally, the company’s FCF margins have also turned negative in Q2 TTM compared to our positive forecasts of 17%.
According to the company’s quarterly report for Q2, the company explained that its gross margins were impacted “due to a $1.43 billion charge to write down inventories to their estimated net realizable value and the declines in average selling prices for both DRAM and NAND”. Furthermore, management guided that its gross margins were “to be negatively impacted by pricing, write-down of inventory, cost of underutilization and a higher mix of NAND” and guided inventory write-downs of $500 mln.
Inventory Write Downs
In Q2 FY2023 TTM, the company’s gross margins were lower than our forecast at 27.5% compared to 51.6%. This is as for Q2 FY2023, the company’s gross margins fell to -31.4%.
In Q2 FY2023, the company had an inventory write-down of $1.4 bln which resulted in an impact of 38.7% on its gross margins. According to management, the inventory write-down…
…results from projected selling prices falling below the cost of inventory and are not the result of obsolescence. – Micron
Based on its quarterly report, the company mentioned in its risk factors that…
…we may incur charges in connection with obsolete or excess inventories or we may not fully recover our costs, which would reduce our gross margins. For example, in the second quarter of 2023, we recorded a charge of $1.43 billion to write down the carrying value of our inventories to estimated net realizable value. – Micron Q2 FY23 Quarterly Report
Therefore, the company could face inventory write-downs due to lower market pricing which it experienced in Q2 FY2023 as its ASPs for DRAM and NAND declined by 18.9% and 19% respectively as DRAM and NAND market pricing declined.
Margins Adjusted for Inventory Write Downs
|
Micron |
Q2 FY2023 TTM |
Our FY2023 Forecast |
|
Gross Margins |
33.5% |
51.56% |
|
Operating Margins |
15% |
33.05% |
|
Net Margins |
13% |
25.55% |
|
FCF Margins |
-7% |
17.16% |
Source: Company Data, Khaveen Investments
We adjusted the company’s profitability margins in Q2 FY2023 TTM to exclude the impact of inventory write-down it experienced by adding back the impact of $1.4b bln to its gross margins. Excluding the impact, we derived an adjusted gross margin of 33.35% which is still well below our previous projections. After adjusting its gross margins, we obtained our adjusted operating and net margins which are also lower than our previous projections. Its FCF margins remain the same as inventory write-downs are non-cash expenses.
Other Reasons for Lower Margins
Furthermore, management guided that its gross margins were…
…to be negatively impacted by pricing, write-down of inventory, cost of underutilization and a higher mix of NAND” – Micron
As discussed above, the company’s margins have been impacted by inventory write-downs. We analyzed below whether the company’s gross margins could have been impacted by the cost of underutilization and higher NAND mix.
Cost of Underutilization
Based on the company’s quarterly report, the company highlighted that it had reduced wafer starts and capex due to the challenging market and high inventory levels. Additionally, the company mentioned that it had “recognized $27 million of period costs from underutilization in the second quarter of 2023 due to wafer start reductions”. However, this represents only a small portion of its Q2 TTM revenues (0.1%), thus we believe its cost of underutilization did not contribute to the significantly lower margins for the company. However, management guided that it expects the cost of underutilization to be $1.1 bln for the full year in FY2023 based on its earnings briefing.
Lower NAND Margins
In terms of margins between NAND and DRAM, Micron had stopped providing disclosure of its NAND and DRAM margins. However, in 2019, the company’s gross margins for DRAM and NAND were 71% and 48% respectively, thus DRAM had higher margins compared to NAND by 23%. In Q2 2023 TTM, the company’s breakdown between DRAM (73.6%) and NAND (26.4%) had changed compared to the same period a year ago with lower DRAM % of total and higher NAND % of total by 4% from DRAM (77.2%) and NAND (22.8%). Based on the difference in the % breakdown, we calculate a margin impact of 0.8% (23% x 4%). Thus, this impact is still insignificant when compared to the difference between the adjusted margins and our projected margins.
Margins Forecasts
Furthermore, management guided inventory write-downs of $500mln in Q3 2023. Overall, the company expects its profitability to remain weak. However, we expect the company not to continue to have write-downs going forward as larger as it did in Q2FY2023 as we expect market pricing to be supported by lower supply growth than demand as discussed in the above point.
Moreover, the company mentioned that it is taking further measures to improve its operating margins. Following its plans to cut its employee headcount by 10%, the company has expanded its planned cuts to 15% of its workforce.
As market conditions remain weak, we will continue to aggressively manage our expense profile. As Sanjay mentioned, we increased our headcount reduction target to approach 15% from our previous target of approximately 10%. – Mark Murphy, EVP & CFO
Company Data, Khaveen Investments
Overall, we conservatively forecasted the company’s gross margins based on its TTM COGS % of revenue (39.69%) as we expect the company’s gross margins to remain weak in 2023 but we expect the company’s profitability to improve beyond FY2023. However, we forecasted its net margins to improve for the full year at 17.9% compared to 7% for its TTM as the company plans to reduce employee headcount to improve its operating margins and FCF margins at 7.1% for the full year with capex of $7 bln in line with management guidance. Beyond 2023, we forecasted its capex with a rolling 3-year average capex as % of revenue through 2026. To conclude, we verified management reasons and concluded that all the reasons provided by management does not have a significant impact on margins and could still continue to impact the company, thus we forecasted the company’s margins with conservative assumptions.
Risk: High Inventory Among Top Memory Makers
|
Days Inventory Ratio |
2015 |
2016 |
2017 |
2018 |
2019 |
2020 |
2021 |
2022 |
TTM |
Average |
|
Micron |
105.31 |
138.02 |
136.72 |
158.38 |
218.42 |
207.37 |
163.30 |
208.83 |
294.93 |
153.18 |
|
Samsung |
66.31 |
68.49 |
69.72 |
94.49 |
87.98 |
91.15 |
105.32 |
116.03 |
126.20 |
78.94 |
|
SK Hynix |
59.37 |
66.82 |
67.05 |
84.91 |
94.22 |
98.93 |
114.25 |
154.73 |
N/A |
84.72 |
|
Inventory Turnover Ratio |
2015 |
2016 |
2017 |
2018 |
2019 |
2020 |
2021 |
2022 |
TTM |
Average |
|
Micron |
3.47 |
2.64 |
2.67 |
2.30 |
1.67 |
1.76 |
2.24 |
1.75 |
1.24 |
2.60 |
|
Samsung |
5.50 |
5.33 |
5.23 |
3.86 |
4.15 |
4.00 |
3.47 |
3.15 |
2.89 |
5.34 |
|
SK Hynix |
6.15 |
5.46 |
5.44 |
4.3 |
3.87 |
3.69 |
3.19 |
2.36 |
N/A |
4.81 |
Source: Company Data, Morningstar, Khaveen Investments
As mentioned, the inventory of the top memory companies has increased in 2022 for Micron, Samsung and SK Hynix. Thus, we believe this could result in pricing pressure for market pricing with the high levels of inventory despite our expectations of a reduction in supply growth in 2023 and below demands growth. Thus, this could affect Micron’s revenue growth outlook for 2023. Additionally, weaker pricing could further lead to additional inventory write-down and impact gross and net margins.
Valuation
We updated our revenue projections for Micron previously which is based on our forecasted shipment growth of the company and pricing growth based on our market pricing forecasts.
Our updated projections show a 3-year forward average of 5.89%, much lower compared to 18.5% previously as we revised our shipments projections lower with the reduction in our supply growth projections.
|
Micron Revenue Projection ($ bln) |
2020 |
2021 |
2022 |
2023F |
2024F |
2025F |
|
DRAM |
14.51 |
20.04 |
22.39 |
21.03 |
24.07 |
26.13 |
|
Growth % |
38.1% |
11.7% |
-6.1% |
14.5% |
8.5% |
|
|
NAND |
6.13 |
7.01 |
7.81 |
8.38 |
8.91 |
9.85 |
|
Growth % |
14.3% |
11.5% |
7.3% |
6.4% |
10.5% |
|
|
Others |
0.79 |
0.66 |
0.56 |
0.41 |
0.34 |
0.34 |
|
Growth % |
-17.0% |
-14.9% |
-26.7% |
-16.3% |
||
|
Total Revenue |
21.44 |
27.71 |
30.76 |
29.82 |
33.33 |
36.32 |
|
Total Growth % |
29.25% |
11.02% |
-3.05% |
11.77% |
8.97% |
Source: Company Data, Khaveen Investments
Khaveen Investments
Based on a discount rate of 11.2% (company’s WACC), we derived a DCF valuation of $119.96. Factoring in a discount of 30% to account for the Molodovsky Effect as explained in our previous analysis, we obtained a price target of $83.97 for the company with a 23.91% upside.
|
Current Price |
Valuation Price |
Upside |
|
|
Valuation (‘DCF’) |
$ 67.77 |
$ 119.96 |
77.01% |
|
Molodovsky Effect Discount (30%) |
$ 83.97 |
23.91% |
Source: Khaveen Investments
Verdict
In conclusion, we attribute the company’s substantial increase in inventory to a greater decline in demand growth compared to supply growth, particularly in the PC and smartphone end markets, which experienced deterioration during the specified period. We anticipate that the growth in demand to be restricted by the growth in supply, as Micron has further reduced its capex. Additionally, we believe the weakened demand growth has had a significant impact on market pricing, resulting in substantial declines for both DRAM and NAND in 2023, which has consequently affected the company’s financial results for the 2 quarters in FY2023. However, we believe that pricing may stabilize as top memory manufacturers decrease their capital expenditures in 2023, causing supply growth to be even lower than demand growth. Therefore, our pricing outlook remains unchanged, and we continue to expect a recovery and positive growth in pricing based on our long-term pricing model.
Regarding margins, we anticipate that the company’s profitability to be weak in FY2023 compared to the previous year due to the impact of the inventory write-down resulting from the challenging memory markets. However, we expect the company’s profitability to improve beyond FY2023 as market pricing improves. Nevertheless, our updated revenue projections indicate a lower three-year forward average of 5.89%, compared to the previously projected 18.5%. This adjustment takes into account lower DRAM and NAND shipment growth due to reduced supply growth resulting from the company’s capital expenditure reduction aimed at stabilizing market pricing. As a result, we have revised our price target from $113.53 to $83.97. This translates to a Buy rating with a potential upside of 23.9%.
Analyst’s Disclosure: I/we have a beneficial long position in the shares of MU either through stock ownership, options, or other derivatives. I wrote this article myself, and it expresses my own opinions. I am not receiving compensation for it (other than from Seeking Alpha). I have no business relationship with any company whose stock is mentioned in this article.
No information in this publication is intended as investment, tax, accounting, or legal advice, or as an offer/solicitation to sell or buy. Material provided in this publication is for educational purposes only, and was prepared from sources and data believed to be reliable, but we do not guarantee its accuracy or completeness.
Seeking Alpha’s Disclosure: Past performance is no guarantee of future results. No recommendation or advice is being given as to whether any investment is suitable for a particular investor. Any views or opinions expressed above may not reflect those of Seeking Alpha as a whole. Seeking Alpha is not a licensed securities dealer, broker or US investment adviser or investment bank. Our analysts are third party authors that include both professional investors and individual investors who may not be licensed or certified by any institute or regulatory body.