Summary:
- Wall Street analysts have a ‘strong buy’ rating on ABT stock, with 12 out of 24 analysts giving it this rating in the last 90 days.
- We agree with such bullish sentiment.
- Despite some risks, ABT stock has the potential to outperform the overall market by a large margin.
- The key return drivers include its strong growth potential, high ROCE, and a discounted valuation.
Sundry Photography
ABT stock: Wall Street loves it
Readers following our writing know that we are contrarian investors and we usually bet against Wall Street ratings. However, in the case of Abbott Laboratories (NYSE:ABT) stock, we found ourselves in agreement with Wall Street. More specifically, the chart below summarizes the current sentiment on ABT stock from Wall Street analysts (and Seeking Alpha writers too). As seen, Wall Street analysts have a ‘strong buy’ rating on the stock, with 12 out of 24 analysts giving it this rating in the last 90 days. The overall rating is 4.25. Seeking Alpha writers’ ratings are a bit less enthusiastic, but the overall score is a 4.0 and points to a solid buy also.
In the remainder of this article, you will see why we rate the stock as a buy also. Admittedly, the stock faces some risks and profit headwinds (detailed in the last section), but we will argue that A) these risks are relatively minor compared to the positives and B) they have been well compensated already by the discounted valuation of the stock.
ABT stock: a wonderful business at a discount
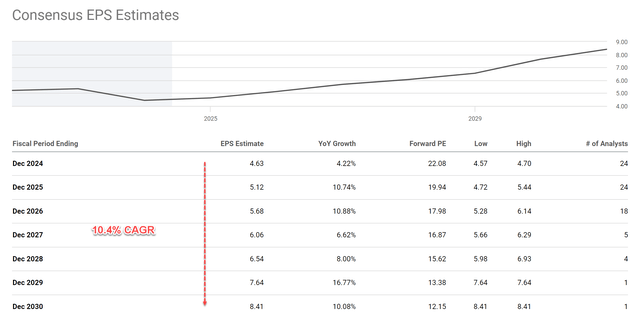
Let me start with the growth outlook and the growth catalysts. The chart below shows the consensus EPS estimates for ABT stock in the next 6 years. As seen, analysts predict ABT’s EPS to grow at a compound annual growth rate (“CAGR”) of 10.4% over the next 6 years. This translates to an EPS growth from $4.63 in fiscal year 2024 to about $8.41 by fiscal year 2030.
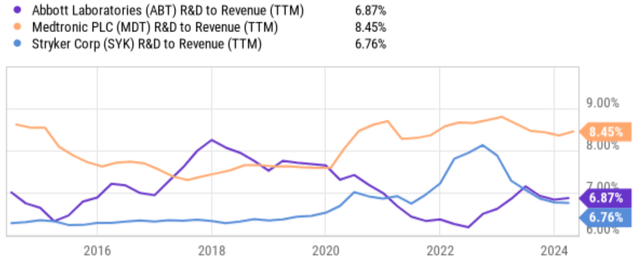
Given the unique strength of ABT’s business model, I am very optimistic about such a growth outlook. Two key factors that differentiate ABT from other healthcare product companies in my view are its diversified product lineup and its focus on innovation. Unlike many peers focused on specific areas like pharmaceuticals or medical devices, ABT boasts a diversified portfolio across diagnostics, medical devices, pharmaceuticals, and nutrition. This spread mitigates risk by reducing dependence on the success of any single product or therapy area. ABT also consistently invests heavily in research and development (see the next chart below). This enables a steady pipeline of new products and technologies, allowing ABT to stay ahead of the curve in a rapidly evolving healthcare landscape.
Thanks to this combination of strong current lineup and pipeline, ABT is well-positioned for long-term growth and there are plenty of profit drivers afoot. Notable examples in our view include its diabetes care products, electrophysiology, neuromodulation, and structural heart segments.
The company has also launched quite a few new products, including Amplatzer, Amulet, Navitor, TriClip, and AVEIR. We are optimistic about the success of these new products given the company’s past track record. Last but not least, we consider FreeStyle Libre to be a strong driver for its longer-term growth curve. This popular glucose monitoring system is one of the most successful assets in the diabetes care space in our view. It’s also ABT’s most profitable product, accounting for about 15% of the company’s top line. FreeStyle Libre has been enjoying robust growth (sales during the first quarter of 2024 grew more than 22% year over year). We expect the momentum to continue given its user base and the unique features.
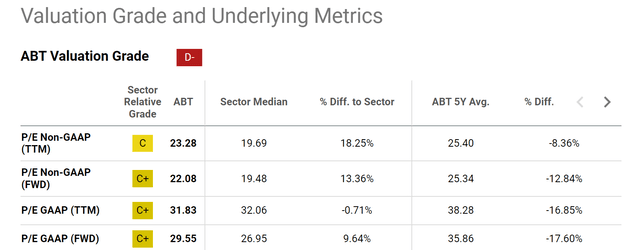
Despite the robust growth outlook, the stock is priced at a discount in our view. If you recall from the chart above, the forward P/E ratio for ABT is about 22x and is expected to fall rapidly as its EPS grows (to 12.15x only by 2030). Admittedly, the current FWD of 22x could feel a bit off-putting when compared to the sector median (of about 19.5x). But we think the premium is well justified given the strength of the business. Given the differentiating factors just mentioned, our view is that it makes better sense to compare its current P/E against its own historical average, which indicates a sizable discount of about 13% in terms of FWD non-GAAP P/E.
Next, we will better contextualize the valuation by comparison to the broader market.
ABT stock: valuation assessment and projected returns
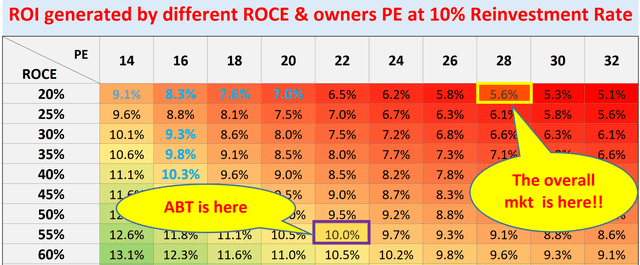
The following chart anchors its valuation (and also projected return) under current conditions against the overall market. The concepts behind this chart have been detailed in our free blog article. The key concepts involved here are the ROCE (return on capital employed) and owner’s earning yield (“OEY”) as recapped below:
- The long-term ROI for a business owner is simply determined by two things: A) the price paid to buy the business and B) the growth rate of the business (which reflects its quality and moat).
- More specifically, part A is determined by the owner’s earning yield (“OEY”) when we purchased the business. Part B is determined by the ROCE and RR (reinvestment rate) in the long term.
- That is, Longer-Term ROI = OEY + Growth Rate = OEY + ROCE*Reinvestment Rate
- For ABT, we are approximating its OEY with the earning yield to be on the conservative side. At its current FY1 P/E of 22x, ABT offers an OEY of ~5%.
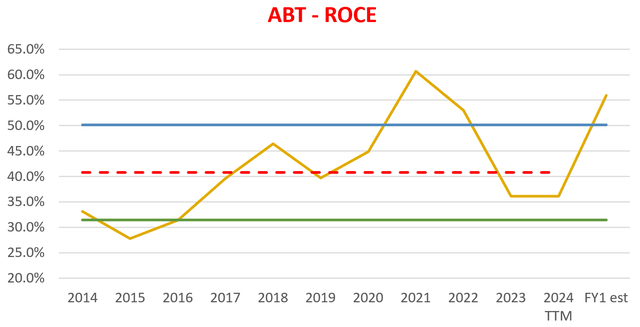
In the meantime, ABT has been maintaining an average ROCE of ~41% (see the second chart below) in the long term, in contrast to the ~20% level from the overall market. In the meantime, the overall market is also priced at a higher P/E (the SP500 is priced at about 28x P/E as of this writing). Given the superior ROCE and lower P/E multiple, we anticipate the total annual return potential from ABT to be close to double-digits, compared to mid-single digits from the overall market.
Other risks and final thoughts
In terms of downside risks, ABT shares many common risks with its healthcare peers. First, both ABT and its competitors face the challenge of navigating the ever-evolving regulatory landscape for drugs and medical devices. Regulatory hurdles can delay product approvals and hinder revenue growth (e.g., FDA regulations). Additionally, both ABT and its peers must contend with constant pressure on healthcare costs, which is not only a business issue, but also often viewed as a sensitive political issue. Such pressure can lead to price controls and reduced reimbursements.
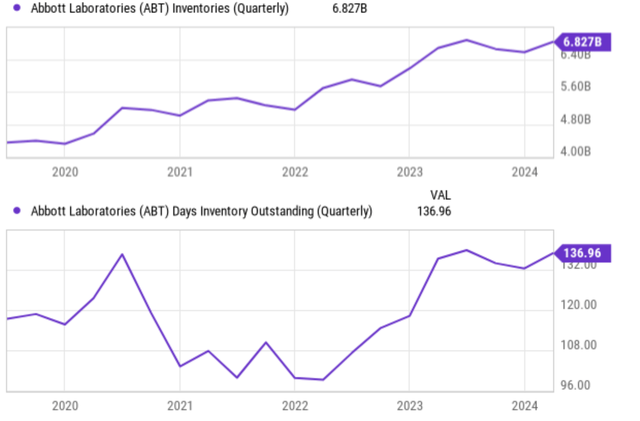
Although we see some risks more specific to ABT. The first one involves the lingering weakness in the Diagnostics segment, where sales continue to be hurt by waning demand for Abbott’s COVID-19 test kits. In the long run, we consider this a temporary headwind only and also an issue that should be expected. We suppose no investors seriously expected the demand to sustain at the levels seen during the pandemic. The inventories are another sign of concern as you can see from the chart below both in terms of dollar amount and also days of inventory outstanding. Such an elevated inventory could add cost pressure and balance sheet risks in the near term.
All told, our verdict is that the positives outweigh the negatives. We consider ABT as a compelling opportunity for investors seeking long-term total returns. Analysts predict a steady rise in EPS at a CAGR of over 10% for the years to come. We agree with this robust projection, considering its diversified business model and a robust pipeline of new products. Furthermore, ABT’s current P/E ratio sits below its historical average by a good margin, suggesting the stock may be undervalued. This combination of strong growth potential, high ROCE, and a discounted valuation positions ABT well to deliver market-beating returns.
Analyst’s Disclosure: I/we have no stock, option or similar derivative position in any of the companies mentioned, and no plans to initiate any such positions within the next 72 hours. I wrote this article myself, and it expresses my own opinions. I am not receiving compensation for it (other than from Seeking Alpha). I have no business relationship with any company whose stock is mentioned in this article.
Seeking Alpha’s Disclosure: Past performance is no guarantee of future results. No recommendation or advice is being given as to whether any investment is suitable for a particular investor. Any views or opinions expressed above may not reflect those of Seeking Alpha as a whole. Seeking Alpha is not a licensed securities dealer, broker or US investment adviser or investment bank. Our analysts are third party authors that include both professional investors and individual investors who may not be licensed or certified by any institute or regulatory body.
Join Envision Early Retirement to navigate such a turbulent market.
- Receive our best ideas, actionable and unambiguous, across multiple assets.
- Access our real-money portfolios, trade alerts, and transparent performance reporting.
- Use our proprietary allocation strategies to isolate and control risks.
We have helped our members beat S&P 500 with LOWER drawdowns despite the extreme volatilities in both the equity AND bond market.
Join for a 100% Risk-Free trial and see if our proven method can help you too. You do not need to pay for the costly lessons from the market itself.

