Summary:
- Thermo Fisher and Abbott are two of our key Healthcare holdings in our fund, and both are among our top 10 holdings overall.
- Abbott and Thermo Fisher focus on different industries which are Healthcare Equipment and Life Science Tools respectively.
- Both show strong revenue growth compared to the market average growth rate which indicates that both companies exhibit competitive advantages within their respective main markets.
- This analysis compares both companies in terms of Revenue Growth and Exposure, Financial Position and Profitability, Leadership Position in Respective Markets, and Valuation.
Sean Anthony Eddy
In our analyses, we covered Abbott Laboratories’ (NYSE:ABT) geographically diverse revenues and increasing focus on its cardiovascular market segment expansion with a high TAM CAGR of 16.56%. Whereas in our last analysis of Thermo Fisher Scientific Inc. (NYSE:TMO), we highlighted its PPD acquisition which was expected to contribute 14% to its 2022 revenue.
In this analysis, we compared Thermo Fisher with Abbott as both companies are our two key Healthcare holdings in our portfolio, and both are among our top 10 holdings. Abbott represents the largest company in Healthcare Equipment with a market cap of $161 bln while Thermo Fisher is the largest company in Life Sciences Tools and services with a market cap of $170 bln. We compared the company in terms of its revenue growth and exposure by comparing its segments and performance as well as its geographical revenue breakdown. Moreover, we compared the companies based on their financial position, including their net debt as well as liquidity and credit analysis. We also compared the companies in terms of their profitability by analyzing their earnings and margins as well as their cash flow. Finally, we compared the companies in terms of their competitive positioning in life science tools and healthcare equipment to determine which company has a stronger competitive advantage in their respective industries.
Revenue Growth and Exposure
Revenue Growth
|
Historical Revenue Growth |
Thermo Fisher |
Abbott |
|
Revenue (Q3 2023 TTM) ($ bln) |
43,421 |
39,959 |
|
TTM Growth % |
-1.7% |
-8.5% |
|
5-year Average |
16.74% |
10.05% |
|
10-year Average |
14.00% |
9.08% |
Source: Company Data, Khaveen Investments
Based on the table, Thermo Fisher has a stronger growth track record in terms of revenue growth compared to Abbott. Thermo Fisher’s past 5-year and 10-year growth rates outpace Abbott’s. In Q3 2023 TTM, both companies experienced slowing and negative revenue growth with Abbott performing worse than Thermo Fisher.
In our previous analysis, we highlighted the reason for the lower growth outlook of Abbott in 2022 as “due to the lower Covid revenue expected”. In Q3 2023 YTD, its Covid-related revenue declined by 82% YoY compared to the same period last year. This brings its Covid-related revenue decreasing from 22% to 12.9% of its total revenue. Excluding its Covid-related revenue, management highlighted that organic sales “increased double digits” in its latest earnings briefing, indicating its growth excluding Covid-related revenues remained healthy.
Similarly, Thermo Fisher also experienced a decline in revenue in Q3 2023 TTM but with a milder decline of 1.7%. The company highlighted its lower growth in its Life Sciences Solutions segment was “driven predominantly by the run-off of our pandemic-related revenue in the segment” as well as in its Specialty Diagnostics segment due to lower Covid testing revenues. Besides that, the company also attributed its performance to macroeconomic weaknesses such as “cautious customer spending and low economic activity in China” but stated that the industry’s long-term outlook remained “remain as bright as ever”.
Overall, Thermo Fisher has had a superior growth track record despite the short-term growth headwinds.
Revenue Breakdown
We compiled both companies’ revenue breakdowns by segment and consolidated their revenue breakdown by industry in the table below. For Thermo Fisher, we categorized its revenue segments into Health Care Equipment & Supplies (Specialty Diagnostics) and Life Sciences Tools & Services (Laboratory Products and Biopharma Services, Life Sciences Solutions and Analytical Instruments segments). Whereas for Abbott, we categorized its revenue segments into Health Care Equipment & Supplies (Diagnostics and Medical Devices) and Pharmaceuticals (Established Pharmaceuticals and Nutritionals). We forecasted their 2023 revenues based on their prorated Q1 to Q3 2023 segment growth rates and compiled the estimated revenue breakdown in 2023 and 6-year average growth for each industry.
|
Revenue Breakdown and Growth by Industry (2023F) |
Thermo Fisher Revenue Breakdown % |
Abbott Revenue Breakdown % |
Thermo Fisher 6-year Average Growth |
Abbott 6-year Average Growth |
Market Forecast CAGR |
|
Health Care Equipment & Supplies |
9.6% |
66.2% |
5.2% |
9.6% |
5.90% |
|
Life Sciences Tools & Services |
90.4% |
0% |
14.6% |
N/A |
10.80% |
|
Pharmaceuticals |
0% |
33.8% |
N/A |
2.9% |
5.80% |
|
Total |
100.0% |
100.0% |
13.0% |
10.1% |
Source: Company Data, Fortune Business Insights, Grand View Research, Statista, Khaveen Investments
From the table above, Abbott derives the majority (66.2%) of its total revenue from the Health Care Equipment & Supplies industry compared to Thermo Fisher which only has 9.6% of its revenue from the industry. On the other hand, Thermo Fisher derives the majority of its revenue from Life Sciences Tools & Services at 90.4% of its total revenue. Thus, this highlights that Abbott has a greater focus on the Healthcare Equipment & Supplies industry as it is the majority of its revenue exposure compared to Thermo Fisher. Besides that, Abbott’s average revenue growth in Healthcare Equipment & Supplies is superior compared to Thermo Fisher and the market growth. Factoring out Covid revenues ($1.5 bln) from our 2023 revenue estimates, we calculated the segment still grew at an impressive 6-year CAGR of 7.4%. Conversely, Thermo Fisher focuses on Life Sciences Tools & Services with 90% of revenues and its revenue growth is higher than the market forecast CAGR.
We believe both Abbott and Thermo Fisher are tied in terms of their revenue breakdown comparison as both companies are specialized in the healthcare equipment and supplies and life sciences tools & services industries respectively and both had superior growth compared to the market CAGR and Abbott had higher growth in healthcare equipment and supplies compared to Thermo Fisher.
Geographical Breakdown
Company Data, Khaveen Investments Company Data, Khaveen Investments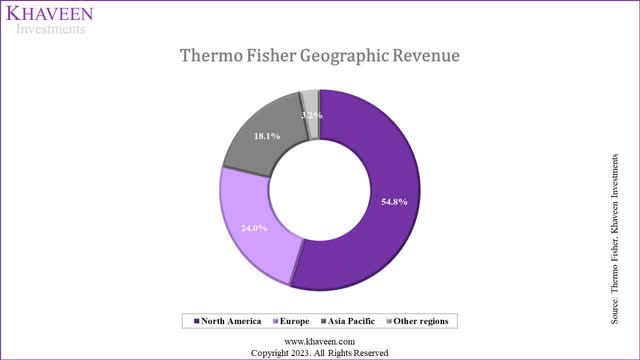
|
Revenue by Geographic Region (2022) |
Thermo Fisher % Breakdown |
Abbott % Breakdown |
Thermo Fisher Growth Average (5-year Average) |
Abbott Growth Average (5-year Average) |
Combined Average |
|
North America |
54.8% |
44.5% |
19.7% |
13.7% |
16.7% |
|
Europe |
24.0% |
8.4% |
15.9% |
9.2% |
12.6% |
|
Asia Pacific |
18.1% |
9.3% |
11.8% |
3.5% |
7.6% |
|
Other regions |
3.2% |
37.8% |
18.4% |
7.4% |
12.9% |
Source: Company Data, Khaveen Investments
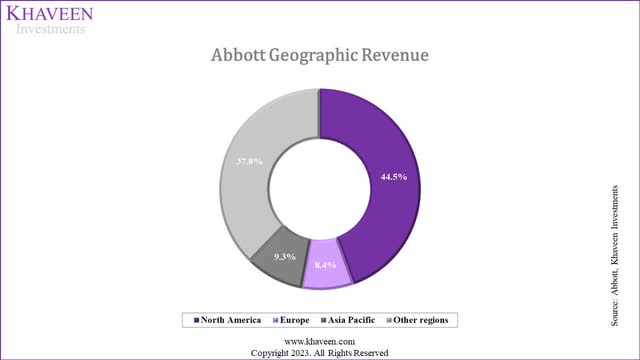
Based on the table comparing the geographic revenue breakdown, the region with the highest average growth was North America which was the largest geographic region in terms of revenue contribution for both companies, but Thermo Fisher has a larger contribution from the North American region compared to Abbott thus we believe Thermo Fisher edges out Abbott.
Revenue Projections
|
Thermo Fisher Revenue Projections ($ mln) |
2022 |
2023F |
2024F |
2025F |
2026F |
2027F |
|
Life Sciences Tools & Services |
42,667 |
40,433 |
42,132 |
47,457 |
52,979 |
58,615 |
|
Growth % |
16.7% |
-5.2% |
4.2% |
12.6% |
11.6% |
10.6% |
|
Health Care Equipment & Supplies |
4,763 |
4,309 |
4,203 |
4,378 |
4,538 |
4,681 |
|
Growth % |
-15.8% |
-9.5% |
-2.4% |
4.2% |
3.7% |
3.2% |
|
Eliminations |
-2,515 |
-2,462 |
-2,462 |
-2,462 |
-2,462 |
-2,462 |
|
Total |
44,915 |
42,280 |
43,873 |
49,372 |
55,055 |
60,834 |
|
Growth % |
14.5% |
-5.9% |
3.8% |
12.5% |
11.5% |
10.5% |
Source: Company Data, Khaveen Investments
As mentioned above, we forecasted Thermo Fisher’s full-year 2023 revenues by segments based on its prorated Q3 2023 YTD revenue growth rates. In 2024, amid the macroeconomic headwinds facing the company, we conservatively forecast its revenues for Life Sciences Tools & Services and Health Care Equipment & Supplies by assuming its revenues in the first half to decline at a similar rate in 2023 before recovering in the second half of the year, where we forecasted its revenues based on its Life Sciences Tools & Services and Health Care Equipment & Supplies 6-year average growth rate of 14.6% and 5.2% respectively but tapering down by 1% and 0.5% for each segment. Beyond that, we continued to taper down its segment by 1% and 0.5% per year through 2027. Our conservative assumption for 2023 is in line with management guidance that expects “a more challenging first half and then moderate growth in the second half”.
|
Abbott Revenue Projections ($ mln) |
2022 |
2023F |
2024F |
2025F |
2026F |
2027F |
|
Health Care Equipment & Supplies |
31,271 |
25,973 |
26,556 |
28,390 |
30,209 |
31,993 |
|
Growth % |
4.2% |
-16.9% |
2.2% |
6.9% |
6.4% |
5.9% |
|
Pharmaceuticals |
12,371 |
13,264 |
13,655 |
14,056 |
14,470 |
14,896 |
|
Growth % |
-4.9% |
7.2% |
2.9% |
2.9% |
2.9% |
2.9% |
|
Others |
11 |
11 |
11 |
11 |
11 |
11 |
|
Total |
43,653 |
39,249 |
40,222 |
42,458 |
44,690 |
46,900 |
|
Growth % |
1.3% |
-10.1% |
2.5% |
5.6% |
5.3% |
4.9% |
Source: Company Data, Khaveen Investments
Similarly, we forecasted Abbott’s full-year 2023 revenues by segments based on its prorated Q3 2023 YTD revenue growth rates. In 2024, we forecasted its Health Care Equipment & Supplies based on our calculated CAGR of 7.4% of its Health Care Equipment & Supplies revenues excluding Covid and assuming its Covid revenues, which is estimated at $1.5 bln by management in 2023, to continue declining by 82%, which results in a growth rate of 2.2%. From 2024 onwards, we based it on our CAGR of 7.4% but tapered down by 0.5% per year. Moreover, we based its Pharmaceutical revenue growth on its past 6-year average of 2.9% through 2027 which is well below the market forecast CAGR of 5.8%.
To sum it up, we derived a 5-year forward average growth of only 1.6% for Abbott and 6.5% for Thermo Fisher, thus we believe Thermo Fisher is superior with a higher growth outlook based on our projections.
Summary
|
Revenue Growth and Exposure |
Outperformer |
|
Revenue Growth |
Thermo Fisher |
|
Revenue Breakdown |
Tie |
|
Geographical Breakdown |
Thermo Fisher |
|
Revenue Projections |
Thermo Fisher |
|
Overall |
Thermo Fisher |
Source: Company Data, Khaveen Investments
All in all, we identified that Abbott focuses more on the Healthcare Equipment industry while Thermo Fisher focuses on life science tools as they derived the majority of revenues from these industries and had superior revenue growth compared to the market CAGR.
We believe that as both Thermo Fisher and Abbott had superior growth compared to the market growth in each of their main markets, we believe both companies are tied in terms of revenue breakdown exposure. However, we believe Thermo Fisher edges out Abbott in terms of geographical revenue exposure with a higher breakdown to the North American region which had the highest average growth combined compared to all other regions.
As both companies had higher growth relative to their respective main markets in life science tools for Thermo Fisher and healthcare equipment for Abbott, we believe these companies have specific competitive advantages in those respective industries. Thus, we forecasted them to grow based on their segments’ historical average instead of the market forecast CAGR due to their company-specific competitive advantages for Thermo Fisher in life science tools and Abbott in healthcare equipment at a forward average of 6.5% and 1.6% respectively. Thus, we believe that Thermo Fisher is better than Abbott overall in revenue growth and exposure.
Financial Position and Profitability
In this section, we then examined the financial position of Abbott and Thermo Fisher based on their net debt, credit analysis and liquidity analysis. We then examined the financial position of Abbott and Thermo Fisher based on their profitability margins such as gross, EBIT, net margins ROA, ROE and ROCE. We also compared them based on an expense analysis. Moreover, we analyzed their cash flows.
Net Debt
|
Thermo Fisher Net Debt (Net Cash) |
2013 |
2014 |
2015 |
2016 |
2017 |
2018 |
2019 |
2020 |
2021 |
2022 |
TTM |
|
Debt |
14,316 |
21,483 |
18,662 |
23,442 |
29,828 |
27,031 |
26,786 |
32,360 |
51,279 |
49,625 |
49,170 |
|
Cash & Cash Equivalents |
5,831 |
1,344 |
452 |
786 |
1,335 |
2,103 |
2,399 |
10,325 |
4,477 |
8,524 |
6,151 |
|
Net Debt (Net Cash) |
8,485 |
20,140 |
18,210 |
22,656 |
28,493 |
24,928 |
24,387 |
22,035 |
46,802 |
41,101 |
43,019 |
|
Cash to Debt Ratio |
0.4x |
0.1x |
0.02x |
0.03x |
0.04x |
0.1x |
0.1x |
0.3x |
0.1x |
0.2x |
0.1x |
Source: Company Data, Khaveen Investments
|
Abbott Net Debt (Net Cash) |
2013 |
2014 |
2015 |
2016 |
2017 |
2018 |
2019 |
2020 |
2021 |
2022 |
TTM |
|
Debt |
16,660 |
18,504 |
18,840 |
30,771 |
42,750 |
33,476 |
33,334 |
35,599 |
34,764 |
32,926 |
31,739 |
|
Cash & Cash Equivalents |
8,098 |
4,460 |
6,125 |
18,775 |
9,610 |
4,086 |
4,140 |
7,148 |
10,249 |
10,170 |
8,155 |
|
Net Debt (Net Cash) |
8,562 |
14,044 |
12,715 |
11,996 |
33,140 |
29,390 |
29,194 |
28,451 |
24,515 |
22,756 |
23,584 |
|
Cash to Debt Ratio |
0.5x |
0.2x |
0.3x |
0.6x |
0.2x |
0.1x |
0.1x |
0.2x |
0.3x |
0.3x |
0.3x |
Source: Company Data, Khaveen Investments
In terms of net debt comparison, both companies’ net debt had increased over the past 10 years with Thermo Fisher having a much higher net debt than Abbott. In 2021 in particular, its net debt increased significantly as it acquired PPD for $17.4 bln. In 2017, Abbott acquired St. Jude Medical for $23.6 bln. Additionally, both companies’ cash-to-debt ratios are fairly close and had decreased slightly over the period in Q3 2023 TTM. Overall, we believe both Abbott and Thermo Fisher are tied in terms of net debt.
Liquidity Analysis
|
Liquidity Analysis (5-year Average) |
Thermo Fisher |
Abbott |
|
Cash Ratio |
0.51x |
0.57x |
|
Quick Ratio |
1.19x |
1.08x |
|
Current Ratio |
1.75x |
1.65x |
|
Debt-To-Assets |
0.52x |
0.53x |
|
Debt-To-Equity |
1.04x |
1.02x |
|
Financial Leverage |
2.11x |
2.13x |
Source: Company Data, Khaveen Investments
In terms of liquidity, Thermo Fisher and Abbott have very close cash, quick and current ratios. Regarding leverage, their debt-to-assets, debt-to-equity ratios and financial leverage ratios are nearly identical. Overall, both companies maintain stable financial positions and we believe both companies are tied in terms of our liquidity analysis.
Credit Analysis
|
Credit Analysis (5-year Average) |
Thermo Fisher |
Abbott |
|
EBIT interest coverage |
14.53x |
13.46x |
|
EBITDA interest coverage |
19.89x |
19.93x |
|
CFO interest coverage |
15.12x |
16.45x |
|
FCF interest coverage |
3.31x |
12.60x |
|
EBITDA/Total Debt |
0.24x |
0.26x |
|
EBITDA/Net Debt |
0.31x |
0.38x |
Source: Company Data, Khaveen Investments
From the table above, Thermo Fisher has a higher average EBIT interest coverage compared to Abbott. Both companies have strong EBITDA interest coverage. However, Abbott holds a slight advantage in CFO interest coverage. However, in FCF interest coverage, Abbott’s ratio is notably higher than Thermo Fisher’s as Thermo Fisher has lower FCF margins due to its 5 acquisitions in the past 5 years. In ratios related to debt and EBITDA, Thermo Fisher and Abbott are closely comparable. Thus, we believe that Abbott edges out Thermo Fisher slightly in terms of our credit analysis as the company despite its ratios being similar to Thermo Fisher except with CFO interest coverage where it is superior to Thermo Fisher.
Profitability Ratios
|
Average |
Thermo Fisher (5-years) |
Abbott (5-years) |
|
Gross Margin |
46.21% |
57.69% |
|
EBIT Margin |
20.46% |
17.09% |
|
Net Margin |
16.30% |
12.92% |
|
ROA |
8.2% |
6.8% |
|
ROE |
17.2% |
15.0% |
|
ROCE |
11.9% |
10.6% |
Source: Company Data, Khaveen Investments
Thermo Fisher’s solid profitability is evident in its average gross margin of 46.21%, though Abbott surpasses Thermo Fisher with a higher average of 57.69%. However, Thermo Fisher has a higher average EBIT and net margin compared to Abbott. In Q3 2023 TTM, Thermo Fisher’s net margin decreased but remained higher than Abbott’s (13.7% vs 12.9%). Thermo Fisher also has a higher 5-year average ratio for ROA, ROE, and ROCE. Thus, despite the lower gross margins, we believe Thermo Fisher edges out Abbott in terms of profitability with higher operating, net margins, ROA, ROE and ROCE. Furthermore, based on analysts’ consensus, both Abbott and Thermo Fisher have higher EPS growth projections than revenue growth for the next 4 years except 2023. Thus, we believe this highlights the positive margin growth outlook for both companies.
Expense Analysis
|
Expense Analysis (% of revenue) |
Thermo Fisher (5-years) |
Abbott (5-years) |
|
COGS (excluding D&A) |
45.9% |
33.2% |
|
Depreciation & Amortization |
7.9% |
9.1% |
|
R&D |
3.7% |
7.0% |
|
SG&A |
22.0% |
27.9% |
|
Other Expenses (Income) |
0.0% |
5.7% |
|
Interest |
-1.5% |
-1.5% |
Source: Company Data, Khaveen Investments
Thermo Fisher consistently has lower 5-year average expense as percentages of revenue than Abbott across key categories: Cost of Goods Sold (45.9% vs. 33.2%), Depreciation and amortization (7.9% vs. 9.1%), Research and Development (3.7% vs. 7.0%), and Selling, General, and Administrative expenses (22.0% vs. 27.9%). This suggests operational efficiency and superior cost management by Thermo Fisher as we identified in our previous analysis that Thermo Fisher has lower operating expenses including R&D and SG&A as % of revenue when compared to 9 of its large competitors. Abbott, however, reports higher Other Expenses (Income) (5.7% vs. 0.0%). Overall, we believe Thermo Fisher demonstrates better expense management and edges out Abbott.
Efficiency Analysis
|
Efficiency Analysis |
Thermo Fisher (5-years) |
Abbott (5-years) |
|
Receivables Turnover |
5.34x |
6.25x |
|
Payables Turnover |
6.97x |
3.39x |
|
Inventory Turnover |
3.84x |
2.64x |
|
Days Sales Outstanding (days) |
68.56 |
58.63 |
|
Days Payables Outstanding (days) |
52.43 |
107.68 |
|
Days Inventory Outstanding (days) |
95.20 |
138.89 |
|
Cash conversion Cycle (days) |
111.34 |
89.84 |
Source: Company Data, Khaveen Investments
In terms of efficiency, Thermo Fisher’s receivables turnover and inventory turnover ratios are superior to Abbott’s. However, Abbott’s superior payables turnover (and shorter cash conversion cycle highlight its efficiency in managing payments. Overall, we believe Abbott edges out Thermo Fisher with a lower cash conversion cycle.
Cash Flows
|
Average |
Thermo Fisher (5-years) |
Abbott (5-years) |
|
Depreciation as % of Fixed Assets |
5.0% |
6.2% |
|
CapEx as % of Fixed Assets |
11.7% |
3.5% |
|
CapEx as % of Revenue |
15.3% |
5.0% |
|
Adjusted CapEx as % of Revenue |
4.5% |
4.9% |
|
Adjusted CapEx as % of Fixed Assets |
2.7% |
3.5% |
|
Free Cash Flow Margin |
5.99% |
16.46% |
Source: Company Data, Khaveen Investments
Abbott demonstrates stronger profitability with an average FCF margin of 16.46% compared to Thermo Fisher’s 5.99%. Thermo Fisher has a lower Depreciation/Fixed Assets ratio but higher CapEx/Fixed Assets, and more substantial CapEx/Revenue ratios. Thermo Fisher’s expansion is evident through its acquisitions over the past five years, while Abbott made two acquisitions during the same period. Moreover, Thermo Fisher has completed 44 acquisitions and spent $69 bln since 2006 according to BioProcess International and management plans to spend another $40 bln to $50 bln for M&A “in the upcoming years” which highlights its acquisition strategy. Recently, Thermo Fisher announced its planned acquisition of Olink for $3.1 bln and is expected to generate $200 mln in revenue in 2024. Overall, we believe Abbott edges out Thermo Fisher with superior cash flow margins due to its lower capex compared to Thermo Fisher despite lower net margins.
Summary
|
Financial Position and Profitability |
Outperformer |
|
Net Debt |
Tie |
|
Liquidity Analysis |
Tie |
|
Credit Analysis |
Abbott |
|
Profitability Ratios |
Thermo Fisher |
|
Expense Analysis |
Thermo Fisher |
|
Efficiency Analysis |
Abbott |
|
Cash Flows |
Abbott |
|
Overall |
Abbott |
Source: Company Data, Khaveen Investments
All in all, we believe that Abbott edges out Thermo Fisher slightly in Financial Position and Profitability with superior credit, efficiency and cash flow margins compared to Thermo Fisher despite it having superior profitability and expense management. We identified that Thermo Fisher has an acquisition strategy as indicated by its significantly lower FCF margins compared to Abbott despite higher net margins as the company’s capex as % of fixed assets and revenue are both over 3 times higher than Abbott. Additionally, its adjusted capex (excluding acquisitions and investments) % of fixed assets and revenue are similar to Abbott but its total capex % of revenue and fixed assets are higher than Abbott which indicates that the company has higher acquisition or investment spending. Moreover, the company has completed twice as many deals as Abbott in the past 5 years, plans to invest $40 to 50 bln in future mergers and acquisitions and has announced an upcoming acquisition of Olink which could support its revenue growth outlook.
Leadership Position in Respective Markets
From the first point, we identified that both companies’ growth in the industries that each company focuses on was superior compared to the overall market CAGR. In this section, we examine the competitive positioning of Thermo Fisher and Abbott in the life science tools and healthcare equipment industries to determine which company has a market leadership advantage in their respective markets.
Market Share
Company Data, Statista, Khaveen Investments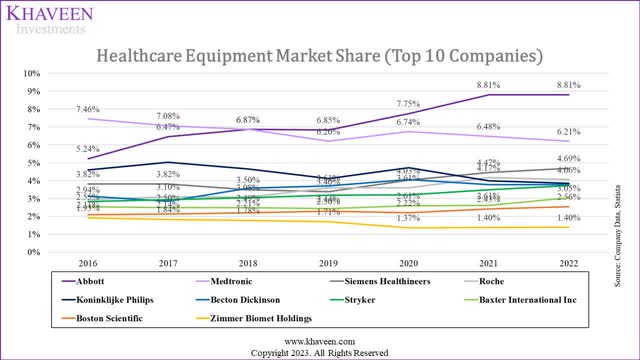
Based on our market share chart of the healthcare equipment industry, Abbott retains its dominant position in the healthcare equipment market with an 8.8% share in 2022, consistent with the previous year. Over the last 7 years, Abbott’s market share has grown, surpassing Medtronic (MDT) as the leader in 2019.
One of the strengths of Abbott is it has a broad portfolio of new innovative products that encompasses medical devices, diagnostics, and nutrition, health and wellness. These include the company’s FreeStyle Libre continuous glucose monitoring system. In our previous analysis, we highlighted the company’s strength and one of the only 3 companies with CGM systems and it dominates the market with a 53% market share as well as its product advantages such as it “reduces the yearly cost of monitoring sugar levels by 62% while also providing real-time data to patients” and is also cheaper compared to competing products. In 2022, the diabetes care segment accounted for 15% of its Healthcare Equipment revenue with a high market forecast CAGR of 17.2% compared to the overall industry. Moreover, we highlighted the company’s plans for its product pipeline with its single chamber device and “first rapid handheld blood test for concussions” which had received FDA clearance in 2023.
Company Data, Grand View Research, Khaveen Investments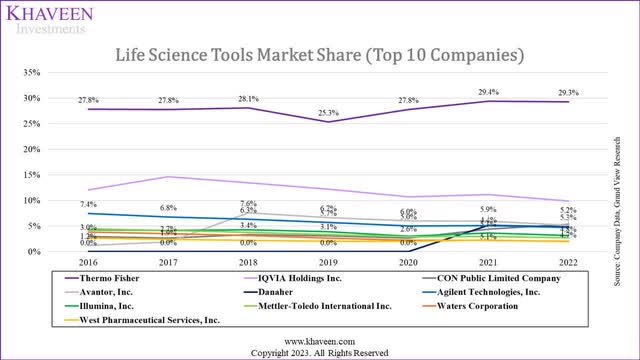
Over the period from 2016 to 2022, Thermo Fisher maintained a dominant position, with a minor dip in 2019 but rebounding in 2022. Danaher (DHR) entered the market in 2021 with a sudden jump in share, while IQVIA’s (IQV) market share gradually decreased.
Some of the strengths of Thermo Fisher include its strategic acquisitions to expand its product range and solidify its market position. As mentioned above, the company has made 44 acquisitions since 2006 and indicated its plans to continue pursuing more M&A activity of between $40 bln to $50 bln as seen with its recent Olink acquisition. Moreover, another strength of the company is its diverse portfolio, encompassing a wide array of products ranging from equipment and consumables to reagents and software. According to GlobalData, Thermo Fisher had 1,464 total patent publications in 2022 which is 20 times higher compared to the second-placed IQVIA of 72 total patent publications.
Summary
|
Market Share |
Abbott |
Thermo Fisher |
Outperformer |
|
Market Share |
8.81% |
29.3% |
Thermo Fisher |
|
Market Concentration |
42.15% |
69.0% |
Thermo Fisher |
|
Gap Between Second Largest Player |
2.60% |
19.4% |
Thermo Fisher |
|
Market Leadership |
4 years |
7 years |
Thermo Fisher |
|
Market Share Gains |
3.58% |
1.5% |
Abbott |
|
Overall |
Thermo Fisher |
Source: Company Data, Khaveen Investments
Overall, we believe Thermo Fisher is superior to Abbott in terms of market share. This is because Thermo Fisher’s market share in the life science tools market is much higher than Abbott which highlights its stronger market positioning. Moreover, the life science tools market is more concentrated compared to the healthcare equipment market with the top ten companies accounting for 69% of the market share combined for the life science tools market compared to 42% for the healthcare equipment market thus boding well for Thermo Fisher. Furthermore, the gap between the market leader and the trailing company is larger in the life science tools market compared to the healthcare equipment with a share difference of 19.4% between Thermo Fisher and IQVIA compared to only 2.6% between Abbott and Medtronic. In terms of market leadership, Thermo Fisher maintained its leadership position in the past 7 years while competition is fiercer in healthcare equipment with Abbott overtaking Medtronic only in 2019. However, Abbott had been gaining share more rapidly in healthcare equipment compared to Thermo Fisher in life science tools. Therefore, we believe Thermo Fisher edges out Abbott in terms of market share.
Risk: Short-Term Market Headwinds
As mentioned above, Thermo Fisher highlighted market growth headwinds with macroeconomic weaknesses such as “cautious customer spending and low economic activity in China” from its latest earnings briefing. Management expects market headwinds to persist in 2024 in the first half of the year with a market recovery expected in the second half. Furthermore, Abbott also highlighted it expects “some macro environment challenges as companies head into 2024”. Therefore, we believe market growth headwinds are one of the key risks to both companies. Notwithstanding, we conservatively forecasted their growth in 2024 as explained in the first point.
Valuation
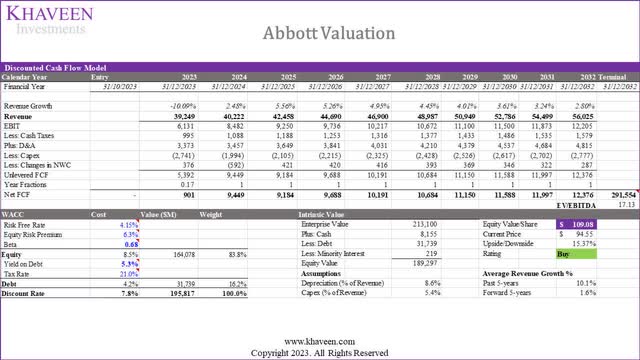
Based on a discount rate of 7.8% (company’s WACC), we obtained an upside of 15.4% for Abbott with the terminal value based on the top 10 Healthcare Equipment companies’ average EV/EBITDA of 17.13x.
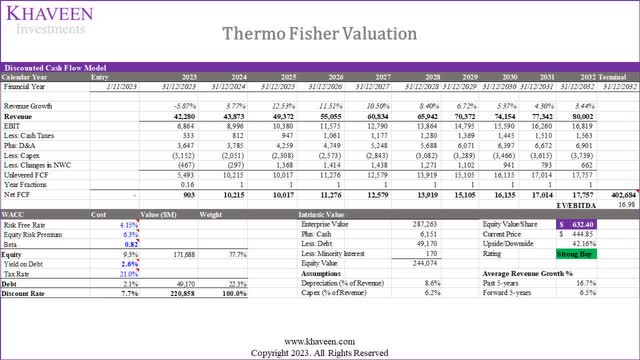
Based on a discount rate of 7.7% (company’s WACC), we obtained an upside of 42% for Thermo Fisher with the terminal value based on the top 10 Life Science Tools & Services companies’ average EV/EBITDA of 16.98x (excluding Illumina due to its anomalous EV/EBITDA of 73.7x.
|
Factor |
Outperformer |
|
Valuation |
Thermo Fisher |
Source: Khaveen Investments
Verdict
|
Factor |
Outperformer |
|
Revenue Growth and Exposure |
Thermo Fisher |
|
Financial Position and Profitability |
Abbott |
|
Leadership Position in Respective Markets |
Thermo Fisher |
|
Valuation |
Thermo Fisher |
|
Overall |
Thermo Fisher |
Source: Khaveen Investments
Based on the table above, we compiled our analysis for each factor, we believe Thermo Fisher emerges as the stronger company as it leads in categories such as revenue growth, geographical breakdown, revenue projections, profitability ratios, expense analysis, market share, market concentration, the gap between the second largest player and market leadership.
In summary, Abbott and Thermo Fisher focus on different industries which are Healthcare Equipment and Life Science Tools respectively with both showing strong revenue growth compared to the market average growth rate which indicates that both companies exhibit competitive advantages within their respective main markets. Moreover, we identified Thermo Fisher’s acquisition strategy as seen with its lower free cash flow margins and higher capex compared to Abbott as well as company expectations of more M&A in the future. Furthermore, we believe Thermo Fisher’s market share dominance in the life science tools industry surpasses Abbott’s position in healthcare equipment, indicating a stronger market presence. Additionally, we believe Thermo Fisher’s consistent leadership and share gains in its market give it an overall advantage, while Abbott’s rapid share growth in healthcare equipment is noteworthy. Additionally, both Thermo Fisher and Abbott’s stock price had declined by 19% and 14% YTD. Based on our updated DCF valuation, we maintain our rating on Thermo Fisher as a Strong Buy with a price target of $632.40 and Abbott as a Buy with a target price of $109.08.
Analyst’s Disclosure: I/we have a beneficial long position in the shares of TMO, ABT either through stock ownership, options, or other derivatives. I wrote this article myself, and it expresses my own opinions. I am not receiving compensation for it (other than from Seeking Alpha). I have no business relationship with any company whose stock is mentioned in this article.
No information in this publication is intended as investment, tax, accounting, or legal advice, or as an offer/solicitation to sell or buy. Material provided in this publication is for educational purposes only, and was prepared from sources and data believed to be reliable, but we do not guarantee its accuracy or completeness.
Seeking Alpha’s Disclosure: Past performance is no guarantee of future results. No recommendation or advice is being given as to whether any investment is suitable for a particular investor. Any views or opinions expressed above may not reflect those of Seeking Alpha as a whole. Seeking Alpha is not a licensed securities dealer, broker or US investment adviser or investment bank. Our analysts are third party authors that include both professional investors and individual investors who may not be licensed or certified by any institute or regulatory body.

