Summary:
- To value Amazon on a sum-of-the-parts basis, we need to deconsolidate the income and cash flow statement.
- Amazon is giving us the necessary tools for this task in the separate segment reporting.
- While I have no concerns regarding AWS, I have concerns about the declining core gross margin for the retail segment.
- I estimate AWS to be worth around $720 billion and the retail segment around $210 billion.
- I rate Amazon a hold and will reevaluate my thesis sometime next year to check if management delivered on the promise to improve core gross margins.
Sundry Photography
Introduction
This will be my first article on one of the big tech companies, Amazon (NASDAQ:AMZN). Amazon is one of those companies I only followed by looking at the earnings releases and reading some articles on SA without ever taking the time to take a deeper look at the operations. I only saw constant revenue growth with close to no profits, resulting in price-to-earnings ratios in the high double or low triple digits. I thought that the cloud segment, AWS, was a great business and I would probably take a deeper look if it would ever be spun off. The rest of Amazon’s businesses never appealed to me. I felt like it would never really turn any profits because the last-mile fulfillment is just too unprofitable.
The valuations of the past didn’t make any sense to me. Now that Amazon is off close to 50% from its all-time high, I decided to finally take a deeper look at it and want to share my findings and opinion in this article.
How to look at Amazon
Amazon consists of two separate companies, AWS and what I will call “Amazon retail” throughout this article. Amazon itself describes the segments as followed:
We have organized our operations into three segments: North America, International, and AWS. We allocate to segment results the operating expenses “Fulfillment,” “Technology and content,” “Sales and marketing,” and “General and administrative” based on usage, which is generally reflected in the segment in which the costs are incurred. The majority of technology infrastructure costs are allocated to the AWS segment based on usage.
Amazon 10-K: Note 10 – Segment Information
“Amazon retail” is, by my definition, the sum of the North America and the International segment. An important takeaway from this quote is that the majority of technology infrastructure costs are allocated to the AWS segment. I will come back to this later in this article.
I have seen SA articles where fellow authors did a sum-of-the-parts valuation and valued more than two segments. I think the problem is that you can’t really put a multiple on the advertising sales, then another one on prime subscriptions, and close with “I will just value the remaining retails sales with a P/S of X.” Amazon prime subscriptions need the marketplace. The advertising revenues need the marketplace. The whole Amazon ecosystem is so connected that AWS is the only segment you could just spin off as a separate company without any problems in my view.
So what I will do is try to value Amazon as two separate businesses. The problem with this task is accounting. Amazon accounts for all segments on a consolidated basis. In the notes to the financial reports (Segment Information), Amazon gives us more insights on some metrics for the separate segments. Here are, in my opinion, the important metrics Amazon is giving us separately for each segment:
(1) Net sales
(2) Operating expenses
(3) Operating income (loss)
(4) Net sales by group
(5) Property and equipment by segment
(6) Net additions to property and equipment by segment
(7) Depreciation and amortization by segment
I will use all of the aforementioned metrics and divide the income statement and the cash flow statement as best as I can to value the two companies separately.
So let’s get started.
Financials
I will work through several metrics one by one. In the end, I will conclude with two separate income statements and free cash flow calculations. I will also briefly address returns on capital and the balance sheet.
Revenues
I will start with two charts:
Revenue by segment (Amazon 10-K reports)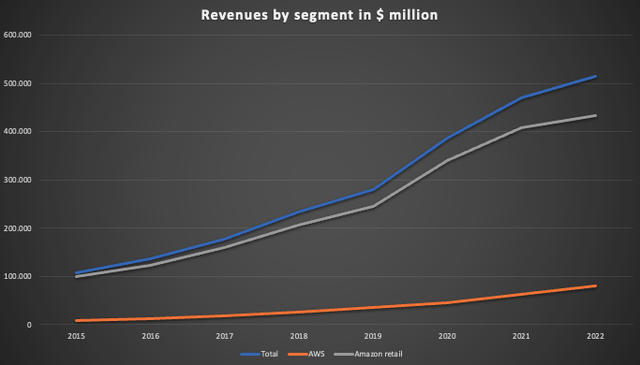
In the first chart, we can see that both segments’ revenue has been constantly growing since 2015.
Revenue as % of total revenue (Amazon 10-K reports)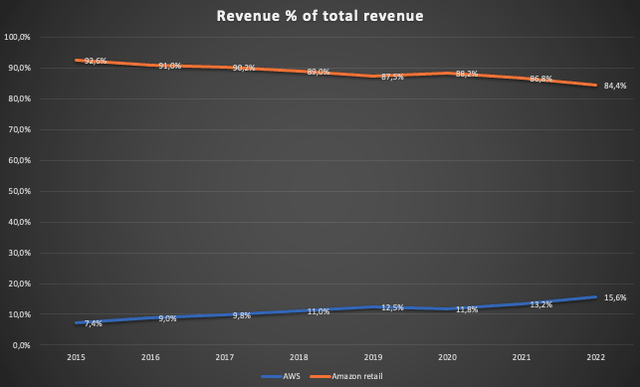
In the second chart, we can see that AWS sales as % of total sales more than doubled since 2015. This is a good sign because the AWS segment is far more profitable than the Amazon retail segment which should lead to improving profitability on a consolidated level.
The most important thing though is where Amazon retail sales are coming from. This can be seen in the following chart:
Author Note: I estimated Advertising revenue from 2015-2018 because Amazon only started to disclose this number in 2019.
Amazon retail revenue sources (Amazon 10-K reports)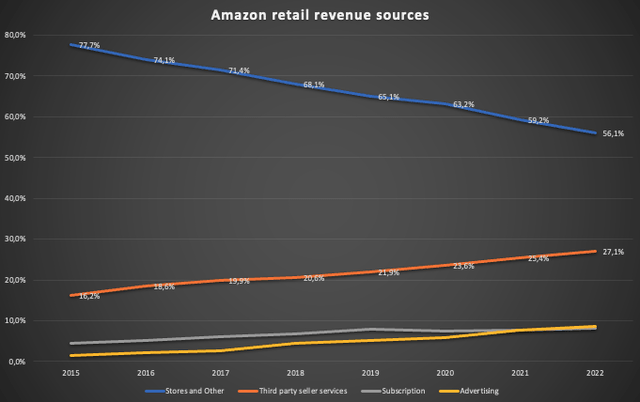
This is where it gets interesting and this is also where the main case for the Amazon bulls lies. The online and physical store % of sales is declining while the third-party seller services, the prime subscription revenues and the advertising revenues share of total revenues are steadily rising. These three sources of revenue should be much more profitable and lead to the whole Amazon retail segment becoming much more profitable over time. To check this we need to take a look at the operating income and margins.
EBIT and EBIT Margin
I will start again with a simple chart showing the EBIT for both segments since 2015:
EBIT by segment (Amazon 10-K reports)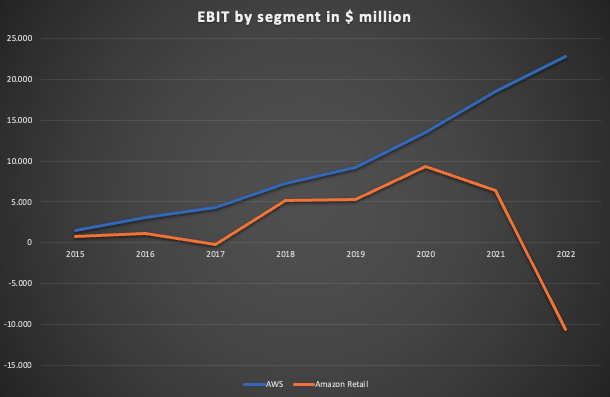
We can see that the aforementioned assumption of growing profitability for the Amazon retail segment was correct until 2020. EBIT declined a bit for 2021 and then turned deeply negative in 2022. AWS on the other hand is doing well, as expected.
Here is another chart showing the EBIT margins for both segments:
EBIT margins by segment (Amazon 10-K reports)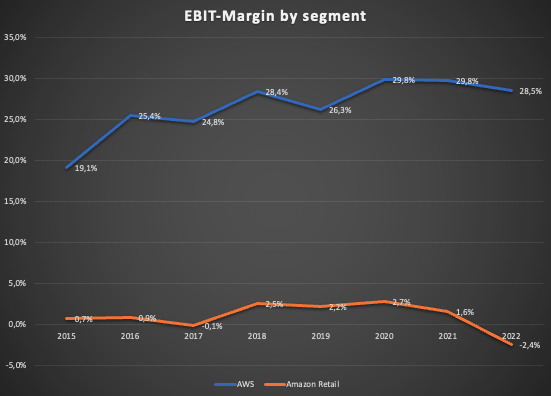
AWS’s margin has been rising (with minor setbacks) while the Amazon retail margin rose until 2020 for a peak margin of 2.7% in 2020 before it started to decline.
Now the main questions we need to answer regarding the Amazon retail segment are:
(1) What caused this decline in profitability?
(2) Is the base assumption of rising profitability (as a result of increased revenue contribution from third-party seller services, subscription and advertising) still intact?
I will address both of these questions throughout this article.
Operating Expenses
To understand what is going on with the profitability of the Amazon retail segment we need to take a closer look at the sources of operating expenses (OPEX). The chart below shows the costs as % of sales on a consolidated level:
OPEX as % of sales – consolidated (Amazon 10-K reports)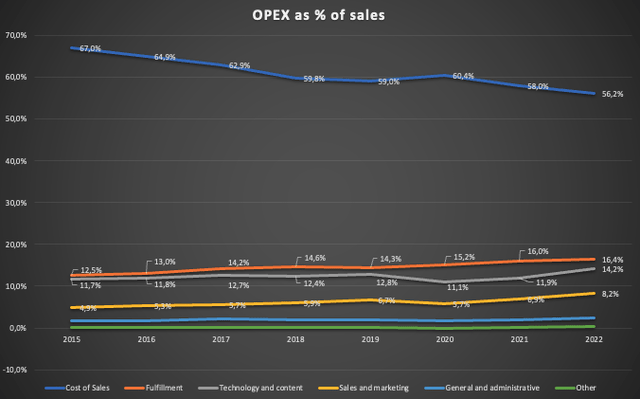
The key takeaway here is that the costs of sales have been steadily declining while fulfillment, technology/content and sales/marketing (S&M) costs have been rising. This fits into the picture of AWS sales making up a bigger part of consolidated revenue (less cost of sales and no fulfillment costs) and the revenue share of third-party seller services (no costs of sales) rising. To figure out what exactly happened to the margins of the Amazon retail segment we need to deconsolidate the income statement.
Breaking it up into two income statements
I will first outline my assumptions.
I wasn’t able to find any information on AWS gross margins. Amazon’s biggest competitor Microsoft (NASDAQ:MSFT) stated the following in the last 10-K report:
Microsoft Cloud gross margin percentage decreased slightly to 70%. Excluding the impact of the change in accounting estimate, Microsoft Cloud gross margin percentage increased 3 points driven by improvement across our cloud services, offset in part by sales mix shift to Azure and other cloud services.
Microsoft 10-K: Part II – Item 7 “Fiscal Year 2022 Compared with Fiscal Year 2021”
Amazon and Microsoft are the biggest players in the cloud market. I will assume that AWS gross margins should be close to those mentioned by Microsoft and estimate the costs of sales for AWS at 30% of revenue.
Fulfillment costs for AWS should be zero. I will assume that S&M, general and administrative (G&A) and other costs are equal to the % of AWS’s share of consolidated revenue. The remaining OPEX (which is by far the largest part of OPEX) should be made up of technology & content costs. This fits the quote in the introduction which I will repeat here:
The majority of technology infrastructure costs are allocated to the AWS segment based on usage.
Amazon 10-K: Note 10 – Segment Information
Bringing it together, here is the estimated income statement for AWS I came up with (in $million):
Estimated AWS income statement 2015-2022 (Author estimates off disclosed segment information)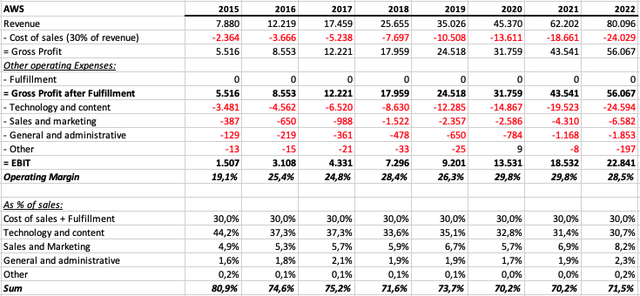
As we can see AWS has been doing great. Margins expanded and revenue growth was excellent. This is a true quality and compounding business.
Since we got these numbers, we can conclude what the Amazon retail income statement should look like. Here is my estimated Amazon retail income statement (in $million):
Estimated Amazon retail income statement 2015-2022 (Author estimates off disclosed segment information)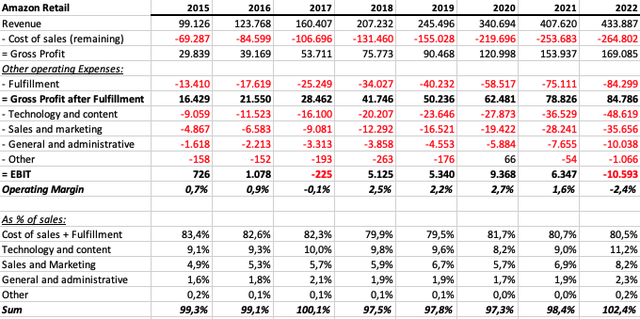
This is where it gets interesting. First of all, we can see that the sharp decline in profits in 2021 and 2022 was not caused by rising costs of sales and fulfillment costs, but by a sharp increase in technology and content, S&M, and G&A costs. This can be seen as a good sign because it indicates that the core business without “optional” spending can be profitable.
One thing that concerns me though is that when we factor out advertising revenue from Amazon retail total revenue and compare it to the costs of sales and fulfillment, the core gross margin has declined. Here are the numbers (in $million):
Adjusted costs of sales & fulfillment as % of revenue (Author estimates off disclosed segment information)
Excluding advertising revenues, Amazon retail core gross margin (revenue excluding advertising revenue – costs of sales – fulfillment costs) declined from around 15% in 2015 to 12% in 2022. While advertising belongs to the Amazon retail business and is an important part of the bull thesis on Amazon, it looks like for now it is just being used to subsidize increasing costs of sales and fulfillment costs. The main question is if/when this trend will stop and what happens then. With declining product sales (as % of total sales) and increasing third-party seller service revenue, Amazon needs to get the core gross margin back to levels of the past.
One thing that stands out is that the core gross margin actually improved until 2019 and only started to deteriorate from 2020 onwards. In the recent 4th quarter FY2022 earnings call, there was a statement from Amazon’s SVP & CFO Brian Olsavsky that indicates that my estimated numbers are on point:
But essentially, we’re now trying to, again, regain our cost structure that we’ve had in the past, balance the — and get more efficient on the assets we’ve added in the last 2, 3 years now and also look at all the investment areas that we are working on to drive growth, continuing to look at them where we need to make course corrections, where we need to change things up. And we expect that, again, a lot of the improvement will be in North America operations costs. We made good headway in 2022. We always want to make more, and we’re going to be working on this definitely through 2023 and beyond. But we hope to make and expect to make big improvements in 2023.
Amazon CFO Brian Olsavsky – Amazon 4th quarter FY2022 earnings call
This indicates that Amazon is well aware that core gross margins deteriorated starting in 2020 (2-3 years ago). The market realized this and the stock declined accordingly. Amazon needs to work on this. This will be the main value driver for the Amazon retail segment in the upcoming quarters and years.
As of now, rising advertising revenue is the only thing keeping Amazon retail from going into deep negative margin territory. I guess that once Amazon shows signs of achieving improving core gross margins, the valuation of the Amazon retail segment will increase dramatically, even if they keep spending big on S&M and technology and content. I have to admit though that I have concerns if Amazon will be able to achieve this in the first place. This is something you need to decide for yourself.
Cash-flow statements
Next, I want to turn to the cash-flow statements. To start with, let’s take a look at the consolidated cash-flow statement (in $million):
| FY | 2015 | 2016 | 2017 | 2018 | 2019 | 2020 | 2021 | 2022 |
| Operating Cashflow (OpCF) | 12,039 | 17,203 | 18,365 | 30,723 | 38,514 | 66,064 | 46,327 | 46,752 |
| less: Stock-based compensation | 2,119 | 2,975 | 4,215 | 5,418 | 6,864 | 9,208 | 12,757 | 19,621 |
| = Adjusted OpCF | 9,920 | 14,228 | 14,150 | 25,305 | 31,650 | 56,856 | 33,570 | 27,131 |
| less: CAPEX | 5,387 | 7,804 | 11,955 | 13,427 | 16,861 | 40,140 | 61,053 | 63,645 |
| = Free-Cash-Flow (FCF) | 4,533 | 6,424 | 2,195 | 11,878 | 14,789 | 16,716 | -27,483 | -36,514 |
Note that I treat stock-based compensation (SBC) as a cash expense since it should belong to the “cash from financing activities”. We can see that Amazon has been, on a consolidated basis, FCF positive until 2020. The FCF was deeply negative in 2021 and 2022.
Amazon is giving us numbers for Net property and equipment additions by segment in the segment reporting. By dividing the segment net additions by the total net additions we can conclude a % of CAPEX for each segment. Here are the numbers (in $million):
Net property and equipment additions by segment (Amazon 10-K reports)
The AWS share of net additions to property and equipment has been around 30-50% in the past. The share of net additions for the retail segment has been exceptionally high in 2020 and 2021 due to the buildout of the logistic network. Since Amazon also reports depreciation and amortization for each segment, we can do a bottom-up calculation to estimate AWS FCF. I estimate that the % of CAPEX for AWS is the same as the % of the net addition to property and equipment in the table above. Here are the numbers (in $million):
| FY | 2015 | 2016 | 2017 | 2018 | 2019 | 2020 | 2021 | 2022 |
| AWS EBIT | 1,507 | 3,108 | 4,331 | 7,296 | 9,201 | 13,531 | 18,532 | 22,841 |
| less: 21% tax rate | 316 | 653 | 910 | 1,532 | 1,932 | 2,842 | 3,892 | 4,797 |
| add: depreciation and amortization | 2,576 | 3,461 | 4,524 | 6,095 | 8,158 | 7,603 | 10,653 | 9,876 |
| less: CAPEX | 2,620 | 2,983 | 3,689 | 5,240 | 7,335 | 11,445 | 18,611 | 29,037 |
| = AWS FCF | 1,147 | 2,933 | 4,257 | 6,619 | 8,092 | 6,848 | 6,682 | -1,116 |
I know these numbers are not 100% accurate because they don’t take into account some items and changes in working capital but in my opinion, this should give a good estimate for the segment’s FCF.
The difference between the AWS FCF to the consolidated FCF has to be the Amazon retail FCF. For a clearer view, here is a chart with the results:
Overview of segment’s FCF 2015-2022 (Author estimates off disclosed segment information)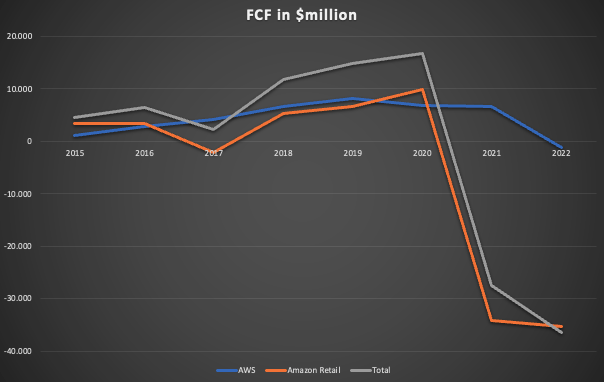
Now, this might look alarming at first sight. However, I am not concerned because I know that most of this is a result of huge CAPEX and most of this CAPEX should be growth CAPEX. The fact that Amazon thinks they are still able to reinvest profits at a high rate of return is actually a good sign.
Return on Capital
This leads me to the next part of the financials which is the return on capital. Amazon discloses the total amount of property & equipment for each segment. By dividing the segment’s EBIT by the total amount of property & equipment we can get an estimate of the returns on capital for both segments. Here are the numbers:
Property & Equipment and Return on Capital by segment (Amazon 10-K reports)
Here we can see again that AWS is an outstanding business since it is able to generate consistently high returns on capital. Amazon retail on the other side generates very low and volatile returns on capital, indicating that it is a mediocre business (from an investor’s, not from a customer’s view).
This is the reason for what I wrote in the introduction. I would love to own a part of the AWS business but it only comes in a package with the retail business which I don’t want to own.
Balance sheet
Amazon spent big on CAPEX over the last few years. Especially in 2021 and 2022, FCF was deeply negative. The balance sheet has taken the hit as can be seen in the chart below (numbers in $million):
Amazon net debt 2018-2022 (Tikr Terminal)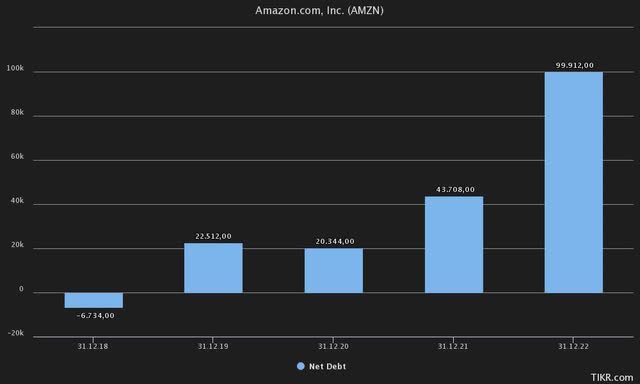
Amazon’s net debt rose by close to $80 billion from the end of FY2020 to the end of FY2022. This is not a good sign because of rising interest expenses. Furthermore, the fact that management itself acknowledges that the investments over the past 3 years (which were debt-funded) have led to deteriorating core gross margins is a sign of bad capital allocation. I highly doubt that Amazon will be able to keep spending as they have been in the past. This might also be positive though since FCF will likely turn positive again.
Valuation
Next, I want to turn to valuation. If I have to buy a part of the retail business that I don’t want to own, the price must be right. I will value the segments separately.
AWS
First, we need to look at historic cash conversion rates. Cash conversion is defined as FCF divided by net income. Taking the numbers from the charts above results in the following chart:
AWS Cash conversion 2015-2022 (Author estimates as outlined above)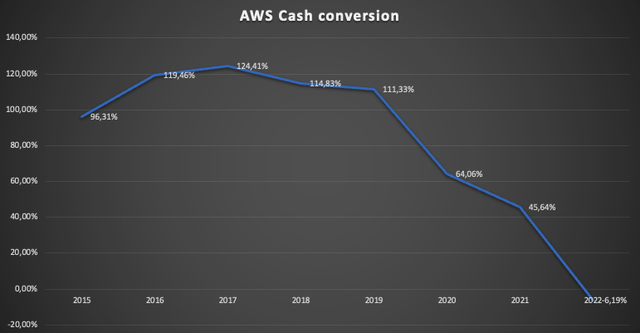
Again, we can see that from 2020 onwards things changed. CAPEX increased dramatically. Since the return on capital didn’t deteriorate, this is not an issue in my opinion. As long as AWS is able to reinvest heavily into the business at returns on capital well above 30%, I am completely fine with low cash conversion rates because I know that most of the CAPEX are growth CAPEX and not maintenance CAPEX.
Now we need to assume future growth rates. In the recent 4th quarter FY2022 earnings release (page 14), AWS YoY revenue growth for the 4th quarter slowed to 20%. Statista estimates the public cloud market to grow with a CAGR of close to 14% from 2023 to 2027. A study by Fortune business insights estimates the global cloud computing market to grow with a CAGR of close to 20% until 2029. Let’s just assume a CAGR at the mid-point, so 17% until 2029. I will put the perpetual growth rate at 6% as I usually do for companies that generate sustained high returns on capital. In this case, we would need to value $1 of AWS FCF at $49.84, as can be seen below:
AWS DCF (moneychimp.com)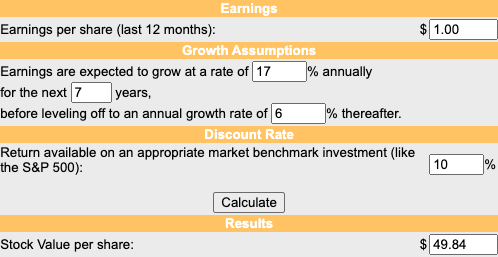
So AWS should be worth around 50 times FCF, with no doubt a high multiple. Now how high do we assume the cash conversion rate? With AWS EBIT of $22.8 billion for FY2022, net income should amount to around $18 billion (assuming a 21% tax rate). So the value of AWS would be:
(a) $900 billion at 100% cash conversion rate
(b) $720 billion at 80% cash conversion rate
(c) $540 billion at 60% cash conversion rate
I think that if AWS wants to sustain high growth rates over the next years it has to keep CAPEX high as it did in the past three years. The time of cash conversion rates of 100% and above is gone. The rate of 60% seems too low to me because that would mean AWS has to keep spending huge amounts on CAPEX which will be difficult. After all, as I already outlined above, the balance sheet deteriorated quite a bit from the massive CAPEX over the past few years with net debt amounting to close to $100 billion already.
80% cash conversion and a valuation of $720 billion would value AWS at around 31 times EBIT and 40 times net earnings. While still high, these seem like reasonable multiples for such a high-quality company in a fast-growing market that generates consistently high returns on capital.
In conclusion, I guess that AWS should be worth somewhere around $720 billion.
Amazon retail
I won’t even try to make the needed estimates for a DCF valuation because I am simply not confident to make any projections regarding growth or cash conversion rates. I will just use a multiple approach for the whole segment instead.
FY2022 EBIT margin for Amazon retail was -2.4%. I already outlined everything regarding margins in the “Financials” section of this article. I will be rather bullish here and expect the core gross margin I outlined earlier to get back to the past level of 15%, an improvement of 300 basis points (I still have some doubts here).
I will assume another 100bps of improvement from cutting back S&M expenses to 7.2% of sales (from the current 8.2%) which would be more in line with S&M spending of the past.
Finally, I will assume another 100bps improvement by cutting back technology and content, and G&A costs. I expect spending on content to stay higher than in the past because Amazon needs to keep investing in the prime subscription benefits to justify price increases and retain members. This should be important because Amazon prime benefits compete with a lot of streaming services and I think that this space will become much more competitive in the future.
So putting it together would result in a 500 basis points improvement in EBIT margin and put the EBIT margin at 2.6%, just 10 basis points below the all-time high margin reached in 2020. With FY2022 sales of $513,983 million, this would result in around $13.35 billion EBIT. After taxes, there would be around $10.5 billion in net income left. Note that neither here nor at AWS did I factor in interest expenses from the $100 billion of net debt. Assuming a 20 times earnings multiple would put the value of the Amazon retail segment at around $210 billion. Even if I would be really bullish and assume a 25 times earnings multiple here, Amazon retail would still only be worth around $264 billion according to my estimates.
Valuation conclusion
At the time of this writing, Amazon is trading at $98.95 per share. At the end of the 4th quarter of FY2022, there were 10,308,000,000 shares outstanding, putting the total market capitalization to $1,020 billion.
I assume AWS to be worth around $720 billion and the Amazon retail segment around $210 billion. In conclusion, Amazon as a whole should be worth somewhere around $930 billion. This doesn’t factor in any interest expenses on the $100 billion net debt or any potential sum-of-the-parts/holding discount.
I think Amazon as a whole is currently overvalued by around 10%.
Risks and what to look out for
I normally list around 2-3 risks to my thesis/assumptions. In this case, there is only one thing to look out for and this is the development in the EBIT margin of the Amazon retail segment. Management acknowledged that the investments over the past 2-3 years were very inefficient and led to deteriorating margins. I outlined my view on the “core gross margin” of the Amazon retail segment. This will be the main indicator to watch out for in the upcoming years.
My assumption for the valuation was that Amazon will be able to reach the core gross margins of the past and be able to improve cost efficiencies by cutting back on S&M and mainly G&A costs. If Amazon manages to improve its core gross margin to levels that are even better than in the past, my thesis would need to change because the Amazon retail segment would be worth much more (an additional 150 basis points improvement would already increase the Amazon retail value by over 50%). This could also backfire on the other side though. I think that my assumptions are rather bullish. So if Amazon shows signs that they are not able to improve core gross margins, the Amazon retail segment should be worth much less than my estimate.
Long story short, the main risk is that I am wrong regarding the future development of the core gross margin. This would change my thesis either to the downside or to the upside.
Conclusion
I believe valuing Amazon as a whole, with a sum-of-the-parts approach is the way to go. However, there are only two companies to value: AWS and Amazon retail in my view.
While AWS is a high-quality business and I have no concerns regarding its future, I have concerns regarding the retail segment. Operating margins for the retail segment deteriorated over the past 2-3 years because the investments made during the pandemic were very cost-inefficient and led to a drop in core gross margin (retail revenue excluding advertising revenue – cost of sales – fulfillment costs) for the retail segment. While the management already identified this issue and promised to work on this matter in the future, I have concerns if they will be able to achieve improving core gross margins.
Even with my, in my opinion, rather bullish assumptions, I estimate Amazon as a whole to be worth around $930 billion which is below the current market capitalization of $1,020 billion. My valuation doesn’t include interest expenses from the rising net debt ($100 billion at 2022 year-end) or a sum-of-the-parts/holding discount.
I rate Amazon as a hold at the current price of $98.95 per share and will probably reevaluate my thesis sometime next year to check if management was able to deliver on their promises for improvements in 2023.
Disclosure: I/we have a beneficial long position in the shares of MSFT either through stock ownership, options, or other derivatives. I wrote this article myself, and it expresses my own opinions. I am not receiving compensation for it (other than from Seeking Alpha). I have no business relationship with any company whose stock is mentioned in this article.
Additional disclosure: Disclaimer: Any material in this article should not be relied on as a formal investment recommendation. Never buy a stock without doing your own thorough research.
