Summary:
- Amazon.com, Inc.’s ROIC has returned to positive territory, settling at 12.99% with a 3-year median of 10.91%.
- The effective tax rate and net income have impacted Amazon’s capital efficiency and growth.
- Amazon’s liquidity is strong, with an interest coverage ratio of 174x, surpassing the average for non-bank companies in the S&P 500.
Daria Nipot
The Amazon Investment Thesis
Seeking Alpha Rating History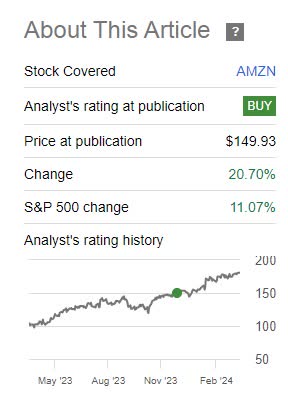
Since the last time I wrote about Amazon.com, Inc. (NASDAQ:AMZN), the company has outperformed the S&P 500 Index (SP500) by nearly twice as much. At the time, I wrote that ROIC was rising and would likely return to its former strength. This has been confirmed and the positive trend seems to be continuing.
I also believe that the ROIC numbers are better than they appear at first glance because they are currently impacted by factors that are historically lower. Therefore, I think Amazon is still a good candidate if you think long-term and want to beat the market.
Amazon’s Capital Allocation
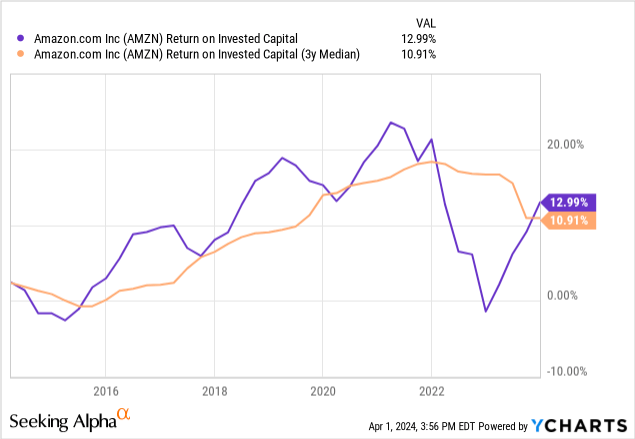
After being negative for a short period of time, ROIC is now positive again and has settled at 12.99% and a 3-year median of 10.91%. The reason for the negative ROIC in 2022 is that Amazon’s net income was negative in 2022, so the NOPAT was not as strong as usual.
For illustrative purposes, here is the standard NOPAT formula used to calculate ROIC:
NOPAT = (Net Income + Non-Operating Losses – Non-Operating Gains +Interest Expense +Taxes) x(1 – Tax Rate).
Return on Invested Capital = NOPAT ÷ Average Invested Capital
But the level at the end of 2021 is still relatively far away, and that is because the effective tax rate is higher than it was then. On December 21, it was 12.6%, currently, it is 19%, and NOPAT is net operating profit after tax. So the tax rate matters. Moreover, net income in December 2023 is still smaller than in December 2021, at $30 billion versus $33 billion. However, as I strongly believe that net income will increase again and the tax rate will decrease again, ROIC will probably continue to increase.
But because invested capital has continued to grow, as shown by Net PPE on the balance sheet, Amazon’s capital efficiency is lower than it was then.
- Net PPE December 2021: $216b.
- Net PPE December: 2023: $276b.
SG&A expenses also continued to increase during this period, resulting in higher invested capital. But especially in the highly competitive online shopping space, SG&A is important to retain customers, and Amazon also needs to invest in R&D to stay competitive for its other businesses.
And secondly, there are always life cycles. And in some of them, you have to invest more in order to be better positioned for the long term.
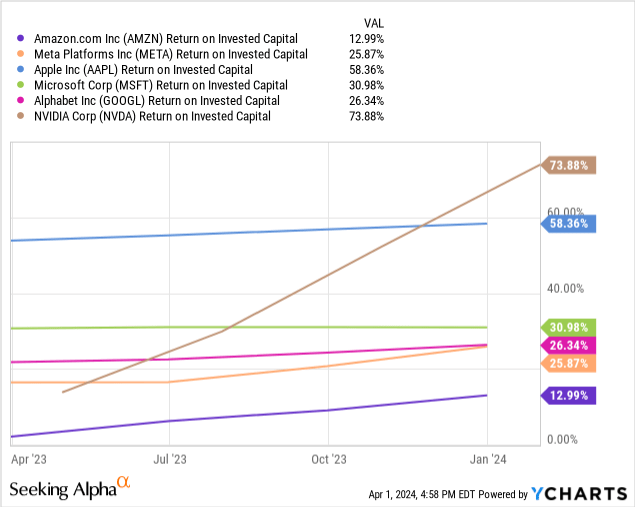
So I think the comparison to other companies that have a similar market cap to Amazon is not the right one, because the other companies are in industries that generally have a higher ROIC. One major disadvantage of Amazon is that it does a lot of business in different currencies, which can easily distort its revenue growth. And some of the other companies have higher barriers to entry, which also has a positive impact on competitive advantage and ROIC.
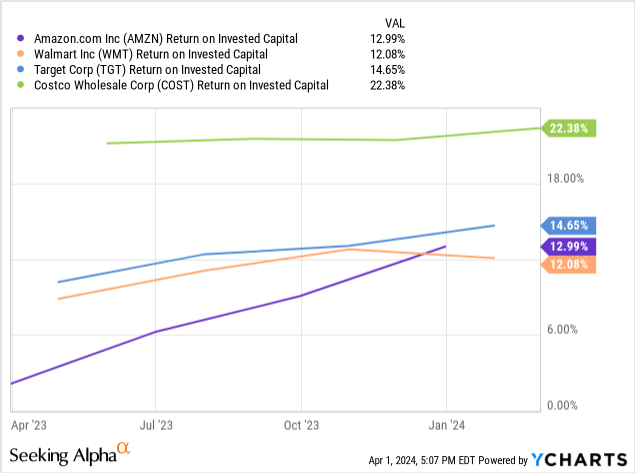
Therefore, I think a peer comparison with Walmart Inc. (WMT), Target Corporation (TGT), and Costco Wholesale Corporation (COST) is more appropriate. And here Amazon is tied with its competitors Walmart and Target, but Costco has an edge that is also reflected in Costco’s valuation. But many investors have recognized that Costco is a very efficient steward of its capital, and the stock has performed very well in recent years.
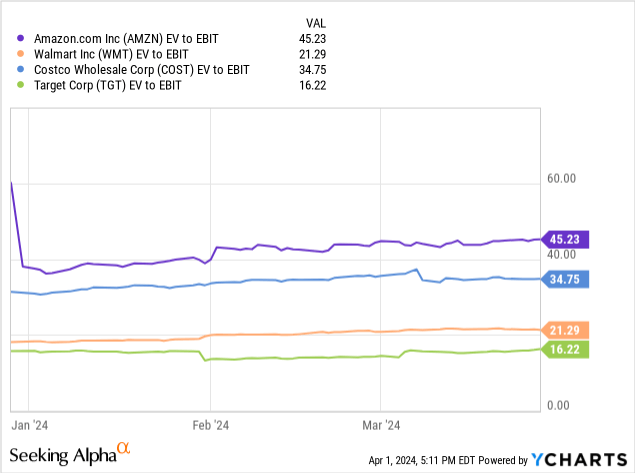
Costco is trading at a premium to both Walmart and Target, but Amazon has an even higher valuation due to its share of technology and its growth rates. As a result, the market expects Amazon’s new fulfillment networks to continue to drive profitability and customer satisfaction, which has been factored into the valuation. The partnerships with Meta Platforms, Inc. (META) and Shopify Inc. (SHOP) are expected to drive further growth.
Another major growth driver will be generative AI. Amazon will try to serve this through AWS and Bedrock. Bedrock’s goal is to make it easier for customers to access large language models or LLMs, but this is likely to be a highly competitive area in the future, and it will be interesting to see which companies emerge.
AMZN’s ROIC-WACC Spread
The ROIC of just under 13% is therefore compared to a WACC of around 9%, assuming a cost of debt of around 4% and a cost of equity of around 9%. That would give us an ROIC-WACC spread of about 4%, which is a solid number for the competitive industries in which Amazon operates and means that the investments are creating value.
AMZN’s Balance Sheet And Liquidity
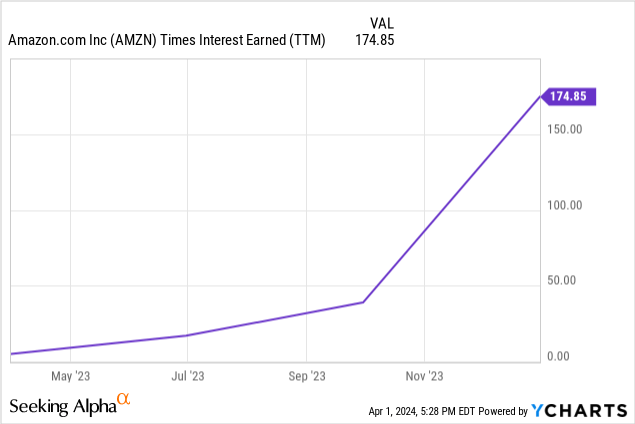
Amazon’s liquidity is very strong, as evidenced by its 174x interest coverage ratio. The average for non-bank companies in the S&P 500 (SPY) is about 10x, and Amazon is significantly better than that. In addition, the $86 billion in cash and short-term investments exceeds the $64 billion in long-term debt.
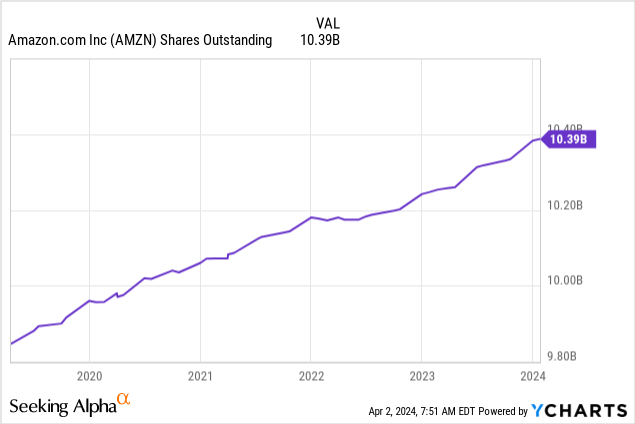
Amazon’s shareholders are getting a little diluted as the number of shares outstanding continues to grow, but since EPS is also growing, with 23% CAGR over the last 5 years, this is fine.
I expect that the share issuance will eventually come to an end and Amazon will become a stock cannibal, as many other companies in a more mature phase of the corporate life cycle have experienced. But that will probably be a few years away.
Amazon’s Reverse DCF
The market is currently pricing in EPS growth of 17% per year over the next 10 years for Amazon stock. And this is based on a diluted TTM EPS of $2.90 and an exit multiple of 35 in 10 years.
Historically, Amazon has delivered 23% annual EPS growth over the past 5 years, as we saw in the previous section, suggesting that the stock may be undervalued.
When I wrote my last article on Amazon 3 months ago, the market was pricing in annual growth of around 16%, so the stock is a little less attractive than it was then, but that is also due to the fact that the stock has risen almost 20% since then.
What Could EPS Look Like In 5 Years?
Seeking Alpha Earnings Tab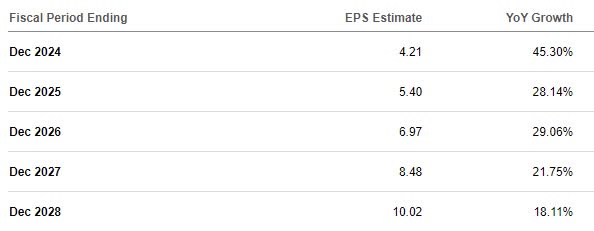
These are the analysts’ earnings estimates, and in the last 8 years, Amazon has beaten earnings estimates 7 times and missed them only 1 time. On average, they have outperformed EPS by an average of 20% per beat.
Thus, an EPS of around $12 in December 2028 seems quite possible, which at a multiple of 35 would imply a share price of $420. This would represent a compound annual growth rate of approximately 19% and a very strong performance over the period.
Conclusion
Amazon’s return on capital appears to be average. However, it appears temporarily lower than it actually is due to a higher-than-normal effective tax rate and investments made in recent years to ensure future growth. And because these numbers are always backward-looking, ROIC will continue to grow throughout the year, and I firmly believe that by December 2024, Amazon.com, Inc.’s ROIC will be back to above-average levels.
And the positioning to take advantage of the cloud in combination with generative AI is also promising for future development. As a result, I believe the valuation remains reasonable and that Amazon has a good chance of outperforming the index over the next few years.
Analyst’s Disclosure: I/we have a beneficial long position in the shares of META either through stock ownership, options, or other derivatives. I wrote this article myself, and it expresses my own opinions. I am not receiving compensation for it (other than from Seeking Alpha). I have no business relationship with any company whose stock is mentioned in this article.
Seeking Alpha’s Disclosure: Past performance is no guarantee of future results. No recommendation or advice is being given as to whether any investment is suitable for a particular investor. Any views or opinions expressed above may not reflect those of Seeking Alpha as a whole. Seeking Alpha is not a licensed securities dealer, broker or US investment adviser or investment bank. Our analysts are third party authors that include both professional investors and individual investors who may not be licensed or certified by any institute or regulatory body.

