Summary:
- Is Amazon’s growth story coming to an end? Discover how the pandemic affected the company’s revenue and profit growth, and what the future might hold for this tech giant.
- Amazon: growth or value stock? Amazon is currently at an infliction point in deciding where they will focus on.
- With a 5-year revenue CAGR of 27.52% and a focus on investing in R&D and entering new markets, Alibaba could continue to grow at a fast pace, although a potential.
- Despite a recent drop in stock price, Alibaba’s fundamentals remain strong with decent operating margins and revenue growth, although growth is less consistent than Amazon’s.
- BABA comes out on top on every metric when compared to its competitors, including AMZN, and has more room for growth ahead of itself at its current valuation, while AMZN may expect lower growth rates in the future.
svetikd
Introduction
In this article, we are going to take a deep dive into 2 of the most well-known companies in the world. Amazon (NASDAQ:AMZN) and Alibaba (NYSE:BABA) are known as giants in the e-commerce industry. The stock price of both companies has been under pressure over the last year due to post-pandemic slowdown in global economic growth. In addition, soaring inflation is affecting consumer spending, which has a direct effect on BABA and AMZN as well. In this write-up, we will take a look at the financials, risks, and opportunities for these companies and what to expect from the industry as a whole. We believe both companies could be great picks for the future, but as of now we believe BABA is slightly better at its current price.
E-Commerce and Where It is Heading:
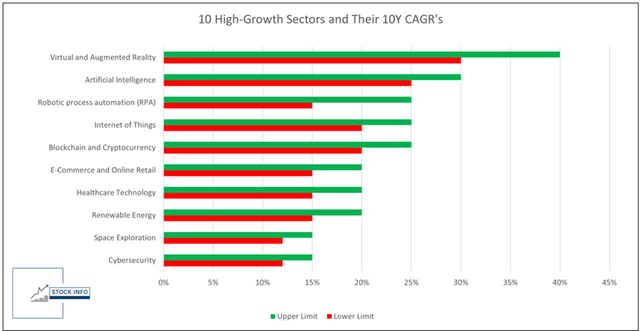
Amazon and Alibaba are much more than just e-commerce businesses, but this remains the sector they are most well-known for. That said, e-commerce is expected to remain one of the highest growing sectors for the next decade. E-Commerce is one of the 10 sectors we are covering in our “10 Sectors Likely To Generate Good Returns In The Next Decade” series. As you can see in the chart below, e-commerce and online retail is expected to grow between 15% and 20% in the next decade (Period 2020-2030).
The Biggest Differences
First of all, we have to keep in mind that we are talking about the undisputed leaders in the e-commerce industry. Amazon is the number one e-commerce player in the United States, while BABA is the number 1 in China.
While there are many similarities between BABA and Amazon, there are key significant differences as well. First of all, they have very different markets. As mentioned above, BABA’s primary market is China, while AMZN’s primary market is in the United States. Amazon sells goods directly to its customers, as well as benefiting from third-party sellers. Meanwhile, BABA almost exclusively relies on third-party sellers.
Furthermore, both companies have been active in the cloud-computing market over the last fast years. For Amazon, the cloud segment of their business has been a big profit driver, while Alibaba’s e-commerce side remains far more important for its business compared to its cloud segment. As can be seen in the chart below, 66% of BABA’s Q3 2022 revenue came from China commerce retail, while only 10% came from its cloud-computing segment.
Stock Info Based on Company filings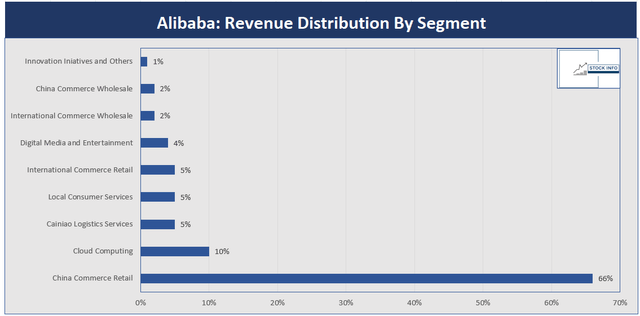
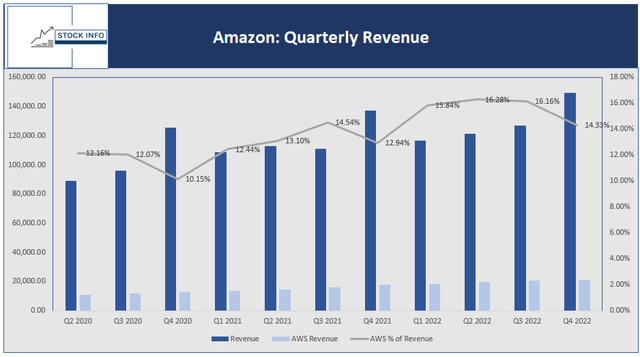
In the meantime, Amazon’s revenue from Amazon Web Services has grown significantly over the last few years. As can be seen in the chart below, Amazon generated $21.38B in revenue from AWS in Q4 2022. As illustrated, AWS revenue as % of total revenue always has a small slump in Q4 as % of revenue, mainly due to the fact that AMZN has a significantly higher revenue in Q4 due to the holiday season.
Amazon: Has it Reached its Peak?
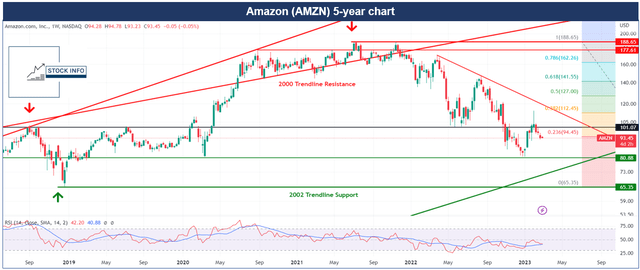
Amazon surged during the pandemic boom in the stock market, reaching a split-adjusted price of almost $189 at its peak. Currently, the stock is down over 50% since its all-time high back in November of 2021.
Unfortunately, the current market environment and the corresponding macroeconomic headwinds could put further downside pressure on AMZN shares. Both Amazon and BABA would suffer significantly in case of a recession, as revenue growth would decline and revenues as a whole might fall, due to a decrease in consumer spending.
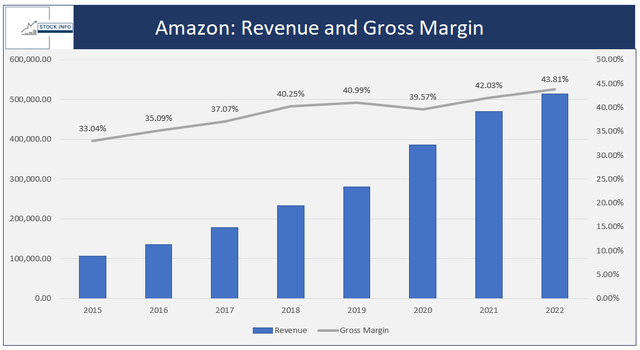
Something one has to ask themselves is if they should value Amazon as a growth stock or as a value stock? Well, if we take a look at AMZN from a growth perspective the company still isn’t cheap, though, with a gross profit margin of 13.16% and an operating margin of 2.38%, the company has been able to continue its growth. Furthermore, gross margins have increased over the years as well.
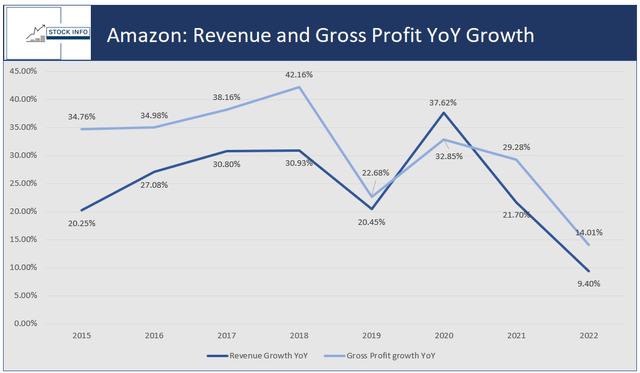
When we take a look at revenue growth and gross profit growth the future is looking less bright. In the chart below, we can see that both revenue and gross profit growth plummeted over the last few years. We could argue that if not for the pandemic, this trend could have started in 2019. We believe that Amazon is maturing and we shouldn’t expect 20% revenue growth YoY in the future.
That said, this doesn’t necessarily mean AMZN won’t grow anymore. If the company is able to continue growing at 10%, this would provide further resilience for the stock price. In addition, AMZN might be able to innovate further and enter new markets. For example, AI and Robotic Process Automation (RPA) are sectors Amazon could invest in to further boost its growth.
With this data in mind, Amazon’s valuation should probably look more like that of a value stock, with moderate growth ahead. Although we mention that AMZN should be valued as a value stock, we have to keep in mind that Amazon has plenty of possibilities to innovate further, and could enter new markets. Regardless of their currently-slowing growth, they are active in sectors that are likely to see significant growth in the future, such as cloud-computing and e-commerce, but if a recessionary scenario plays out and revenues and profits decline further, the stock could see significant downward pressure.
Let’s take a look at some metrics that we consider important, starting with the table below.
Currently, Amazon has a 5Y Revenue CAGR of 17.15%, showing that Amazon is able to continue growing its revenue. Their operating cash flow increased significantly over the years, but in 2022 the company struggled, as we can see in the table above.
While operating income declined by over 50%, capital expenditure increased further, unfortunately giving a FCF Yield of -1.76%. Essentially, this means that AMZN is currently unable to generate enough cash to support its business. This has been the case for the last 2 years, and may indicate that Amazon is heavily investing in its business or is simply in a downfall.
In addition, AMZN’s ROIC is currently 5.16%, which isn’t necessarily strong. This indicates that for each $100 it invests in its business it generates an additional $5.16 in operating income. As can be seen in one of the earlier charts the company has a gross margin of 43.81%, which indicates that the company generates a nice return on the products it sells.
AMZN: Technical Analysis
Now let’s take a quick look at the technical analysis for AMZN.
As mentioned earlier, AMZN’s stock price saw a significant decline. At one point in 2023 it was down close to 57% from its high in November of 2021. Currently, the stock price is below all of its EMAs on the daily and weekly chart, indicating that the stock is in a strong downtrend, though the $80-$81 support level should provide significant support if this downturn continues. In addition, we have the rising green trendline support, which has been the rising trendline support since the 2001 bottom in AMZN stock. In case both of these support levels don’t hold, there is another support level around $65, if the stock breaks this level, it will likely go into a complete free fall.
On the upside we have the $101 resistance level. This resistance level corresponds with the 2018 top, after which the stock declined over 36% to the $65.35 support as is indicated on the chart. In addition, this resistance level has shown to be a solid resistance/support level in the past. In the long-term we have the red trendline resistance levels, such as the 2000 trendline resistance, but as of now these aren’t levels we should be looking at. Alternately, it would be a bullish signal if the stock could break above the declining red trendline resistance.
Alibaba: How Big Should the China Discount Be?
When taking a look at Alibaba, it is important to ask yourself: “How big should the discount be?” It is understandable that investors outside of China ask for a discount on the valuation of BABA due to geopolitical risk, especially in the current environment as tensions between the West (United States and Europe) are close to all-time highs. In our article on Alibaba we discussed the potential risks in more detail.
All the risks aside, Alibaba seems to be well-positioned to expand internationally. BABA is profiting from the increasing trend in online shopping in China and globally, especially in the Southeast Asian, Middle Eastern, and Latin American markets, where Alibaba is seeing a growing demand and is well-positioned to capture a significant share of the market.
Alibaba has been investing significantly in its R&D, and is investing in multiple sectors we expect to see significant growth in the next few years, as discussed in our series, ” High-Growth Sectors, which are likely to generate good returns in the next decade”. BABA has been investing in AI, machine learning, and the Internet of Things. We expect these to be key drivers of growth in the coming years.
Similar to Amazon, Alibaba’s share price has plummeted over the last 2 years. Currently, the stock is down 72% from its all-time high back in October of 2020. At one point it was down close to 82%. One has to ask themselves, “Is this downfall justified?” Back in 2020, everyone was in love with BABA stock, and even value investors invested in this stock as a must-have. Now that the stock has fallen out of favor, it might be more interesting to invest in it for the long-term. Let’s take a look at the fundamentals and if they declined alongside the stock price over the last 2 years.
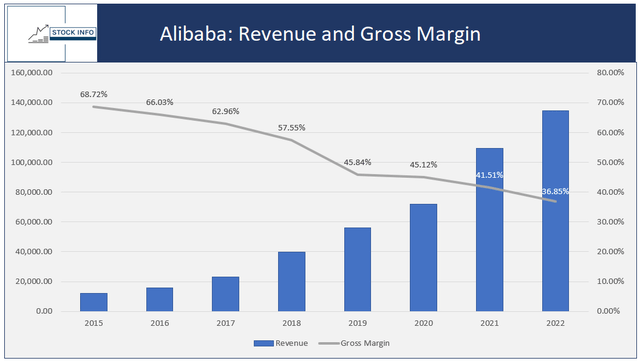
As we can see from the chart above, Operating Margin is currently 11.31%. This has been declining over the last few years, but is significantly higher than AMZN’s. Furthermore, its 5Y operating income CAGR sits at 6.22%, which is decent. In addition, gross margins have declined significantly over the years, but at 36.85% this isn’t bad at all.
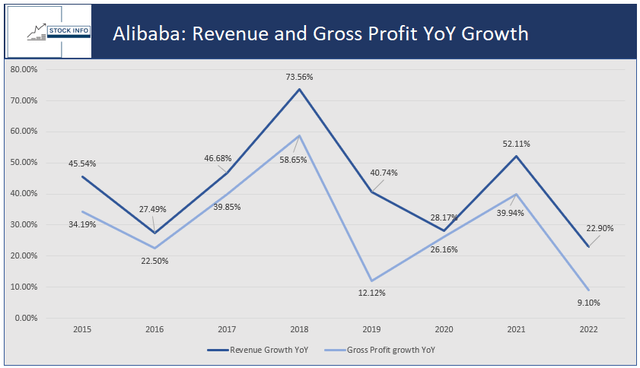
When we take a look at revenue growth and gross profit growth the future isn’t really clear as of now, since Alibaba’s revenue growth and gross profit growth is somewhat all over the place. In 2018 they had a blow-out year, with a revenue growth YoY of 73.56% and Gross Profit growth of 58.65%. One year later these declined to 40.74% and 12.12% respectively. While the growth is less consistent compared to Amazon, BABA is a lot more likely to sustain a 20% revenue growth in the upcoming years. As mentioned previously, the company is investing heavily in R&D and tries to enter new markets, as well as new industries.
Again, it is important to mention that in case of a recession, revenue and gross profit growth could slow down significantly, which we already saw somewhat in 2022.
Furthermore, we should take a look at some metrics that we consider important. Let’s start by taking a look at the table below.
Currently, Alibaba has a 5Y Revenue CAGR of 27.52%, which shows that Alibaba is able to continue growing its revenue at a fast pace. While operating income declined by 9%, capital expenditure pretty much remained the same. Currently, this gives a FCF Yield of 6.11%, implying that the company could buy itself back in a little over 16 years.
As BABA is focusing on growth we shouldn’t expect significant share buybacks soon, although I believe this would be highly bullish for the business at its current price as it would show confidence in the business. It is clear that this isn’t the main focus of BABA’s management. They want to continue growing revenues by investing. Furthermore, they will be focused on improving relations further with the Chinese Communist Party (CCP) after some public incidents over the last years, particularly the Jack Ma incident back in 2020.
In addition, BABA’s ROIC is currently 12.56%, indicating that for each $100 it invests in its business they generate an additional $12.56 in operating income. As can be seen in one of the previous charts, the company has a gross margin of 43.81%, which indicates that the company generates a nice return on the products it sells.
BABA: Technical Analysis
Now let’s take a quick look at the technical analysis for BABA.
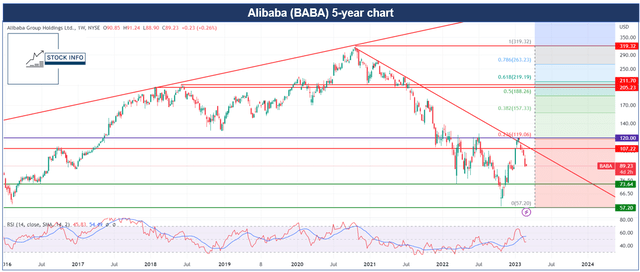
As mentioned, BABA’s stock price plummeted over the last 2 years. At one point in 2022 it was down close to 82%. Currently, the stock price is below all of its EMAs on the daily and weekly chart, which indicates that the stock is in a strong downtrend, as can be seen. There is a key resistance channel that remains in place, which could be a potential turning point for the stock. A break above this trendline could indicate that the downward trend for BABA is over. The $80 – $81 support zone should provide decent support. If this downturn continues further though, we should keep the important $73 level in mind. If it gets really ugly, it could revisit the $57 low of late 2022. As of now, we believe this is unlikely as conditions in China improved due to a reopening of its economy. If the stock would break this level, it would be in a complete free fall.
On the upside we have the $107 resistance level. This resistance level corresponds with the 2016 top. In addition, the $120 resistance level (purple line) has been tough to break above over the last year. It would be highly bullish to see the stock move convincingly above the red trend line resistance and additionally move above $120. Furthermore, the RSI on the daily chart is currently in oversold territory, the last time this happened was back in October of 2022, when the stock reached its $57 – $58 low.
Amazon and Alibaba: Who to Pick?
We took a deep-dive into both companies and their fundamentals, now let’s take an additional look at how they line up compared to their competitors.
The main competitors we will look at are: JD.com (JD), PDD Holdings (PDD), MercadoLibre (MELI), and Jumia (JMIA), also known as the African e-commerce giant.
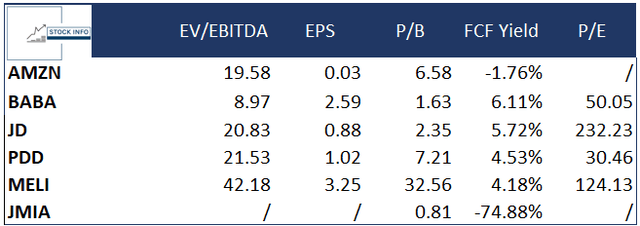
As can be seen in the table below, BABA pretty much comes out on top on every metric. They only are worst compared to PDD on a P/E basis. Keep in mind that all data is based on GAAP earnings and TTM, where applicable.
Furthermore, we can see that BABA seems to be the better pick based on these metrics when we compare it to AMZN. If we take a look at BABA’s metrics and the current political climate, BABA should be considered as a buy. We believe Chinese conditions have improved compared to a few months ago. Although geopolitical tension remains high, as of now this isn’t as big of a concern. If one would have to pick between BABA and AMZN at this moment in time, BABA seems to be the better pick out of the two. At its current valuation, BABA should have more room for growth ahead of itself, while AMZN should expect lower growth rates in the future.
When we take a look at some of the other companies on the list, we have to say that they are earlier in their growth progress. Nevertheless, some of these companies are definitely worth keeping an eye on and we might analyze some of these in a future article.
Conclusion
We believe that BABA is currently a better buy compared to AMZN. Although investing in Chinese companies involves risks, we believe that at this moment in time the discount on BABA is big enough when taking these risks into account. Amazon has some work to do to prove it can sustain its growth, otherwise they should start to focus more on profits compared to growth, as the 20% YoY revenue growth might not be sustainable.
If BABA should drop down to $57, without any significant changes in either the fundamentals or political climate, one should consider taking a position in BABA. Currently, the valuation is good as well, but the stock price could see some further downward momentum. We believe if one can handle the volatility, it isn’t a bad time to take a starter position at this moment in time.
In the case of Amazon, we believe the company is currently a hold. The company should prove to its investors that this valuation as a growth company is deserved. If this isn’t the case, they should pivot their strategy and start looking to maximize profits. We don’t think AMZN should be given a sell rating currently, as shareholders should give the company more time to prove and reinvent itself again.
Editor’s Note: This article discusses one or more securities that do not trade on a major U.S. exchange. Please be aware of the risks associated with these stocks.
Disclosure: I/we have no stock, option or similar derivative position in any of the companies mentioned, but may initiate a beneficial Long position through a purchase of the stock, or the purchase of call options or similar derivatives in BABA, AMZN over the next 72 hours. I wrote this article myself, and it expresses my own opinions. I am not receiving compensation for it (other than from Seeking Alpha). I have no business relationship with any company whose stock is mentioned in this article.

