
Summary:
- Dividend aristocrat that continues to deliver on its mission.
- While valuations seem high for Coca-Cola and its consumer staples peers, the stock is trading at or below multi-year valuation multiples.
- Coca-Cola possesses incredible intangible assets that are not fully accounted for on the balance sheet that continue to create a wide moat and value for long-term shareholders.
- Using the Warren Buffett test, I would feel comfortable owning this stock today and not checking the stock price for the next ten years.
Train_Arrival/iStock Editorial via Getty Images
Coca-Cola (NYSE:KO) became a pillar of the American zeitgeist shortly after its inception in 1886 and has continued to be since. In subsequent decades it became a staple refreshment not only in the United States, but around the world. While sugary drinks and soda in general have faced some challenges in recent years, the Coca-Cola brand persists, satisfying thirst, delivering consistency and dependability, and generating value for shareholders and consumers alike.
Through decades of company-specific controversies and challenges including the use of coca leaves (source of cocaine), New Coke (Oops), or the prolific use of high-fructose corn syrup, Coca-Cola has been resilient. The company continues to innovate and penetrate new markets both geographically and through new product offerings more than 130 years since John Pemberton created the original elixir.
For those interested in an informative history lesson about one of America’s iconic brands, a quick search on Wikipedia will surely enlighten and entertain. The super abridged version: Pemberton, a native Georgian and Civil War veteran with the Confederate Army, experienced a saber wound in battle, leading to pain and a morphine addiction. This addiction led him to create a “medicine” that included a little bit of cocaine that ultimately led to the creation of Coca-Cola.
Buffett Ownership
Famed investor Warren Buffett and his Berkshire Hathaway (BRK.A) have been shareholders since the late 1980s. The company satisfies one of Buffett’s most important investment doctrines of only buying companies that you are effectively willing to own forever.
The ownership of the stock by Warren Buffett and Berkshire has been used as a reason to both buy and sell the stock. Some will point out that BRK hasn’t increased its position since the late 1980s. Others will highlight that the position remains intact. I favor the latter case and see that Mr. Buffett and Berkshire recognized the cash flow and dividend strength back in the 1980s and now enjoy annual cash flows from dividends that approximate the original investment in the stock due to dividend growth.
All that said and acknowledged, the ownership of a stock by one successful and high-profile investor should never qualify as a sufficient investment case. The company, and its stock, should always stand on its own merits.
The Importance of a Wide Moat
Building a wide moat is important for any company as it results in sustainable revenue and margins. Companies must differentiate themselves to become a dominate player in their specific space in order to achieve this. For Coca-Coca, its business model is unique, and would be near impossible to replicate.
The company and its products represent the largest share within the Non-Alcoholic-Ready-to-Drink (NARTD) beverage segment globally. While on the surface it might appear to some to be a simple business, distributing beverages to nearly every country on Earth profitability is not simple, and requires a lot of expertise and deep understanding of the economics of local markets. This knowledge, expertise, and systems (people and processes) in place, have created a wide moat around the Coca-Cola business. These people in place and processes that define the production and distribution systems are enormous assets that are largely unaccounted for on the balance sheet. While the brand is important as it represents a consistent and quality product globally, the real value is embedded in the logistics of delivering to millions of consumers every day. This consistent and value-based approach may not generate accelerating growth in results during any particular quarter, but has been successful in delivering on the company’s mission.
Recent Performance
Admittedly, recent performance for the stock has been underwhelming. As a cash flowing, dividend paying/growing company, the most important measure of performance is total return. Over the last year, performance on a total return basis has been slightly positive, outperforming the broader market. However, over longer periods, the performance relative to the S&P 500 has been mixed. The stock has underperformed over the last 3 years, outperformed over the last 5, and again underperformed over the last 10 years. This mixed bag in part can be attributed to the performance of mega cap tech stocks that drove S&P 500 returns in recent years. So why is the stock attractive now? Why should investors hold it as part of a larger diversified portfolio?
1-Year Total Return of Coca-Cola versus the S&P 500 (Seeking Alpha)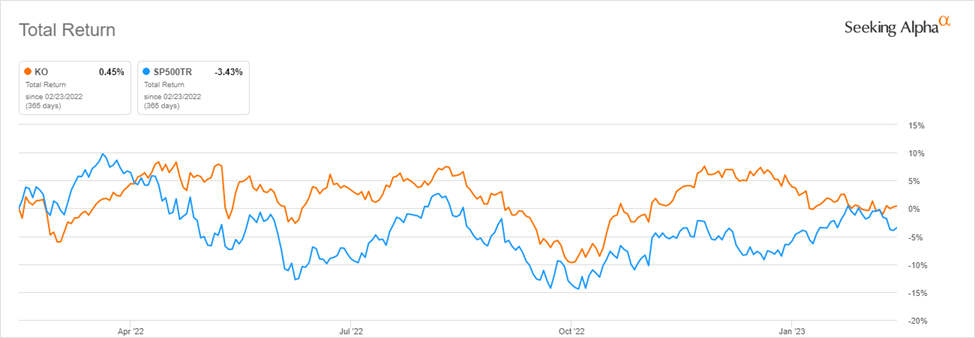
Beyond nostalgia and brand strength, the stock is attractive based on certain fundamental factors. While it is not unreasonable to view current valuations as high, the stock is actually trading at or below 5-year averages on many metrics. This may not form a compelling argument for some, but it is reassuring to long-term holders that the company is consistently delivering on its mission and continues to be well-managed.
Valuation
Looking specifically at valuation metrics on a forward basis we see that the stock is trading below its 5-year averages across the board. It is reasonable to point to the fact that valuations have been relatively elevated in recent years. This may have been partially justified by historically low interest rates, but the environment has changed. With higher interest rates it makes sense to place a lower valuation on dividends, earnings, and cash flow. However, if the expectation is for inflation to continue to decline and interest rates to stabilize, continuing to hold the stock for long-term investors makes sense.
|
Valuation Metric |
KO |
KO 5-Year Average |
% Difference to 5-Year Average |
|
P/E GAAP (FWD) |
23.20 |
25.31 |
-8.36% |
|
EV/Sales (FWD) |
6.45 |
7.11 |
-9.31% |
|
EV/EBITDA (FWD) |
19.97 |
21.46 |
-6.93 |
|
EV/EBIT (FWD) |
22.25 |
24.27 |
-8.32% |
|
Price/Cash Flow (FWD) |
22.15 |
24.24 |
-8.61% |
|
Price/Book (FWD) |
9.53 |
11.23 |
-15.19% |
Dividend
The dividend is the most important factor for many holders of Coca-Cola. As a dividend aristocrat, 2023 marks the 61st year of consecutive dividend increases by the company. It generates and provides the cash flow that millions of investors depend on to grow their portfolios and to provide for living expenses in retirement. Based on the coverage from earnings and cash flow, it is reasonable to expect this trend to continue. While the dividend has grown below the rate of inflation over the last two years, that is due to the rise in inflation above the company’s current target dividend growth rate of 5%. I expect the dividend growth rate to resume leadership moving forward as inflation continues to decline.
|
Dividend Growth or Coverage Metric |
KO |
KO 5-Year Average |
% Difference to 5-Year Average |
|
Cash Dividend Payout Ratio (TTM) (Non-GAAP) |
70.97% |
76.21% |
-6.88% |
|
Interest Coverage (TTM) |
13.89 |
10.04 |
38.35% |
|
Total Debt/Capital (TTM) |
62.08% |
67.54% |
-8.09% |
|
Dividend Growth Rate 5Y (CAGR) |
3.53% |
5.42% |
-34.95% |
|
1 Year Dividend Growth Rate (TTM) |
4.76% |
3.43% |
38.71% |
Profitability
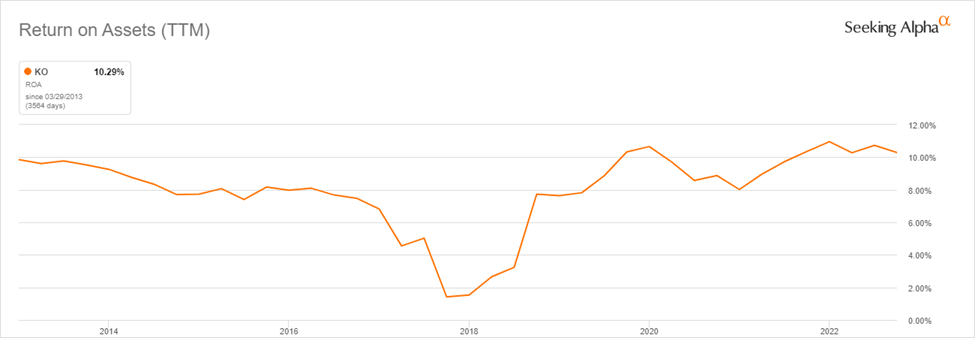
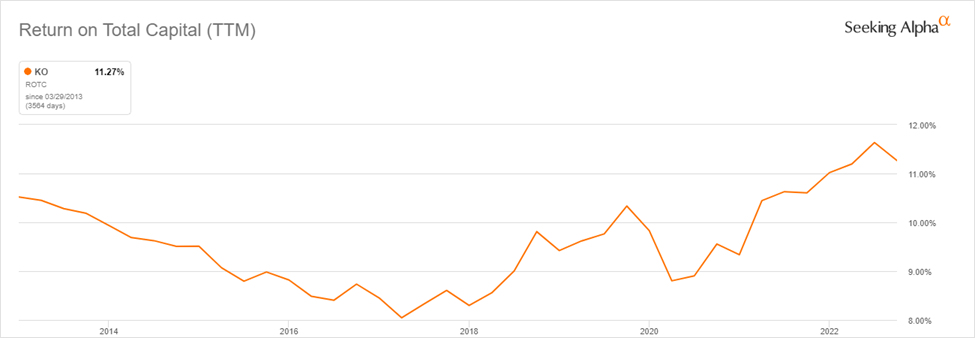
The company’s margins continue to be steady and consistent with slight variations quarter-to-quarter across different product lines. More impressive is the upward trend in returns on equity, assets, and capital. All three measures of profitability are at or above 10-year highs and have been trending higher since 2017/2018.
|
Profitability Metric |
KO |
KO 5-Year Average |
% Difference to 5-Year Average |
|
Gross Profit Margin (TTM) |
58.14% |
60.73% |
-4.26% |
|
Net Income Margin (TTM) |
22.19% |
20.36% |
8.97% |
|
Return on Common Equity (TTM) |
40.51% |
38.07% |
6.43% |
|
Return on Total Assets (TTM) |
10.29% |
8.19% |
25.59% |
|
Return on Total Capital (TTM) |
11.16% |
9.76% |
14.32% |
The ratios displayed in the table above represent a snapshot in time. To better understand the long-term trends, the charts below show the evolution of the returns on equity, assets, and total capital over the last 10 years. The trends shown illustrate the positive reversal in profitability that has taken place since each ratio bottomed in 2017/2018.
Return on Equity (TTM) (Seeking Alpha) Return on Assets (TTM) (Seeking Alpha) Return on Total Capital (TTM) (Seeking Alpha)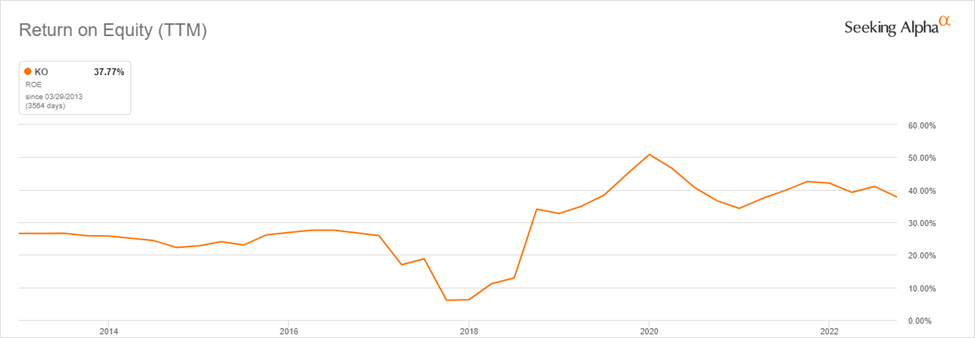
Value Drivers & Risks
While I don’t expect Coca-Cola to become the next high-growth A.I. company, I do expect that long-term processes and efficiencies will continue to drive value. The company’s diversified product portfolio serves widespread consumer tastes and preferences globally. While Classic Coke and Diet Coke are two of the largest product lines, the company has solid footing in juices, water, and sports and energy drinks, resulting in total servings per day of about 2.2 billion.
Market penetration and adoption of the evolving product line-up will continue in the U.S., developed markets, as well as developing markets with both population growth and shifting demographics increasing demand. The company seeks to further efficiency gains through innovative packaging that is appealing to consumers while also reducing waste. The company’s R&D process for creating, testing, and launching new products in markets globally will continue to add value.
The company does face numerous headwinds, including a secular decline in beverages with added sugar and high fructose corn syrup. There is a major push within the company to continually reduce the use of sugar in conjunction with a greater focus on other beverage types that are favored by consumer tastes and demographic shifts. Other risks not exclusive to Coca-Cola include inflation, foreign exchange, and other macroeconomic factors as well as ongoing geopolitical concerns.
Hold
While I am certainly long-term bullish on Coca-Cola, and believe that it will generate significant value for investors over the years and decades to come, I am given it a ‘hold’ rating right now versus a ‘buy’ given the performance of the stock and potential impact of the risks mentioned above. That said, I believe the business is stable, growing, and provides an attractive place to park capital.
Final Thoughts
I like the stock for its stability, it’s track record of dividend payments and growth, and the strength of the brand. I like that everyone that touches their product throughout the distribution chain makes money across the 200+ countries and territories served. I like the connection to American culture. It may not be the highest-flying stock, but it has been one of the best and most resilient over time. Since 1886, our country has experienced multiple economic depressions, two World Wars and countless military conflicts, the Great Influenza of 1918, Presidential assassinations, and too many other tragedies and challenges to count. This is why I own the stock and why it is my largest single stock position.
I employ an enhanced indexing approach to portfolio management. I allocate most assets to low-cost ETFs to acquire index exposure while sprinkling in a select number of individual names that I have chosen. Owning Coca-Cola stock individually in addition to a largely index-based portfolio makes sense for my personal situation and finances. Please examine your own situation before buying or selling Coca-Cola or any security. While Coca-Cola is my largest individual holding, it is by no means a concentrated position, but a meaningful overweight relative to the 0.70% it currently represents in the S&P 500. The company, like all others, is subject to the ebbs and flows of the business cycle, fads, trends, and other disruptions. Any overweight or underweight position to this individual stock needs to be considered carefully to understand its impact on long-term total returns. Thank you for reading. I look forward to seeing your feedback and comments below.
Disclosure: I/we have a beneficial long position in the shares of KO either through stock ownership, options, or other derivatives. I wrote this article myself, and it expresses my own opinions. I am not receiving compensation for it (other than from Seeking Alpha). I have no business relationship with any company whose stock is mentioned in this article.