
Summary:
- Long term trend channels indicate that AAPL stock is up against strong price resistance.
- Indicators of investor expectations for Apple stock remain “too bullish.” Large advances in AAPL seldom start from the current level of optimism.
- Speculation metrics of Apple stock are also too high, indicating the need for more price and/or time correction to cool things off.
- From a technical point of view, Apple is giving conflicting signals but there appears to be an underlying message in the conflict.
Ljupco/iStock via Getty Images
Apple has recently experienced a sharp sell following the abnormally large price gain from April to June. From a technical point of view, it is giving conflicting signals. But there appears to be an underlying message in the conflict.
While technical analysis can’t tell you “what” to buy, it can often tell you “when” to buy. Let’s take a look.
Long-Term AAPL Trend Channels
The chart below shows Apple stock since 2019 and we’ve drawn two trend channels. The lower channel represents support for Apple long term; the upper channel represents resistance for Apple long term.
It’s clear that Apple’s powerful movement from April to July carried prices from long-term support to long-term resistance in just four months. To forecast more price gain, without first a period of correction or absorption, would be highly abnormal and should not be expected.
Standard Straight Trendline Price Channel As Explained In Technical Analysis of Price Trends by Edwards and McGee (The Sentiment King)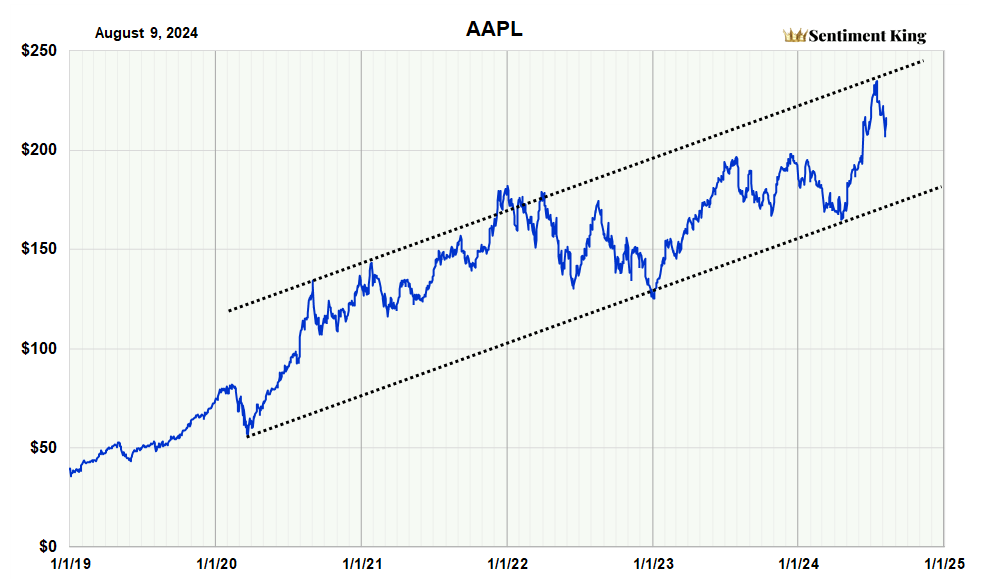
Long-Term Expectations For Apple Are Still Too Bullish
It’s a truism that you want to avoid a stock when “too many” investors believe in it, and buy it when the vast majority have lost their belief. The chart below helps investors do this. It’s a technical tool that shows when “too many” investors expect prices to go higher, or when “too many” think they’re headed lower.
This chart measures the level of bullish or bearish expectations for Apple stock. The term “indicators of investor expectations” was coined by Marty Zweig in the 1970s. When “too many” investors have the same investment expectations, the opposite usually happens. He used ‘put’ and ‘call’ option contracts to measure this. Our metric for investor expectations is similar and is based on comparing how much money is going into put options, expecting the price to decline, versus money going into call options expecting a rise. We use the amount of money instead of the number of contracts since it’s much more exact. The ratio is calculated over 20 days to show long-term expectations so it’s not a short-term indicator. Our calculation only uses “directed options,” which are options purchased with price direction in mind, versus hedging or income option purchases. The Green Zone represents extreme bearish expectations while the Red Zone represents extreme bullish expectations. (The Sentiment King)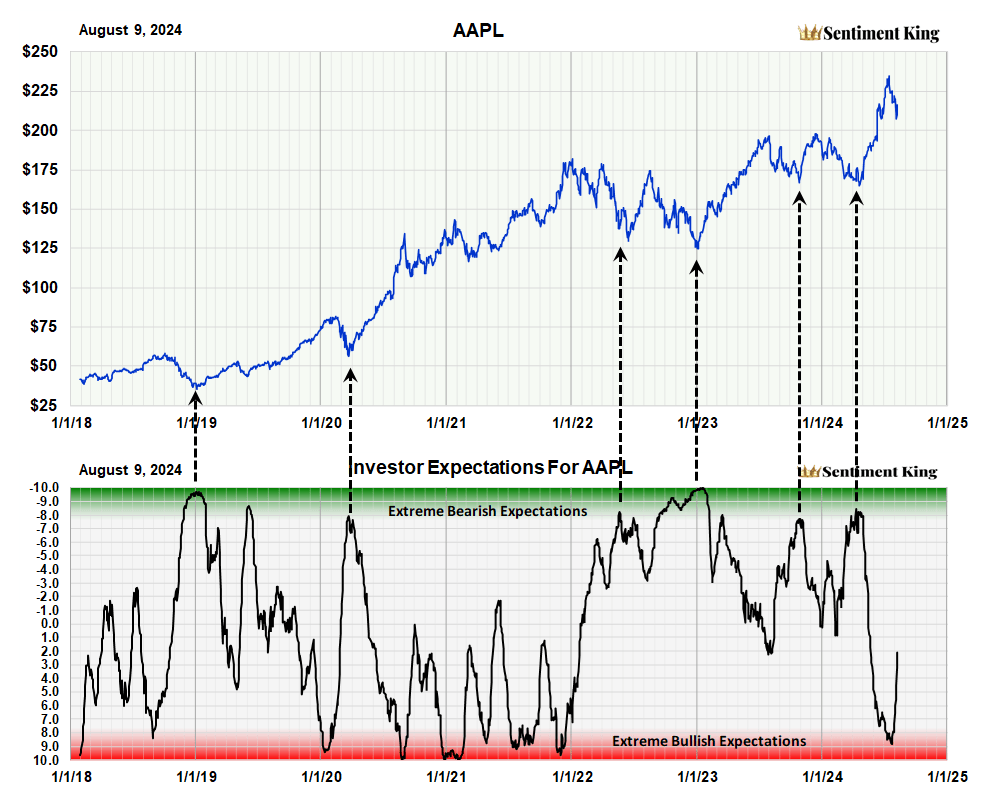
The black arrows show that every long-term price advance in Apple in the last six years started after investor expectations for the stock were generally negative or bearish.
The current reading of this indicator shows that investors are still too optimistic on Apple. A major bull move should not be expected. At least not yet. Investors should wait for bullish optimism for Apple to lessen before buying again for the long term.
Speculation Levels in Apple Stock Are Too High
This next chart measures the degree of investor speculation in Apple stock. It’s a long held principle that when investors get too optimistic and “over speculate” it’s usually the sign of a market top, and when they “under speculate” it’s usually at market lows. The chart below shows this principle in action.
We’ve highlighted with black arrows periods of “over speculation” in Apple stock since 2018, and they almost always occurred near a significant top.
This speculation indicator compares option activity to stock activity. In 1972 market technician Martin Zweig invented a speculation index he called the option activity ratio. Options are wonderful indicators of speculative juices. When investor spirits are high, investors over speculate by buying too many options. Likewise, when investor spirits are low, they fail to speculate and avoid the option market. Remember, one option contract equals 100 shares so by comparing how many option contracts are being purchased versus the number of shares purchased, we gain insight on the level speculation. The Red Zone shows periods of over speculation while the Green Zone shows low levels. (The Sentiment King)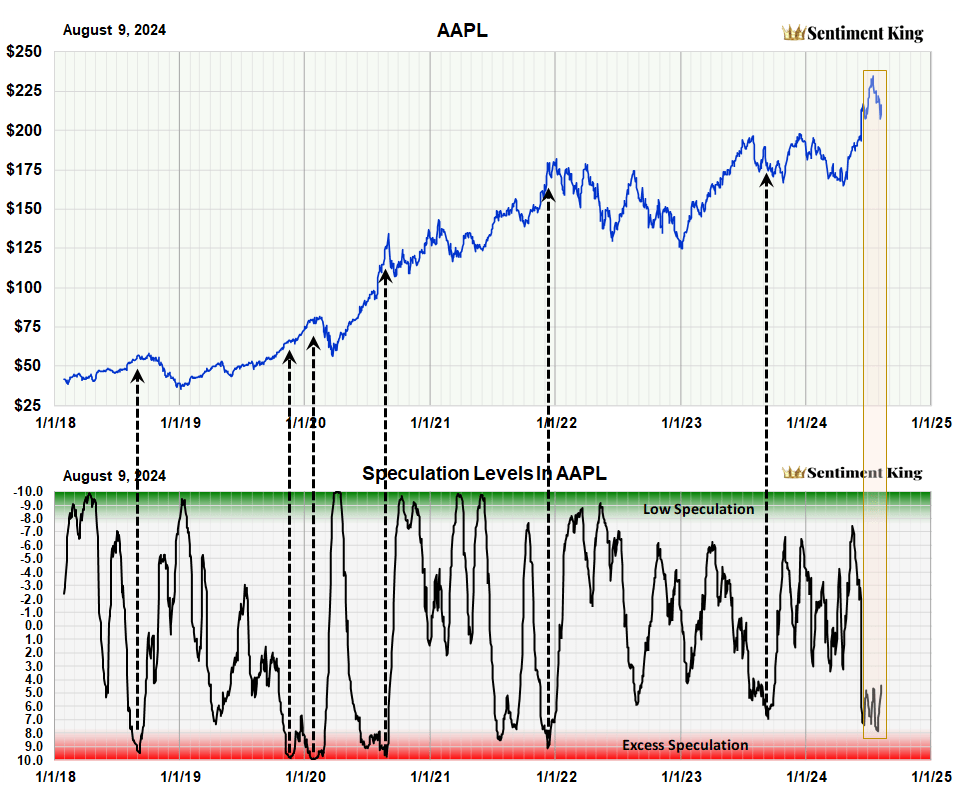
We point out, using an orange colored band, that speculation in Apple stock remains high even after the recent sell-off.
We believe speculation levels in Apple stock must first decline before we get another significant advance in the stock. History supports this belief.
Bollinger Bands Also Show Apple Stock Needs a Long-Term Price and/or Time Correction
Another way to look at price excesses in Apple stock is by using Bollinger bands. They show how far prices have advanced beyond the norm.
This next chart shows that the large Apple price gain between April and June carried the price up against the top Bollinger band (red). When this happens, it usually leads to a major price and/or time correction over the next three to six months, which brings it back to the lower band (green).
Bollinger Bands are a popular technical tool used by traders and investors to assess if a stock is overpriced or undervalued. They were created in the 1980s by financial expert John Bollinger. A simple moving average is calculated that represents the trend of interest; in our case we use a 100 day average. Then the standard deviation over the same period is calculated and upper and lower bands are placed above and below this moving average that represent a specific number of standard deviations. In our case we use two. Because the distance of the bands is based on standard deviation over 100 days, they expand and contract with price volatility. This means that, in volatile markets, support and resistance occurs at higher or lower levels than in less volatile markets. (The Sentiment King)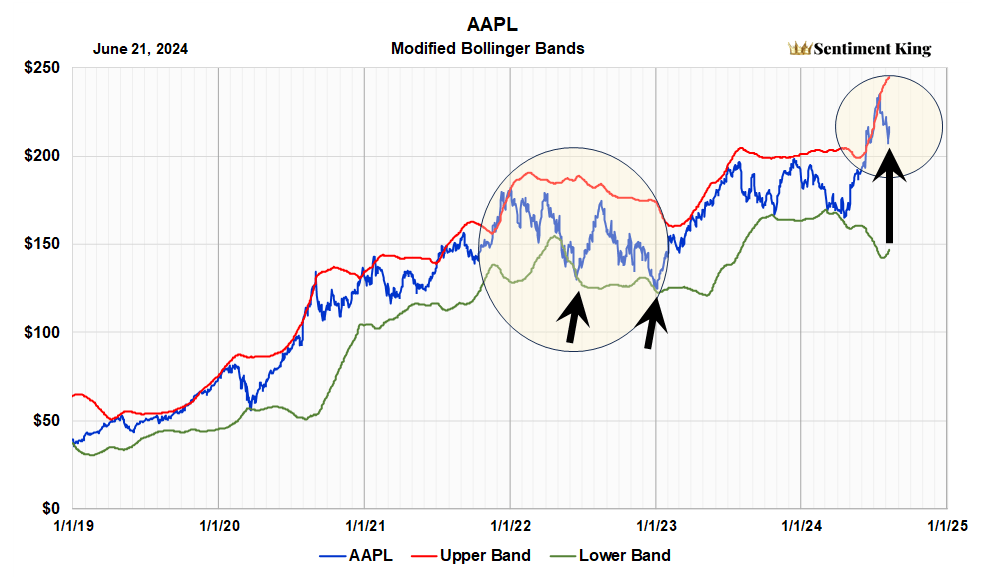
The first circle on the left shows this. Notice that after prices reached the upper red band in January of 2022, a correction soon followed, and prices eventually worked their way down until they touched the lower green band. The two black arrows point to this.
The far-right arrow shows the current situation. It shows how far prices have moved away from the lower band (green) and are extended. In our opinion, this excess must be resolved. We think this is additional technical evidence on how extended Apple stock is, and that it must either decline, or move sideways for an extended period, to consolidate and narrow this gap.
Relative Strength of Apple Is Positive Long Term
This last chart shows a different technical picture from what’s been presented so far. It’s the long-term RSI relative strength index for Apple. We calculate our RSI indicator to measure relative strength over the long term; this is not a short-term view.
It shows that the recent sell-off in Apple has moved the RSI down to oversold levels. We’ve indicated with black arrows the current RSI, and periods in the past when there were equivalent readings. The arrows point to times the RSI reached 45. Each indicated Apple was oversold longer term, and there was a significant rally.
The relative strength index (RSI) was developed by J. Welles Wilder Jr. and introduced in his 1978 book, New Concepts in Technical Trading Systems. It is probably the most popular momentum indicator used in technical analysis. The RSI measures the speed and magnitude of recent price changes in a stock to evaluate if its overvalued or undervalued. It has adjustable parameters that allow you to measure market conditions for either the short or long term. We’ve adjusted the parameter in our graph to show the long-term picture. (The Sentiment King)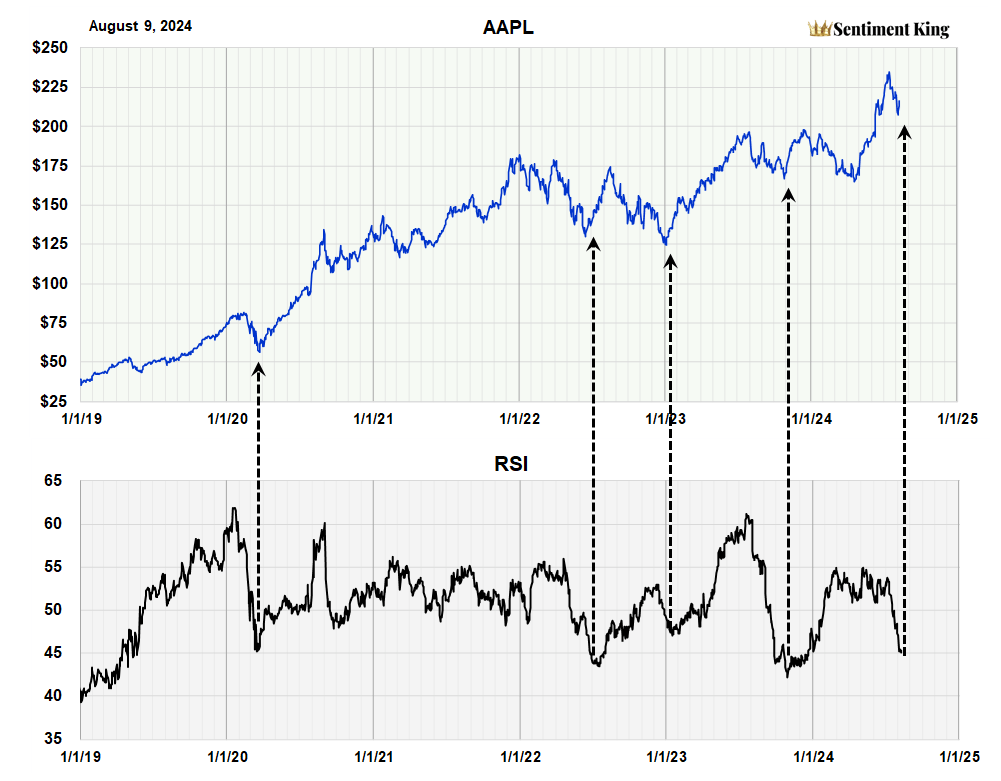
Conclusion
It’s a little unusual to have the price of a stock so far away from the lower Bollinger band, while the long-term RSI index shows prices oversold, but this can happen. From our experience it implies that the market will go through a short-term rally that will relieve the oversold condition of the RSI but continue to correct long term to bring about the technical conditions needed to start a major new advance in Apple stock.
It’s our opinion that investors in Apple should hold off and wait for technical conditions in Apple to change long-term. The conditions for the start of a major advance in the price of Apple simply don’t exist at the moment. In fact, the conditions suggest Apple needs to go through a deeper price or time correction to bring about the changes in investor expectation that almost always precede a major new advance.
Analyst’s Disclosure: I/we have no stock, option or similar derivative position in any of the companies mentioned, and no plans to initiate any such positions within the next 72 hours. I wrote this article myself, and it expresses my own opinions. I am not receiving compensation for it (other than from Seeking Alpha). I have no business relationship with any company whose stock is mentioned in this article.
Seeking Alpha’s Disclosure: Past performance is no guarantee of future results. No recommendation or advice is being given as to whether any investment is suitable for a particular investor. Any views or opinions expressed above may not reflect those of Seeking Alpha as a whole. Seeking Alpha is not a licensed securities dealer, broker or US investment adviser or investment bank. Our analysts are third party authors that include both professional investors and individual investors who may not be licensed or certified by any institute or regulatory body.