Summary:
- T has been wrongfully sold-off, since its free cash flow generation has always been lumpy, depending on the timing of cash distributions, capital expenditures, and cash paid for vendor financing.
- Given the optimistic signs of operating cost optimization and improved profitability, we believe the telecom may potentially achieve its ambitious FCF generation of $16B in 2023.
- However, the stock may underperform at these levels, attributed to the minimal upside potential to our price target of $18.65.
- Therefore, T is only suitable for income-seeking investors with a higher risk tolerance due to the potential impact of the economic downturn on its subscriber growth and ARPU.

Gearstd
The Perfect Example Of Things May Get Worse Before They Get Better
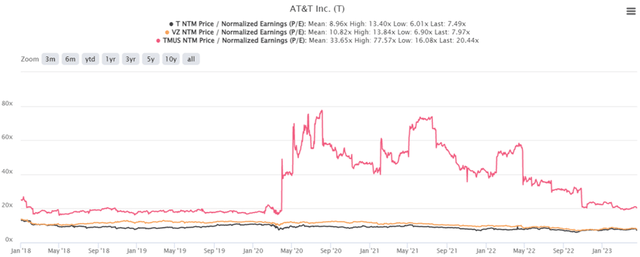
T, VZ, and TMUS 5Y P/E Valuations

S&P Capital IQ
AT&T stock (NYSE:T) is currently trading at an NTM P/E of 7.49x, lower than its 3Y pre-pandemic mean of 9.50x and 1Y mean of 8.48x. The stock’s valuation is also compressed, against its telecom peers, such as Verizon (NYSE:VZ) at 7.97x and T-Mobile (NASDAQ:TMUS) at 20.44x.
The pessimism surrounding T’s execution is not surprising, since it has barely beat bottom-line expectations, while missing both revenue and Free Cash Flow [FCF] estimates in the recent FQ1’23 earnings call.
The telecom has reported a -$80M miss in revenues at $30.14B (-3.8% QoQ/ +1.4% YoY) and a -$2B miss in FCF at $1B (-83.6% QoQ from $6.1B/ +42.8% YoY from $0.7B). The latter paints a stark difference compared to its ambitious annualized FCF guidance of $16B in FY2023.
Nonetheless, investors must also understand that T’s cash flow has always been lumpy, depending on the timing of cash distributions from DIRECTV at $0.8B (+100% QoQ/ -38.4% YoY), capital expenditures from continuing operations at $4.3B (+2.3% QoQ/ -8.5% YoY), and cash paid for vendor financing at $2.1B (+320% QoQ/ +31.2% YoY) in FQ1’23.
In addition, the telecom’s Q1 cash flow has been seasonally weaker, attributed to the elevated device payment for the previous quarter’s holiday season. The same was observed in FY2022, with FQ1’22 cash paid for vendor financing at $1.6B (-5.8% YoY), FQ2’22 at $1.8 (+38.4% YoY), FQ3’22 at $0.9B (-10% YoY), and FQ4’22 at $0.5B (inline YoY).
Combined with T’s sustained dividend payout at $2.01B (inline QoQ and -46.2% YoY) in FQ1’23, it is unsurprising that its FCF generation has been impacted, lower than the consensus estimates.
However, we reckon this is the perfect example of things may get worse before they get better, potentially by H2’23 onwards. The same was witnessed in FY2022, with the telecom previously reporting FQ1’22 FCF generation of $0.7B (-88.1% YoY), FQ2’22 at $1.4B (-80% YoY), FQ3’22 at $3.8B (-26.9% YoY), and FQ4’22 at $6.1B (-29.8% YoY).
Furthermore, T already made great efforts in moderating its operating expenses to $14.71B (in line QoQ/ -2.1% YoY) by the latest quarter, offsetting the rising inflationary pressures. As a result, we are cautiously optimistic that it may potentially achieve its target of over $6B in annual cost savings by the end of FY2023, with cash from operating activities already expanding to $6.7B (-34.9% QoQ/ +17.5% YoY) by FQ1’23.
Combined with the sustained cadence in its postpaid phone net adds at 424K, fiber net adds at 272K, domestic wireless service revenues by +5.2% YoY, and consumer broadband revenues by +7.3% YoY, we are carefully cautious that T may potentially achieve its FCF guidance of $16B (+13.4% YoY) for the fiscal year.
We are already seeing hints of improvement in the telecom’s postpaid phone ARPU of $55.05 (-0.6 QoQ/ +1.9% YoY) in FQ1’23, similarly triggering the expansion in its mobility services revenues to $15.5B (+1.9% QoQ/ +5.4% YoY), despite the decline in its equipment revenues to $5.1B (-16.3% QoQ/ -5.5% YoY). This cadence suggests the sustained expansion of its subscriber base, on top of the notable mix shift to higher-priced unlimited plans.
On the other hand, investors need to monitor T’s growing long-term debts at $137.5B (+1.1% QoQ and -33.7% YoY), with an average interest rate of 4.1% (in line QoQ and +0.3 points YoY). This has resulted in “higher bad debt expenses,” with annualized interest expenses of $6.8B (+8.9% QoQ/ +4.9% YoY), as highlighted in the FQ1’23 press release.
However, with only $6.92B of the telecom’s long-term debts due in 2023 and $8.95B in 2024, we are not overly worried yet, due to the robust annualized adj. EBITDA of $42.32B (+3.8% YoY), on top of the extremely well-laddered debts through 2097.
So, Is T Stock A Buy, Sell, or Hold?
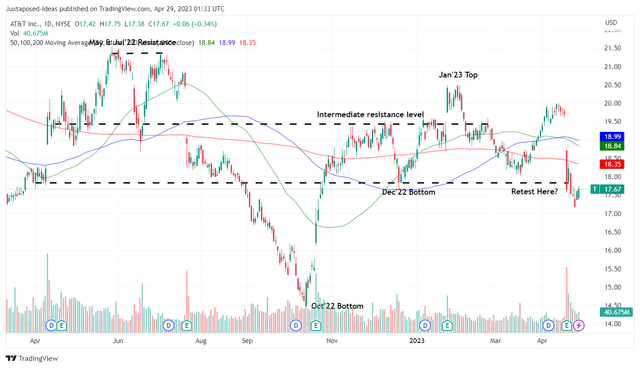
T 1Y Stock Price

TradingView
Due to the marked pessimism post-earnings call, T has unfortunately breached its December 2022 bottom and tether precipitously at the time of writing. It remains to be seen if the stock may successfully rebound from the sell-off.
Assuming that these levels hold over the next few days, we reckon interested investors may consider adding here an excellent forward dividend yield of 6.30%, compared to its 4Y average of 6.93% and sector median of 3.28%.
Nonetheless, investors must also note the stock’s potential for underperformance in the near term, attributed to the minimal margin of safety to our price target of $18.65. This is based on the market analysts’ projected FY2024 EPS of $2.49 and its NTM P/E of 7.49x.
As a result, bottom-fishing investors may consider waiting a little longer and adding T at the next retracement to the October 2022 bottom of $14s, for an improved upside potential of 28% to our price target. Given the increased likelihood of a mild recession by H2’23, more market pessimism may be unavoidable, in our view.
Analyst’s Disclosure: I/we have a beneficial long position in the shares of TMUS either through stock ownership, options, or other derivatives. I wrote this article myself, and it expresses my own opinions. I am not receiving compensation for it (other than from Seeking Alpha). I have no business relationship with any company whose stock is mentioned in this article.
The analysis is provided exclusively for informational purposes and should not be considered professional investment advice. Before investing, please conduct personal in-depth research and utmost due diligence, as there are many risks associated with the trade, including capital loss.
Seeking Alpha’s Disclosure: Past performance is no guarantee of future results. No recommendation or advice is being given as to whether any investment is suitable for a particular investor. Any views or opinions expressed above may not reflect those of Seeking Alpha as a whole. Seeking Alpha is not a licensed securities dealer, broker or US investment adviser or investment bank. Our analysts are third party authors that include both professional investors and individual investors who may not be licensed or certified by any institute or regulatory body.
