Summary:
- AT&T reported declines in revenues but surpassed expectations for growth in free cash flow, new wireless subscribers, and quarterly EPS figures.
- The company’s performance was driven by gains in fiber and 5G, and an increasing number of consumers purchasing AT&T’s premium unlimited phone plans.
- Despite improvements in key areas, AT&T’s share prices remain in a long-term downtrend and have only seen modest gains.
Anne Czichos
AT&T Inc. (NYSE:T) continues its love-hate relationship with dividend investors as share prices are caught in a powerful downtrend that continues to erode the overall allure of the stock’s sizable 6.59% annual dividend yield. For the first-quarter period, AT&T reported declines in earnings but surpassed analyst expectations for growth in free cash flow, new wireless subscribers, and quarterly EPS figures. Large portions of this encouraging performance were driven by gains in fiber and 5G, and an increasing number of consumers purchasing AT&T’s premium unlimited phone plans, even while the company has relied on budget offerings to drive growth and compete with Verizon (VZ), T-Mobile (TMUS), and other rivals in highly sought-after markets.
Q1 2024 Earnings & Highlights (AT&T)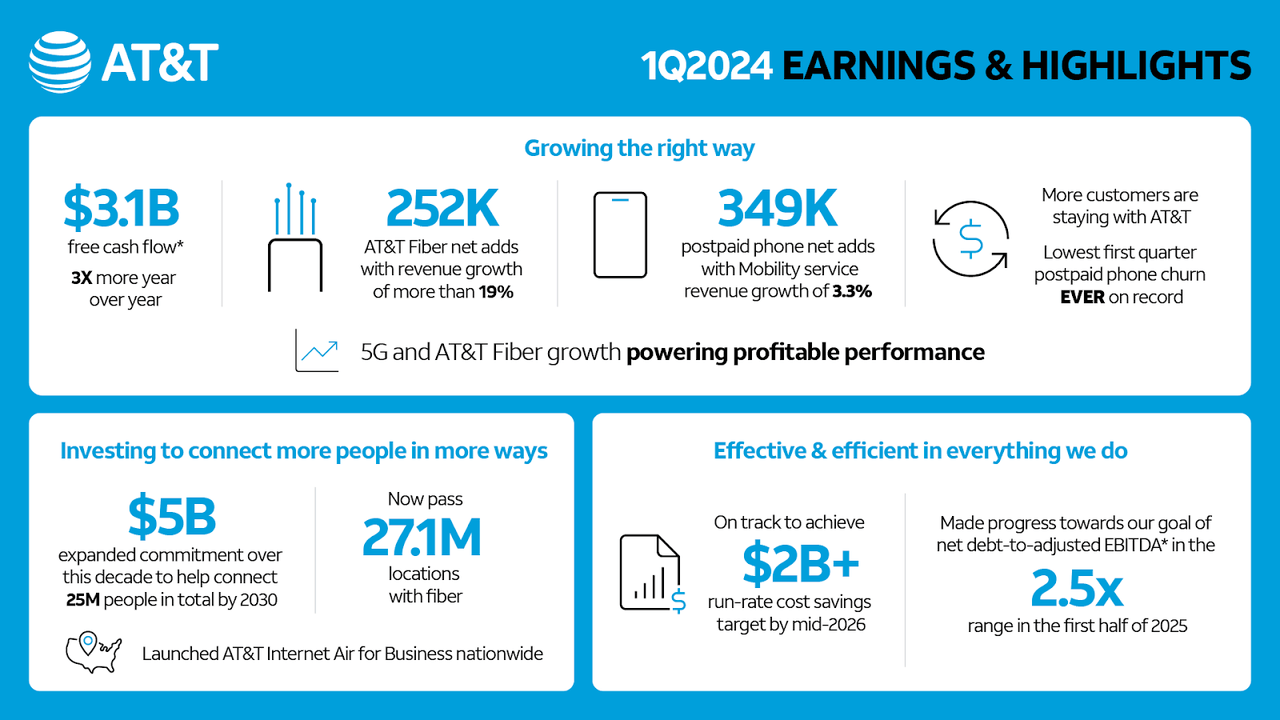
For the quarter, AT&T reported adjusted per-share earnings of $0.55 (which surpassed consensus estimates of $0.53 per share and marked an annualized decline of 8% for the period). First-quarter revenues posted at $30 billion (falling short of market expectations calling for $30.5 billion and indicating a small annualized decline of 0.5%). Free cash flow figures came in at $3.1 billion (well above consensus expectations of $2.4 billion), providing an added measure of security for any investors that might be concerned about the sustainability of AT&T’s generous dividend yields.
AT&T Mobility (AT&T)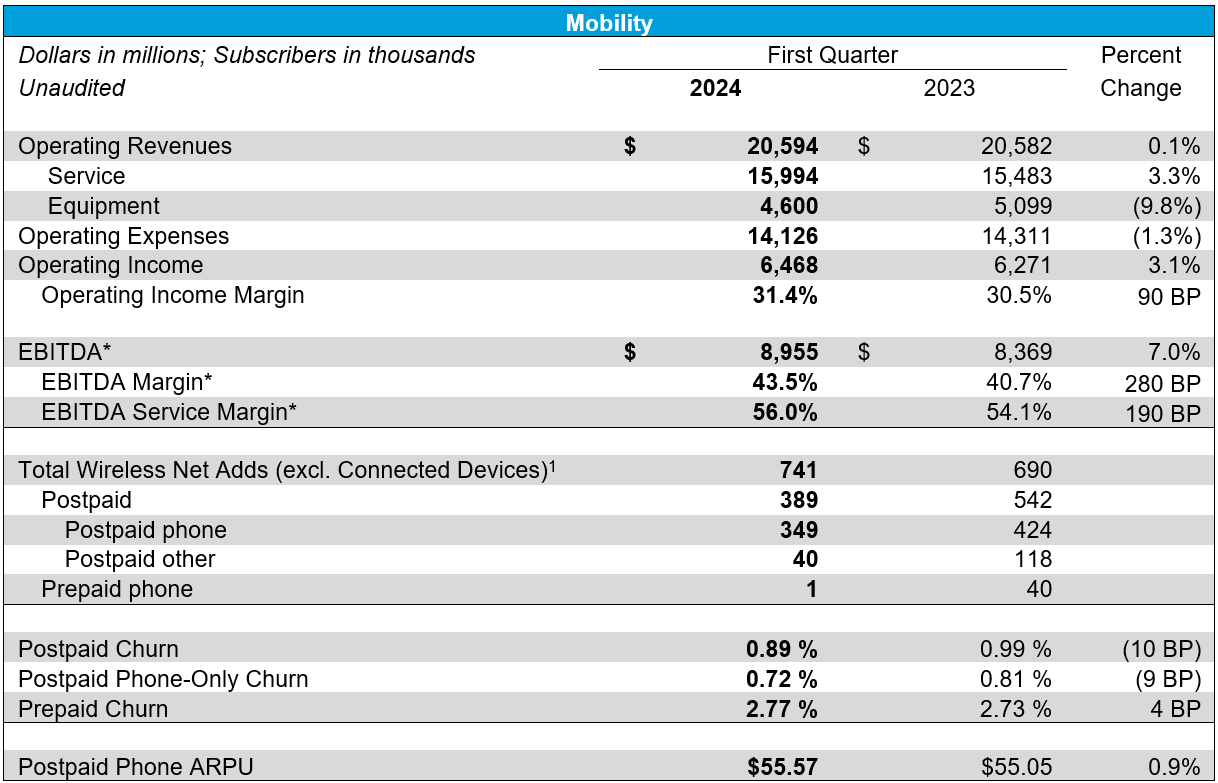
Growth in wireless consumers with postpaid service plans showed an increase of 349,000 (which also beat analyst expectations of 287,000 new users), which marks a 17.7% decline from the 424,000 figure that was posted during the same period last year – but it is important to note that declining subscriber figures have also been reported by Verizon and T-Mobile, so this is not a trend that is specific to AT&T alone.
On the positive side, AT&T saw significant improvements in the number of wireless users that are changing to wireless competitors. For the quarter, churn in the company’s postpaid service improved by 10 basis-points (at 0.89%), which beat analyst expectations by 12 basis-points.
Major Long-Term Support Levels (Income Generator via TradingView)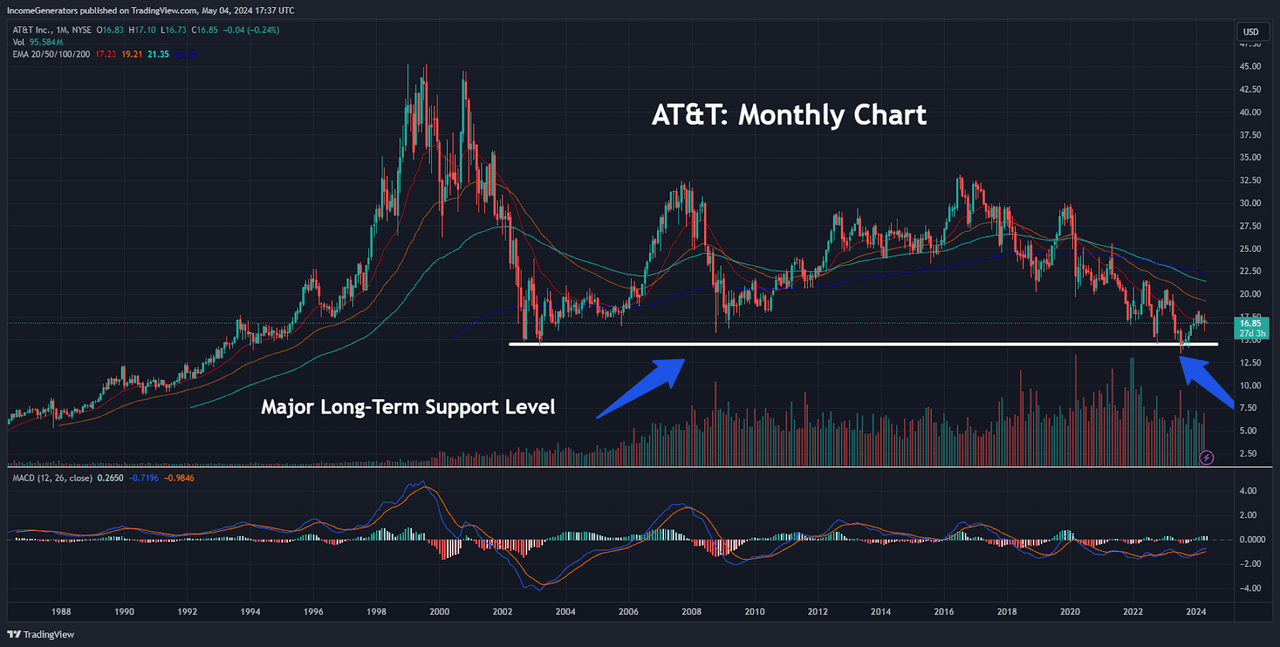
However, despite these significant areas of improvement, share prices have only seen modest gains. On the monthly chart, we can see that AT&T stock is currently in the process of grinding through major long-term support levels. Specifically, AT&T shares are still trading within close proximity to the March 2003 lows of $14.23 – and we have already seen a prior break below this level in July 2023 (when the stock hit its long-term lows of $13.23).
Unfortunately, upward bounces out of this area have been extremely weak and this buying activity has not been strong enough to break the long-term downtrend AT&T investors have been experiencing since 2016. Not surprisingly, monthly indicator readings in the Moving Average Convergence Divergence (MACD) are flatlining in negative territory, and share prices themselves are below all of the major exponential moving averages (20-month, 50-month, 100-month, and 200-month EMAs).
Long-Term Downtrend (Income Generator via TradingView)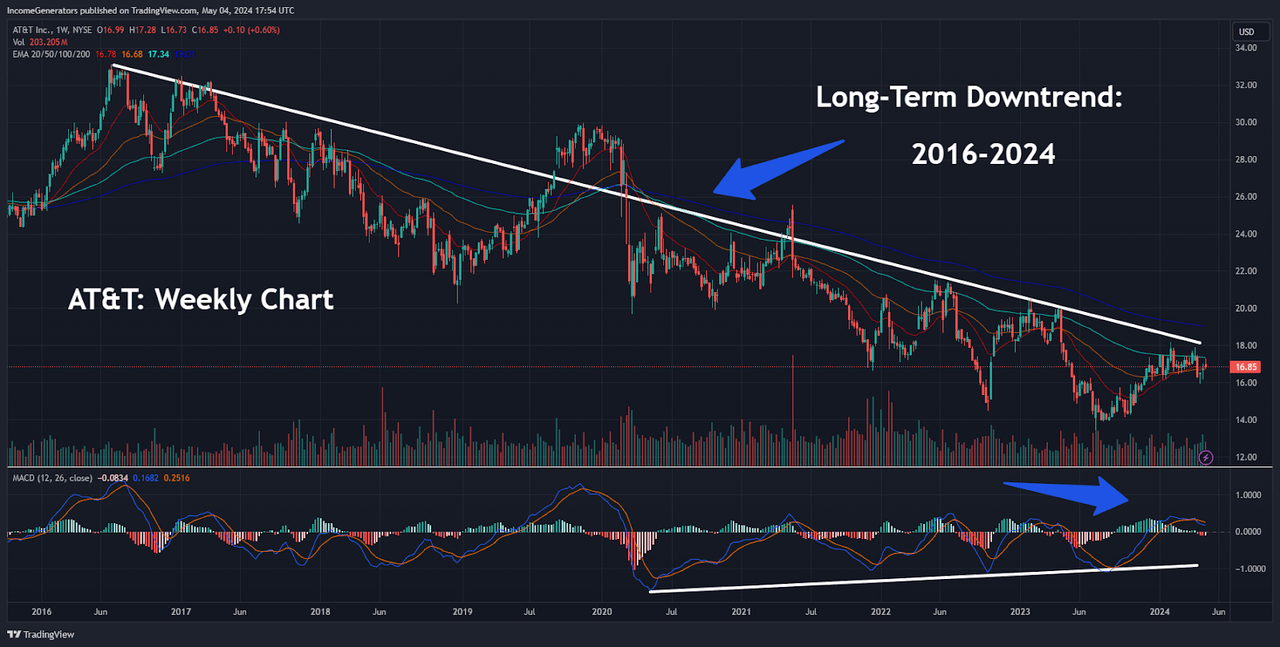
Needless to say, these are all heavily bearish signals and these price indicators are working together to confirm the validity of the stock’s long-term downtrend (which has been in place for an extended period of time). Of course, we did see two minor breaks of this downtrend, but we are viewing these upward moves as false breakouts – given the lack of consistent follow-through and the lower price lows that were posted during subsequent trading weeks.
On the positive side, we can see that the weekly MACD reading is holding in slightly bullish territory – but this reading could be short-lived given the fact that we are already rolling over from these areas, and we have yet to see a convincing break above the weekly exponential moving average cluster.
Long-Term Indicator Variations (Income Generator via TradingView)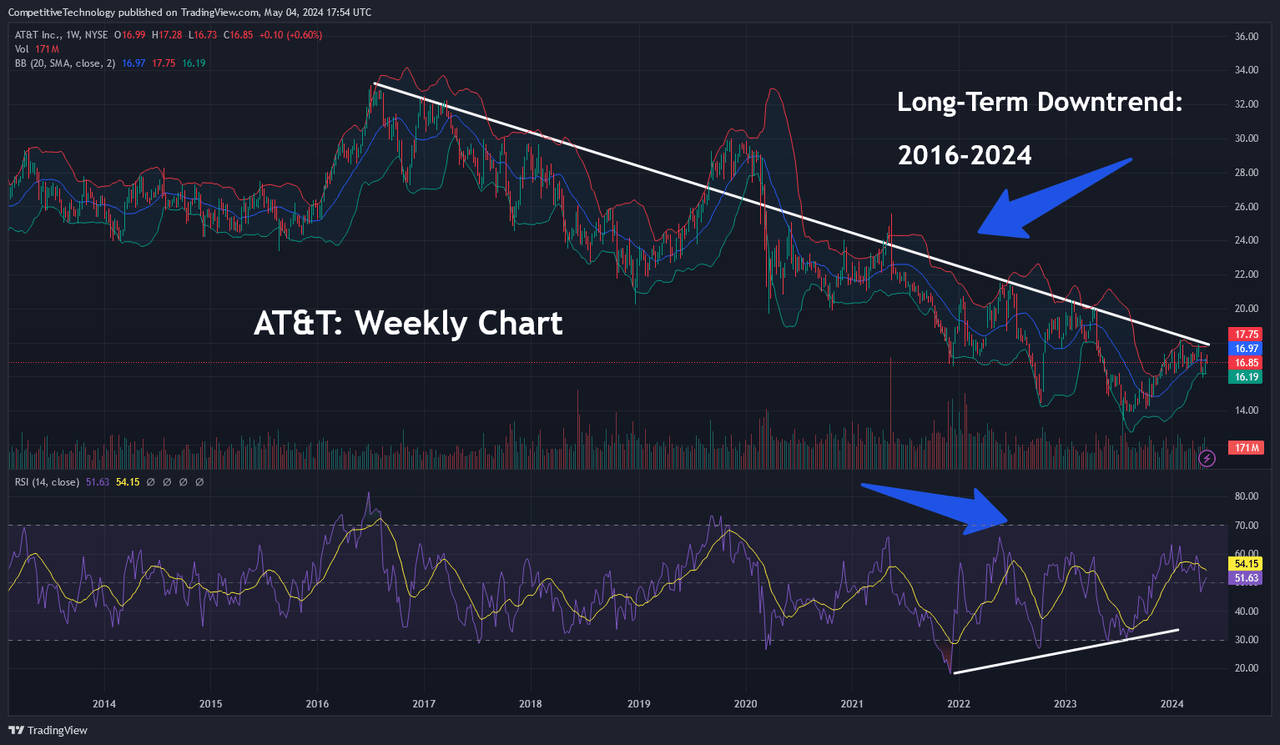
In this chart, we have plotted the stock’s long-term downtrend against different indicator readings to give us a slightly varied view of what is occurring now with share prices. Specifically, this chart plots share prices against the weekly Bollinger Bands and in relation to the Relative Strength Index (RSI).
Unfortunately, this analysis also fails to give us convincingly bullish signals because even though weekly RSI readings are bullish from the middle of the histogram (in other words, nowhere near overbought territory), share prices themselves are also coming into contact with the upper Bollinger Band (which implies that the current short-term upward movement in prices might be in danger of reversing lower).
Short-Term Uptrend Breaks (Income Generator via TradingView)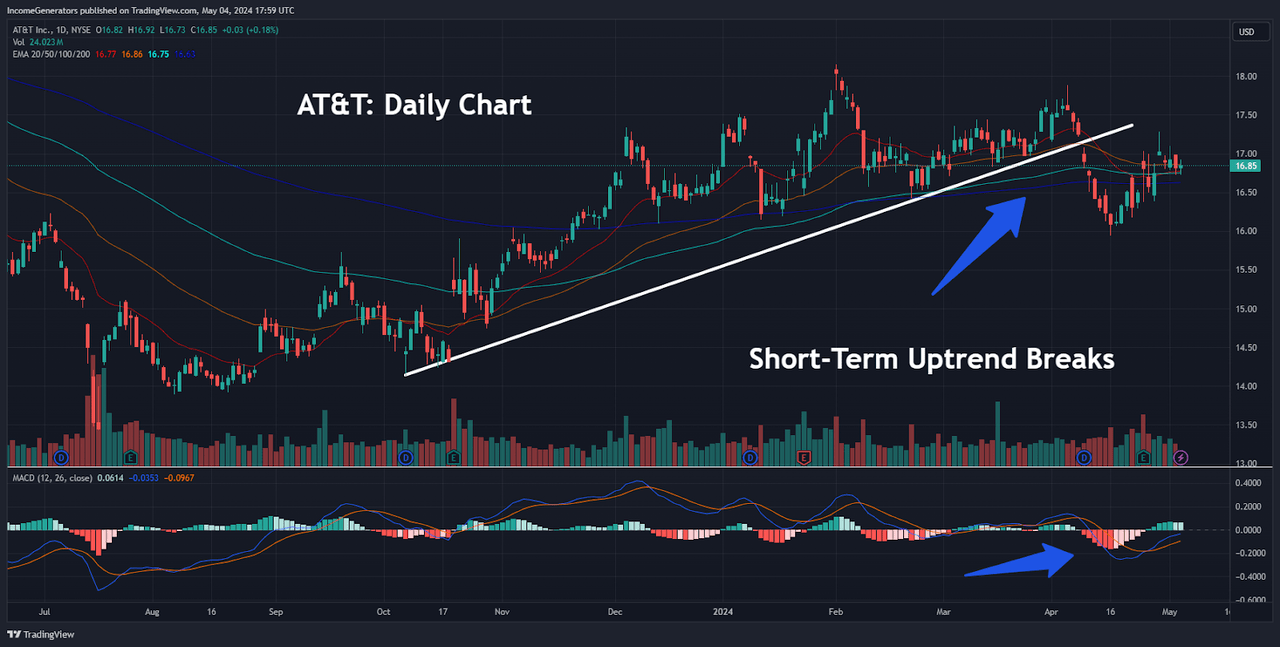
To identify potential timeframes indicating when the next downturn might occur, we can look at trend activity on the daily charts. Here, we can see that shares of AT&T stocks have broken the uptrend in share prices which began during the second-half of last year.
On the daily charts, we can also see that share prices in this stock tend to initiate new trend activity when prices break above (or below) their 20-day, 50-day, 100-day, and 200-day exponential moving average cluster. Not surprisingly, the short-term uptrend in AT&T share prices came to an end when the stock fell below this closely-watched indicator – and bearish momentum activity in the daily MACD reading confirms the validity of this downside break.
Fibonacci Retracement Levels (Income Generator via TradingView)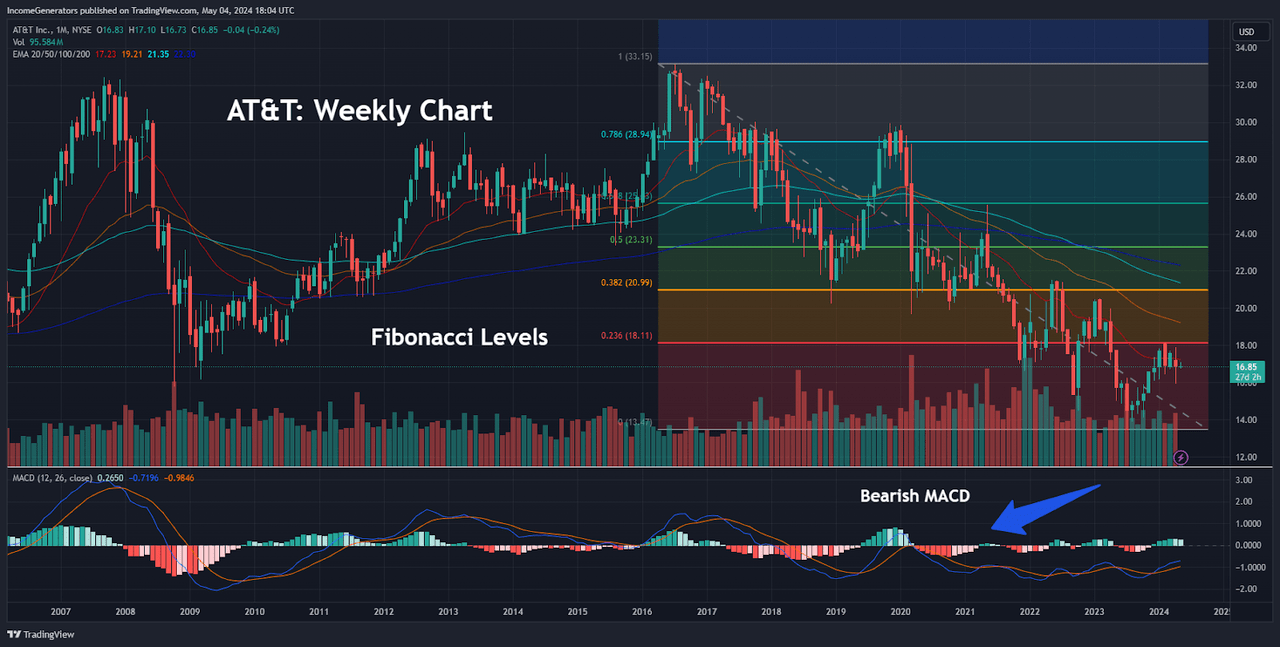
Since the overall bias here remains negative, it will be important for investors to assess the longer-term trend activity and identify price zones which might encounter upward resistance going forward. Ultimately, breaks of resistance zones will be needed in order for positive trend momentum to begin to accelerate. To accomplish this, we can look at weekly Fibonacci retracement analysis, and we will need to consider the stock’s dominant downtrend move, which began in July 2016 (at $33.13) and extended all the way to $13.43 in July 2023.
As we can see, share prices are currently contending with the 23.6% Fibonacci retracement of this dominant move (which is located near $18.10). At the same time, the 50-week moving average is quickly descending and is currently within close proximity to this level, so an upside break here would likely take pressure off of the downside. Beyond this price zone, the 38.2% retracement would mark the next level of potential resistance (located just below $21 per share). From here, the following Fibonacci levels are located at $23.31 (50% retracement), $25.60 (61.8% retracement), and $29.84 (78.6% retracement). In our view, we would need to see a bullish break of the 38.2% retracement level in order to take pressure off of the downside and force an upside test of the upper retracement zones.
On balance, we can see that AT&T investors have a good amount of “wood to chop” before we can begin to alter the stance and adopt a bullish stance. Fortunately, it remains clear that AT&T’s foundational business remains strong when we look at the company’s relative position within this competitive industry, and clear strength in the company’s ability to generate free cash flow should continue to provide an element of safety for income-conscious investors focused on the stock’s attractive 6.59% dividend yield.
As a result, we will continue to maintain our long position in this income powerhouse, but we will need to see a clear break our outlined resistance levels before we can turn to a more bullish outlook. Until then, it is likely that AT&T will continue to remain heavy against highly important long-term support levels (originally formed in March 2003), with upside bounces limited near-term.
Analyst’s Disclosure: I/we have a beneficial long position in the shares of T either through stock ownership, options, or other derivatives. I wrote this article myself, and it expresses my own opinions. I am not receiving compensation for it (other than from Seeking Alpha). I have no business relationship with any company whose stock is mentioned in this article.
Seeking Alpha’s Disclosure: Past performance is no guarantee of future results. No recommendation or advice is being given as to whether any investment is suitable for a particular investor. Any views or opinions expressed above may not reflect those of Seeking Alpha as a whole. Seeking Alpha is not a licensed securities dealer, broker or US investment adviser or investment bank. Our analysts are third party authors that include both professional investors and individual investors who may not be licensed or certified by any institute or regulatory body.
