Summary:
- During its recent Q4 earnings report, AT&T reaffirmed its commitment to rewarding investors with attractive dividends.
- More importantly, it also emphasized its confidence to improve the CREDIT QUALITY of its dividends.
- My own assessments indeed support management’s views.
- Its Free Cash Flow Dividend Payout Ratio has dramatically improved and its dividend coverage ratio sits near a record high.
- After all, dividends still do not lie.
Bambu Productions
Thesis
AT&T (NYSE:T) recently released its 2022 Q4 and full-year earnings report (“ER”). By this time, many other SA authors have dissected almost every detail of its ER. So, here I will directly get to the point and discuss a topic that has not been talked about too much – the credit quality of its dividend.
As a textbook dividend stock, there is not a surprise that management reaffirmed its commitment to rewarding investors with attractive dividends during its recent Q4 ER. However, the following statement made by its CEO John Stankey (slightly edited with emphases added by me) caught my attention.
As we look at our last priority, we also continue to generate meaningful levels of free cash flow even with record levels of investment. This gives us confidence in our ability to continue delivering an attractive dividend today and in the future, while also improving the credit quality of that dividend as we expect to increase our cash generation over time.
He made a special point to emphasize the improvement of the CREDIT QUALITY of its dividends, which triggered me to perform my own assessments and see if the numbers support his comments. And the results show that they do, as I will detail in the remainder of this article.
Dividends do not lie
Before diving into T, let me first confess that the title is stolen from two books. The first one is Geraldine Weiss’ classic, Dividends Don’t Lie (published in 1988). The success of this book led to another book, entitled Dividend Still Do Not Lie. I recommend both whether you are dividend investors or not. The insights of using dividends to evaluate the financial health of a company (and the limits of other metrics like GAAP earnings) of are general relevance.
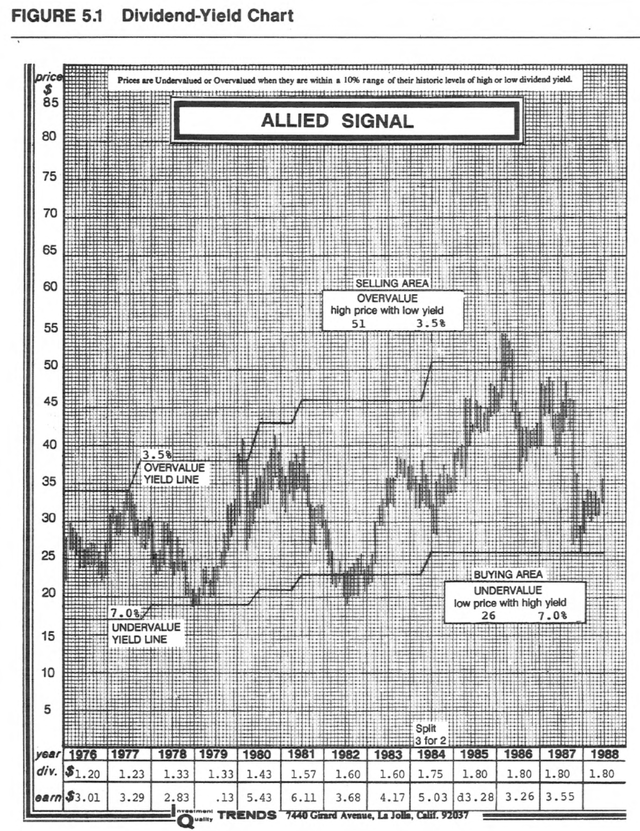
In particular, these books described the use of a yield chart, an example shown below, as a way to gain insights into the owner’s earnings. This is also a simple yet timeless insight in my view. In particular, I picked Allied Signal here for a couple of reasons. It was a blue chip stock in its own days (the 1970s and 1980s) just like T. It has witnessed large price volatilities while paying steady dividends, again just like T. And the books described the dividend-yield bands, those two stepwise lines in the chart, to gauge the valuation and margin of safety.
Next, I will analyze T’s dividends along the lines described in these books and examine not only its dividend yield but more importantly, also the quality of its yield.
Source: Dividends Don’t Lie by Geraldine Weiss
T’s yield bands
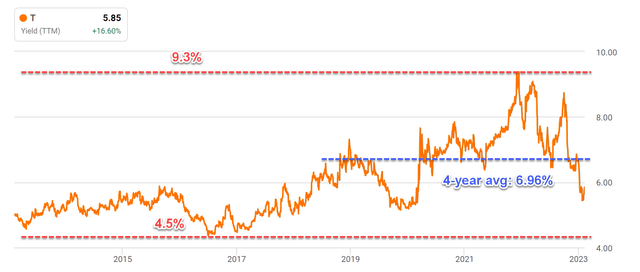
Thanks to technology, I do not need to plot the yield bands in the tedious way Weiss did 3 decades ago. The yield chart below shows the same information in a much more visual way. This chart clearly shows the regimes of extreme undervaluation and overvaluation. To wit, in the earlier part of the decade, the yield for T was as low as 4.5%, signaling extreme overvaluation. On the other hand, in 2022, the dividend yield peaked above 9.3%, signaling extreme undervalued.
Currently, T’s dividend yield of 5.85% is a bit lower than its 4-year average of 6.96% on the surface. However, investors have to bear in mind that its current yield is lower because of the Warner Media spinoff. Once the effects of the spinoff are accounted for, the yield is not only attractive but also enjoys a better credit quality as discussed next.
Author based on Seeking Alpha data
T: dividend credit quality
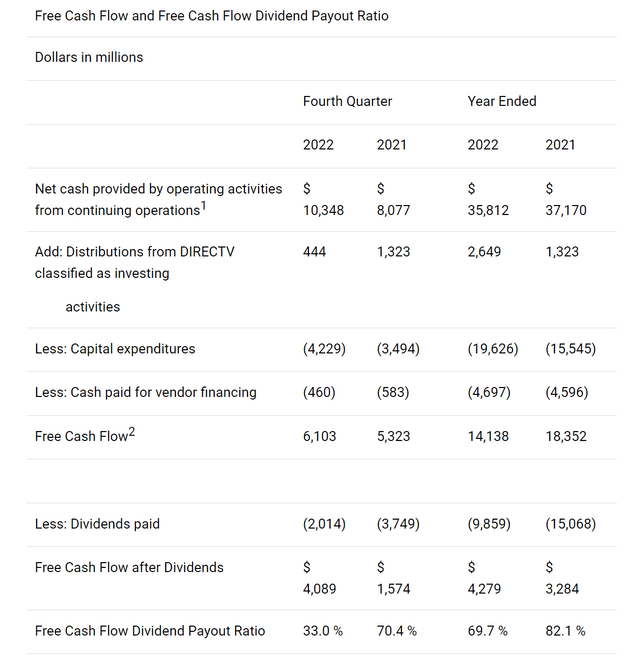
T’s dividend coverage was a bit concerning in recent years as you can see from the following FCF (free cash flow) coverage below. As seen, its FCF dialed in at $18.3 billion during 2021 and it paid a total of $15.1 billion in dividends. As a result, its FCF payout ratio was 82.1% for 2021, a pretty stretched level in my view given its heavy CAPEX investment needs. The picture improved quite a bit in 2022 and dramatically in the 4th quarter. To wit, its FCF payout ratio improved to 69.7% for 2022. And during Q4 2022, the FCF coverage is only 33%.
As detailed in my earlier article here, the above simple FCF payout ratios are limiting in several ways:
- The simple FCF payout ratio ignores a firm’s current asset. Obviously, for two firms with the same earning power, the one with more current assets (e.g., cash and equivalent) sitting on its balance sheet should have a higher level of dividend safety.
- The simple payout ratio also ignores the upcoming financial obligations. Again, obviously, for two firms with the same earning power, the one with a lower level of obligations (pension, debt, CAPEX expenses, et al) should have a higher level of dividend safety.
Readers familiar with our approach know that we always want to go a step further and analyze the credit quality of dividends more holistically using the dividend cushion ratio (“DCR”). A detailed description of DCR is provided in Brian M Nelson’s book entitled Value Trap or our earlier articles (and a brief summary is quoted below).
The DCR is a ratio that sums the existing net cash (total cash less total long-term debt) a company has on hand (on its balance sheet) plus its expected future free cash flows (cash from operations less all capital expenditures) over the next five years and divides that sum by future expected cash dividends (including expected growth in them, where applicable) over the same time period. A DCR above 1 indicates that the company has sufficient financial capacity to pay out its expected future dividends. The higher the DCR, the better the dividend safety, all else equal.
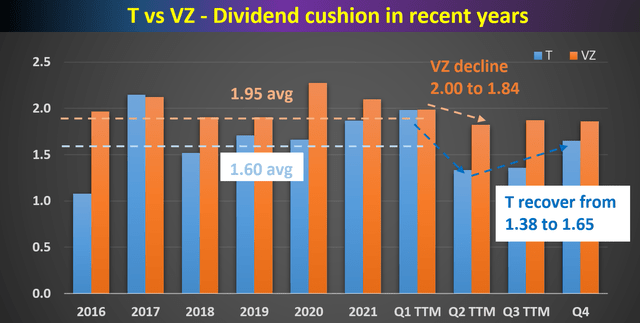
The next chart shows the DCR of T together with that of VZ to provide a better context. as you can see from the following chart, T has been maintaining an average DCR of ~1.60x in the long term. It is lower than VZ’s 1.95 but already substantially above the threshold of 1x. You can see the challenges T faced during 2021~2022. Its DCR dropped from a 2x level to about 1.38 in Q2 of 2022 (based on TTM financials). And you can see the improvement since then. All told, its DCR sits at 1.65x based on its Q4 financial, which is slightly above its long-term average.
Looking forward, I view T in a much strong position with the WarnerMedia spinoff completed. The spinoff reduced T’s debt burden substantially and provided it with the capital flexibility that it sorely needed. The lower interest expense from the debt reduction alone would expand its margin by about 115 bps as analyzed in my earlier article. And I also see it to better focus on its 5G and fiber infrastructure, paving the way for future growth.
Risks and final thoughts
T has been facing some chronicle headwinds, mainly the competition intensification, the decline of its traditional revenue streams, and also regulations. Competition in the telecommunication space is quite intense, with several dominant players such as VZ and also new entrants. The decline of traditional forms of media, such as cable television, has been pressuring its revenue streams for years and is still ongoing. And finally, the telecommunications industry is heavily regulated and will remain so as far as I can see. T must navigate this complex regulatory environment in order to grow.
However, my final verdict is that these headwinds have been fully priced in already at its current valuation (as demonstrated by its attractive yield and the dividend bands shown earlier). On the other hand, the growth potential and the quality of its dividend yield are not properly priced in as I see it.
Disclosure: I/we have a beneficial long position in the shares of VZ either through stock ownership, options, or other derivatives. I wrote this article myself, and it expresses my own opinions. I am not receiving compensation for it (other than from Seeking Alpha). I have no business relationship with any company whose stock is mentioned in this article.
Join Envision Early Retirement to navigate such a turbulent market.
- Receive our best ideas, actionable and unambiguous, across multiple assets.
- Access our real-money portfolios, trade alerts, and transparent performance reporting.
- Use our proprietary allocation strategies to isolate and control risks.
We have helped our members beat S&P 500 with LOWER drawdowns despite the extreme volatilities in both the equity AND bond market.
Join for a 100% Risk-Free trial and see if our proven method can help you too. You do not need to pay for the costly lessons from the market itself.


