Summary:
- Bank of America’s stock has surged by 13.47% since my previous coverage, prompting a reevaluation of its investment potential.
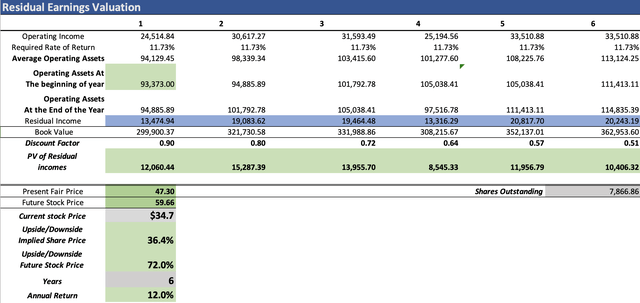
- Q1 2024 data leaves a fair price estimate at $47.30, with a $59.66 future target, indicating 36.4% near-term upside and 12% annual returns.
- BofA plans expansion by opening 37 new financial centers across nine states by 2026.
- It demonstrates robust financial stability, holding significant cash reserves and a strong market position.
Spencer Platt
Thesis
In my previous article covering Bank of America Corporation (NYSE:BAC), I rated the stock as a buy after assigning a fair price target of $39.41 and a future price of $67.80. At that time, the stock was trading at $33.40 and now, when writing this article, the stock price has climbed to $34.70.
In this article, I will update my valuation model for Bank of America with the information of Q1 2024, released on April 16, 2023. To see if the stock still represents an opportunity entering into Q2 2024.
After re-evaluating the stock, I decided to maintain my buy rating on Bank of America after arriving at a fair price estimate of $47.30 and a future price target of $59.66. These targets imply that Bank of America has a near-term upside of 36.4% and is positioned to deliver 12% annual returns throughout 2029. Nevertheless, I think that the 36.4% upside (which is the fair price adjustment) is where the opportunity is. This is because the 12% annual returns until the stock reaches the future price ($59.66), are slightly over the market’s historical performance of 10.45%, which means that there is not that much margin of safety.
Overview
Growth Plan
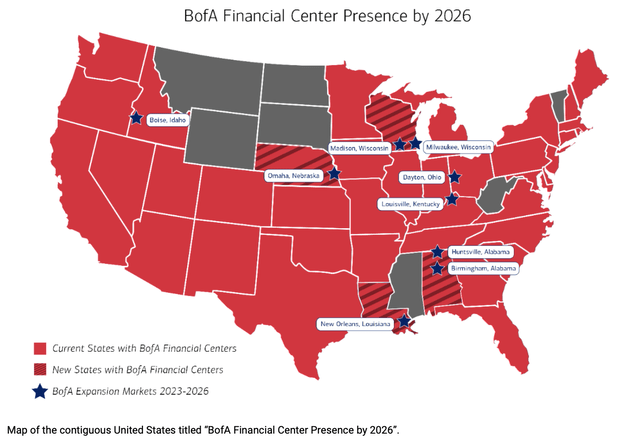
BofA’s growth plan is to expand its presence in the US. For example on June 27, 2023, BofA announced its plan to open new financial centers. The plan is as follows: 5 in Omaha, 5 in Louisville, 4 in Boise, 5 in Birmingham, 3 in Madison, 5 in New Orleans, 5 in Milwaukee, 3 in Dayton, and Huntsville. This brings a total of 37 new financial centers.
With this, BofA will have a presence in 39 states, therefore, there are still 11 more states to which BofA can expand. These expansions will be fully materialized by 2026.
How does Bank of America Compare to Peers?
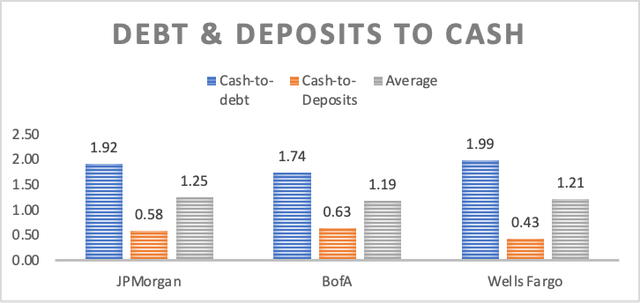
Bank of America currently stands better concerning deposit coverage, since it has enough money to cover around 63% of deposits. However, it scores less relating to debt coverage, since it can cover around 1.74 times its total debt. Nevertheless, that is more than enough, since it exceeds 100% of the total debt.
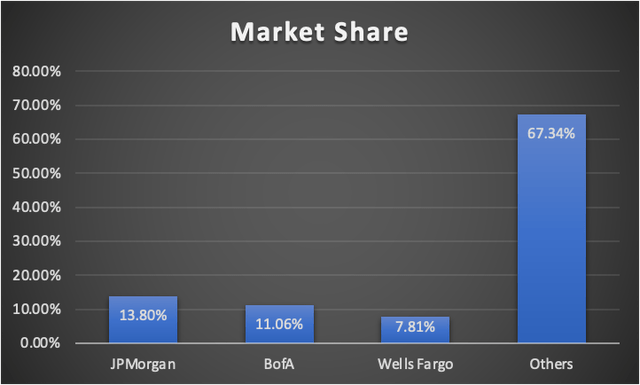
Bank of America holds around 11.06% of total US deposits second to JPMorgan and ahead of Wells Fargo. This was calculated by dividing the total deposits of each of these banks by the total amount of deposits in the US banking system which is around $17.4 trillion.
This is by itself impressive since in the US there are around 4,614 banks, which means that the other banks included in “others” each could have on average a market share of 0.014%.
Industry Outlook
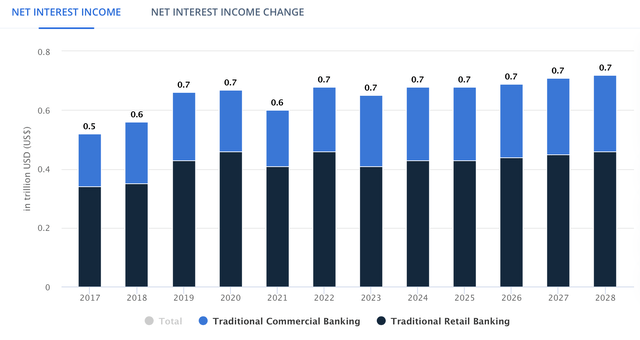
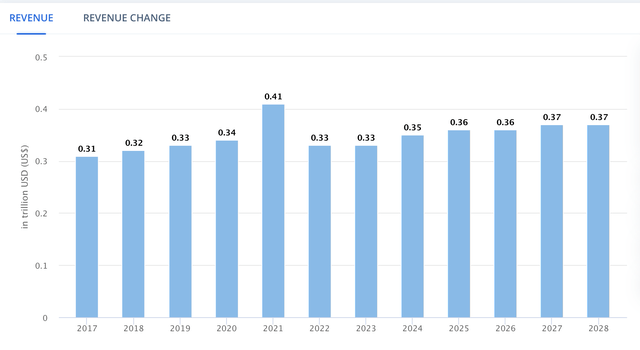
The US Traditional Banking Market is expected to grow at a 1.44% annual rate throughout 2028. This market includes retail and commercial banking. Then, the global investment banking is expected to grow by 1.4% annually throughout 2028. Currently, the addressable market of BofA in these two markets stands at $1.03T.
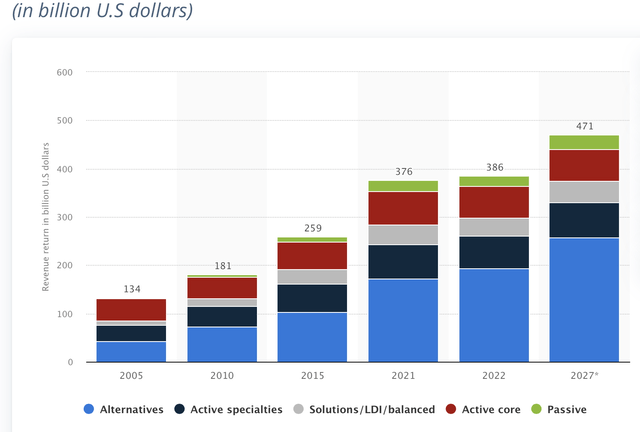
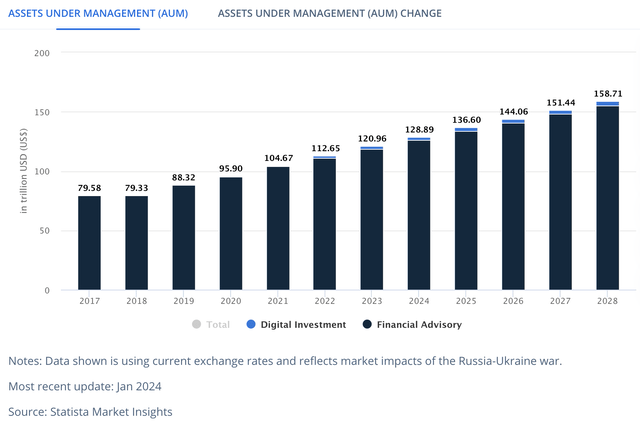
Finally, Worldwide Asset Management and Wealth Management are estimated to display higher annual growth rates of 4.40% and 5.90%. The addressable revenue of Asset Management currently stands at $402.98B and in the case of Wealth Management, there is an addressable AUM of $120.96T.
Summing all of this up, we can deduce that Bank of America has an addressable revenue of around $1.43T (in Traditional & Investment banking, and Asset Management) which is expected to climb to $1.56T for 2028. Then it also has an addressable AUM of $120.96T in wealth management, which is expected to increase to $158.71T by 2028.
Valuation
To value Bank of America, I will use a Residual Earnings model. The first step is the discount rate which will be calculated through a simple CAPM model. The required rate of return came out at 11.72%.
| CAPM | |
| Risk-Free Rate | 4.639% |
| Beta | 1.22 |
| Market Risk Premium | 5.811% |
| Required Rate of Return | 11.728% |
Operating assets at the start of 2024 currently stand at $93.37B. This number was calculated by subtracting cash reserves ($1.23T, excluding trading asset securities) and total deposits ($1.94T) from total assets ($3.27T). This is because the operating assets are the book of loans (and any other asset that generates cash), which generates cash and these loans are possible due to deposits (the operating liability). Furthermore, book value currently stands at $293.55B.
Both metrics will be predicted through margins tied to revenue. As you can see in the table below, the operating assets margin came out at 99.14%, and the book value margin at 313.33%.
| Operating Assets | 93,373.0 |
| Book value | 293,552.0 |
| Operating Assets / Revenue | 99.14% |
| Book Value / Revenue | 313.33% |
The first step is to calculate revenue. For this reason, I will use 2023 as the base year and I will fill each segment revenue as how it was in that year according to Bank of America’s FY2023 10-K.
Now, it’s time to predict how could revenue be affected in the case of interest rate fluctuations. Let’s remember that the FED said last year that they planned to cut interest rates near the end of this year, 2024. For this reason, I will make revenue for 2024 across all segments contract by 3.32% as what mostly will happen this year is consumption deacceleration. Then for 2025, when there should be further interest rate cuts, consumption will start to grow positively so it will increase by 6.57%.
Then, for 2027, I am expecting the FED to hike interest rates, which will cause consumption to slow down and therefore revenue across all segments will fall by 6.64%. For 2028, revenue will recover and increase by 13.14% because higher interest rates coupled with the low interest rates that BofA usually pays on deposits will increase the bank’s profitability.
The reason why I am expecting the FED to hike interest rates in 2027 (or it could also be in 2028) is because in the situation we are currently seeing, it’s very probable that as soon as inflation hits 2%, the FED will already be cutting interest rates. This is not the same as what happened in 2008, because it was a profound crisis that ensured price stability for many years. Full recovery was finally achieved in 2015-2016. What I want to say is that the FED will probably return to its previous pattern of rate hikes and rate cuts which is around 4-6 years from peak to peak, and of course, before each peak, there were around 2 years of rate hikes.
For years 2026 and 2029, revenue across all segments will grow at par with their respective markets. These growth rates were previously discussed in the “Industry Outlook” section. You can see the growth rates in the table below.
Then, regarding net income margins, for doing this I will mostly work with historical data. In 2020 when interest rates were cut, BofA’s net income margin contracted by 7.94%, however, this was also due to the reduction in spending derived from the lockdown. Nevertheless, since the consumer is still somewhat strong and there likely won’t be another quarantine, I will make contractions in the net income margin to be half of that, 3.97%. Furthermore, in the immediate year after that contraction, the net income margin will recover all that loss.
| My Net income Margins % | |
| 2024 | 24.18% |
| 2025 | 28.15% |
| 2026 | 28.15% |
| 2027 | 24.18% |
| 2028 | 28.15% |
| 2029 | 28.15% |
In the table below, you can see the results of these calculations. The operating income was calculated by multiplying the net income margin by revenue and then adding taxes. Since this is a Residual Earnings model, D&A and interest on long-term debt wouldn’t be used. Nevertheless, you can still see them.
| Revenue | Operating Income | Plus D&A | Plus Interest | |
| 2024 | $95,713.1 | $24,514.8 | $26,536.64 | $26,536.64 |
| 2025 | $102,680.2 | $30,617.3 | $32,786.24 | $32,786.24 |
| 2026 | $105,954.1 | $31,593.5 | $33,831.62 | $33,831.62 |
| 2027 | $98,366.9 | $25,194.6 | $27,272.41 | $27,272.41 |
| 2028 | $112,384.4 | $33,510.9 | $35,884.83 | $35,884.83 |
| 2029 | $115,836.5 | $34,540.2 | $36,987.11 | $36,987.11 |
| ^Final EBITA^ |
Finally, the model will also suggest what could be the stock price for 2029. This was calculated using the undiscounted residual earnings instead of the discounted ones and the future expected book value. The reason for this is that these undiscounted residual earnings reflect their future value. After all, they are not discounted to express their present value.
The resulting fair price from the valuation process is $47.30, which is 36.4% higher than the current stock price of $34.70. The future stock price came out at $59.66 which implies annual returns of around 12%.
Nevertheless, I think that the opportunity in the stock is to realize the fair price adjustment upside, since the 12% annual return, although decent, is not one of the best ones that can be found on the market.
How do My Estimates Compare with the Average Consensus?
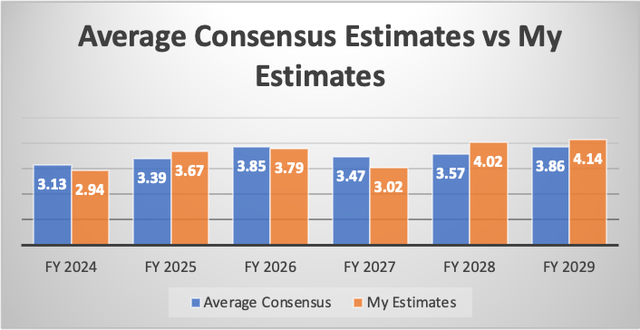
If I did a model completely based on available average estimates, I would get a fair price of $48.67, which suggests a 40.3% upside from the current stock price of $34.68. Furthermore, the future price would be $60.02, which translates into 12.2% annual returns, which is close to the historic performance of the market.
In the graph below you can see a comparison of my EPS results with the average consensus. As you can see, my EPS estimate for 2024 is 6.01% lower than the average consensus. My estimates are also lower for 2026 & 2027, but higher for 2025, 2028, and 2029. Overall, my estimates are 1.18% higher than the average consensus.
Risks to Thesis
The main risk to my thesis is that those new financial centers aren’t as profitable as expected. Nevertheless, I think that the risk is less since they are just opening 37 new locations in 9 states where they didn’t have a presence. The risk would be higher if they opened 400-600 new branches for example.
Secondly, monetary policy plays a very important role in the bank’s profitability. Big banks such as Bank of America have the advantage that they can offer lower interest rates on deposits because of the perceived security of having a deposit at a big bank. This means that they can pay little interest to depositors while charging high interest rates on loans. This enhances the bank’s profitability. Nevertheless, predicting these interest rate hikes that will later affect overall consumption and activity in the economy is important, and there is the possibility that I have gotten them wrong.
Conclusion
In conclusion, Bank of America still has a very considerable upside to be realized. After evaluating the stock, I concluded that Bank of America is undervalued by around 36.4% which means that its fair value estimate stands at around $47.30. Furthermore, the future price estimate yielded a result of $59.66 which translates to 12%, slightly outperforming the overall market. This may not seem like that much, but at least it leaves a decent safety margin to hope for M&As or expansions into other markets. For these reasons, I maintain my “buy” rating on the stock.
Analyst’s Disclosure: I/we have no stock, option or similar derivative position in any of the companies mentioned, but may initiate a beneficial Long position through a purchase of the stock, or the purchase of call options or similar derivatives in BAC over the next 72 hours. I wrote this article myself, and it expresses my own opinions. I am not receiving compensation for it (other than from Seeking Alpha). I have no business relationship with any company whose stock is mentioned in this article.
Seeking Alpha’s Disclosure: Past performance is no guarantee of future results. No recommendation or advice is being given as to whether any investment is suitable for a particular investor. Any views or opinions expressed above may not reflect those of Seeking Alpha as a whole. Seeking Alpha is not a licensed securities dealer, broker or US investment adviser or investment bank. Our analysts are third party authors that include both professional investors and individual investors who may not be licensed or certified by any institute or regulatory body.
