
Summary:
- BITF’s production decline is a fundamental problem, primarily caused by losing its share in the Bitcoin Network, despite small expansion efforts.
- Data shows that when BITF’s share in the network increased/declined in the current quarter, BITF’s production in the following quarter also increased/declined.
- When compared to other miners like RIOT and CLSK, BITF could lose even more network share over the coming quarters.
- The upcoming halving cycle could see aggressive consolidation of the mining sector while BITF seems to be on the losing side.
- Although BITF is not for us, our ideal entry price for BITF will be at least 20% below its $270mil adjusted NAV.
MediaProduction
Introduction
It is always nostalgic whenever we look at Bitfarms (NASDAQ:BITF). How times have changed, from being our number 1 pick to being relegated from our portfolio entirely. In one of our theses published in Oct 2022, we suggested that BITF was investable below the $137mil market cap. Just a month later in November, investors were presented with that exact entry opportunity that has asymmetric upside potential. Another 2 quarters later, our 200% return base-case target was realized even though Bitcoin has not recovered up to the price level expected.
Amidst this swing-up, there has been a big discovery that we felt that we had to re-evaluate our thesis. The primary observation that prompted this observation was BITF’s declining Bitcoin production. Hence, the objective of this article is to discuss how slow and steady will surely lose this Bitcoin mining race.
Slow And Steady Lose The Race
A Bitcoin mining company’s Bitcoin product is directly related to the mining capacity compared to every other miner’s. This combined total capacity of every Bitcoin mining company is known as the Bitcoin Network Hash Rate (network for short). Therefore, a Bitcoin miner’s profitability potential is the share it has in the network. More specifically, even if a Bitcoin mining company’s capacity increases but at a slower rate than the network, the Bitcoin production of that Bitcoin mining company will still decrease. This is exactly BITF’s case.
By referring to Table 1, we can observe a clear and persistent trend of declining production. BITF tried attributing the decline of Bitcoin production to other factors such as weather and (hosting/mining) uptimes (1, 2, 3), but there wasn’t sufficient evidence from cyclical patterns. These factors could’ve been responsible for some portion of the decline, but not to the extent of being the primary driver of persistent decline.
Table 1. BITF’s Declining Bitcoin Production
| Quarter (CY) | Bitcoins Mined | Bitcoins Mined QoQ Changes |
| 2023Q4 | 1,236 | 5% |
| 2023Q3 | 1,172 | -4% |
| 2023Q2 | 1,223 | -6% |
| 2023Q1 | 1,297 | -10% |
| 2022Q4 | 1,434 | -5% |
| 2022Q3 | 1,515 | 21% |
| 2022Q2 | 1,257 | 31% |
| 2022Q1 | 961 | -8% |
| 2021Q4 | 1,045 |
Source: Author
But when we observed BITF’s Bitcoin production together with BITF’s mining capacity and the Bitcoin network hash rate, the reason for BITF’s declining Bitcoin production became clear. The reason why BITF’s production declined on the back of increasing capacity is because its share in the network has declined. In simple words, BITF’s production decline is simply due to the decline in the network’s share.
By referring to Table 2, we can make the following observations:
- BITF’s mining capacity is indeed increasing over the quarters at about 10% (or 0.55 EH/s) QoQ in 2023
- Bitcoin network hash rate is also increasing over the quarters at about 12% QoQ in 2023
- However, the expansion rate (avg 10% QoQ) is less than Bitcoin’s network growth rate (avg 12% QoQ).
We can also make the following observations:
- If BITF’s share in the network declined in the current quarter, BITF’s production in the following quarter also declined.
- If BITF’s share in the network increased in the current quarter, BITF’s production in the following quarter also increased.
Therefore, we think that the actual reason for BITF’s decrease in Bitcoin production is the declining share in the network.
Table 2. Relationship Between Network Share and Bitcoin Production
| Quarter (CY) | Bitcoins Mined | Capacity (EH/s) | Bitcoin Network Hash Rate (EH/s) | BITF’s Share in Network |
| 2023Q4 | 1,236 | 6.5 | 430 | 1.51% |
| 2023Q3 | 1,172 | 6.1 | 400 | 1.53% |
| 2023Q2 | 1,223 | 5.3 | 398 | 1.33% |
| 2023Q1 | 1,297 | 4.8 | 347 | 1.38% |
| 2022Q4 | 1,434 | 4.5 | 272.5 | 1.65% |
| 2022Q3 | 1,515 | 4.2 | 232.17 | 1.81% |
| 2022Q2 | 1,257 | 3.6 | 217 | 1.66% |
| 2022Q1 | 9,61 | 2.7 | 197 | 1.37% |
| 2021Q4 | 1,045 | 2.7 | 190.65 | 1.42% |
| Quarter (CY) | Bitcoins Mined QoQ Changes | Capacity QoQ Growth Rate | Bitcoin Network Hash Rate QoQ Growth Rate | BITF Share in Network QoQ Changes |
| 2023Q4 | 5.46% | 6.56% | 7.50% | -0.88% |
| 2023Q3 | -4.17% | 15.09% | 0.50% | 14.52% |
| 2023Q2 | -5.71% | 10.42% | 14.70% | -3.73% |
| 2023Q1 | -9.55% | 6.67% | 27.34% | -16.23% |
| 2022Q4 | -5.35% | 7.14% | 17.37% | -8.71% |
| 2022Q3 | 20.53% | 16.67% | 6.99% | 9.04% |
| 2022Q2 | 30.80% | 33.33% | 10.15% | 21.04% |
| 2022Q1 | -8.04% | 0.00% | 3.33% | -3.22% |
Source: Author, all figures are captured on the end-of-quarter basis
We had observed this in one of our previous articles on BITF, just that it was premature to call it. With 2 extra quarters to validate, this observation has become even more credible and sets in motion a dangerous trend.
What we foresee for this coming cycle is the failure of many mining businesses unless Bitcoin significantly exceeds our $90,000 target. Financially stronger and sound mining businesses can afford more aggressive expansion while smaller and weaker ones will not be able to keep up with the network. Hence, it seems entirely possible for the Bitcoin mining sector to begin consolidating more aggressively after the upcoming halving cycle. At this point, BITF seems to be on the losing side.
For instance, both CleanSpark (CLSK) and Riot Platforms (RIOT) are expected to gain network share as their expected expansion rate exceeds both the network’s 12% QoQ growth rate and BITF’s 10% QoQ growth rate. CLSK has grown from 0.35 EH/s from Dec 2020 to 10 EH/s in Dec 2023, is fully funded for 16 EH/s, is expected to achieve 20 EH/s by the end of 2024, and has announced a clear path to 50 EH/s. RIOT’s near-term plan is to add 26 EH/s to its current 12.4 EH/s through 2025 and a long-term plan is to achieve 100 EH/s. Hence, BITF’s production is expected to decline further if not flat.
There are 2 scenarios where BITF can survive.
Firstly, BITF is trying to fight this decline with an expansion plan to 12 EH/s by 2024H1, or a 38.5% QoQ expansion rate. This should be sufficient to outpace the network’s 12% QoQ growth rate and increase its production. But we look at this tight schedule with skepticism. The guided 38.5% QoQ expansion is 3x the usual rate, which makes it unlikely. Furthermore, BITF has missed guidance before when being this ambitious (guided 8 EH/s by the end of 2022 in 2021Q3 with 2 EH/s; only achieved 4.5 EH/s). So only time can tell whether BITF can pull off this ambitious expansion plan.
Secondly, BITF can survive if the Bitcoin price can appreciate faster than the production decline. Unfortunately, the halving cycle is right around the corner which will further cut the already declining production by half. BITF 2023Q3 all-in business cost per BTC is $44,600 Post halving, this is equivalent to $89,200 per BTC. Given our expected new ATH for the coming cycle to be around $90,000 (or an average $66,000 price between April 2024 to April 2025), BITF’s declining production is a double blow to its survival chances.
Even if BITF managed to survive this, shareholders still have to deal with an average an 6.5% dilution every quarter (Table 3).
Table 3. BITF’s Shareholder Dilution Over Time
| Quarter (CY) | Shares Outstanding | Shares Outstanding |
| 2023Q3 | 277,684,000 | 7.52% |
| 2023Q2 | 258,259,000 | 7.49% |
| 2023Q1 | 240,262,000 | 7.16% |
| 2022Q4 | 224,200,000 | 3.94% |
| 2022Q3 | 215,711,000 | 4.54% |
| 2022Q2 | 206,339,320 | 2.34% |
| 2022Q1 | 201,626,602 | 3.50% |
| 2021Q4 | 194,805,893 | 11.67% |
| 2021Q3 | 174,445,684 | 7.63% |
| 2021Q2 | 162,083,352 | 11.77% |
| 2021Q1 | 145,016,864 |
Source: Author
Verdict
We hope that this article can make the case why slow and steady will lose the Bitcoin mining race. Using BITF as the case study, we will now also be wary of mining companies with slower-than-network capacity growth. So far only BITF has shown this tendency (Table 4), in contrast, CLSK production continues to grow strongly and steadily QoQ. More data is required to confirm Iris Energy (IREN) and RIOT.
Table 4. Bitcoin Production Comps
| Quarter (CY) | IREN | BITF | CLSK | RIOT |
| 2023Q4 | 1,164 | 1236 | 2019 | 1629 |
| 2023Q3 | 1,223 | 1,172 | 1877 | 1,106 |
| 2023Q1 | 501 | 1,297 | 1871 | 2110 |
| 2023Q2 | 1,255 | 1,223 | 1624 | 1,775 |
| 2022Q4 | 722 | 1,434 | 1,531 | 1712 |
| 2022Q3 | 780 | 1,515 | 1,228 | 1042 |
| 2022Q2 | 436 | 1,257 | 964 | 1,395 |
| 2022Q1 | 357 | 961 | 899 | 1405 |
| 2021Q4 | 364 | 1,045 | 660 | 1355 |
Source: Author
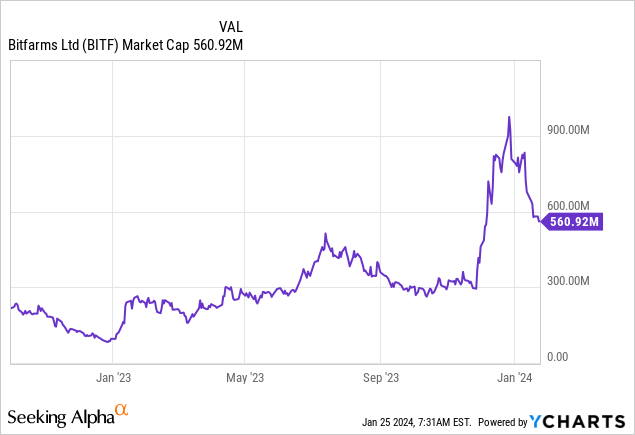
If you’re still fond of BITF, our acceptable entry price (market cap) for BITF would be $270mil market cap (= adjusted net asset value = $46.8mil cash + 203.3mil PP&E + $30.9mil Deposit + 703 BTC x $40k – $45.5 Total Liability). Our ideal entry price would be at least 20% below the adjusted NAV (around $220mil market cap).
But we think that there are other miners with better risk-reward profiles to choose from, like CLSK. For us, we would stay away from BITF altogether because this problem could be a fundamental one while problems like CLSK’s are simply a valuation problem.
Analyst’s Disclosure: I/we have a beneficial long position in the shares of BTC-USD either through stock ownership, options, or other derivatives. I wrote this article myself, and it expresses my own opinions. I am not receiving compensation for it (other than from Seeking Alpha). I have no business relationship with any company whose stock is mentioned in this article.
Seeking Alpha’s Disclosure: Past performance is no guarantee of future results. No recommendation or advice is being given as to whether any investment is suitable for a particular investor. Any views or opinions expressed above may not reflect those of Seeking Alpha as a whole. Seeking Alpha is not a licensed securities dealer, broker or US investment adviser or investment bank. Our analysts are third party authors that include both professional investors and individual investors who may not be licensed or certified by any institute or regulatory body.