
Summary:
- All the graphs are broken out in this analysis. The conclusion: caution is warranted.
- Inflation-adjusted prices point to a peak in the cycle. We’ll take a look at the history of oil booms and busts.
- Chevron and Exxon’s valuations are officially stretched trading at cyclically adjusted PEs of 23x and 30x.
- In the decade ahead, we project modest returns of 5% per annum for Chevron and 7% per annum for Exxon.
ineskoleva/iStock via Getty Images
The Thesis
As oil prices remain elevated, everyone in the oil sector’s wondering, “how long can this last?” While no one knows how long it will last, we can pretty reliably say we’re at a peak in the cycle. Inflation adjusted oil prices are elevated and so are profit margins. We’ll take a deep dive and shed some light on what to expect from here for Chevron (NYSE:CVX) and Exxon Mobil (NYSE:XOM).
Reasons To Be Bearish
While the price of oil seemed low from 2015-2019, it really wasn’t in the context of history. Established in the 1960’s, the OPEC cartel has done a lot for the commodity over the years. OPEC is a collusion effort that seeks to manipulate the price of oil. The chart below adjusts for inflation to give you an idea of how expensive oil is today, in the context of history. You can see that in the 1940’s, 50’s, and 60’s, the inflation adjusted price of WTI was much, much lower than in recent history. OPEC really got going in the 1970’s, and the commodity spiked in an enormous way. But, again, in the 80’s and 90’s, the price was much lower than it’s been in recent history.
Inflation adjusted price of oil:
Inflation Adjusted WTI Price History (Macrotrends)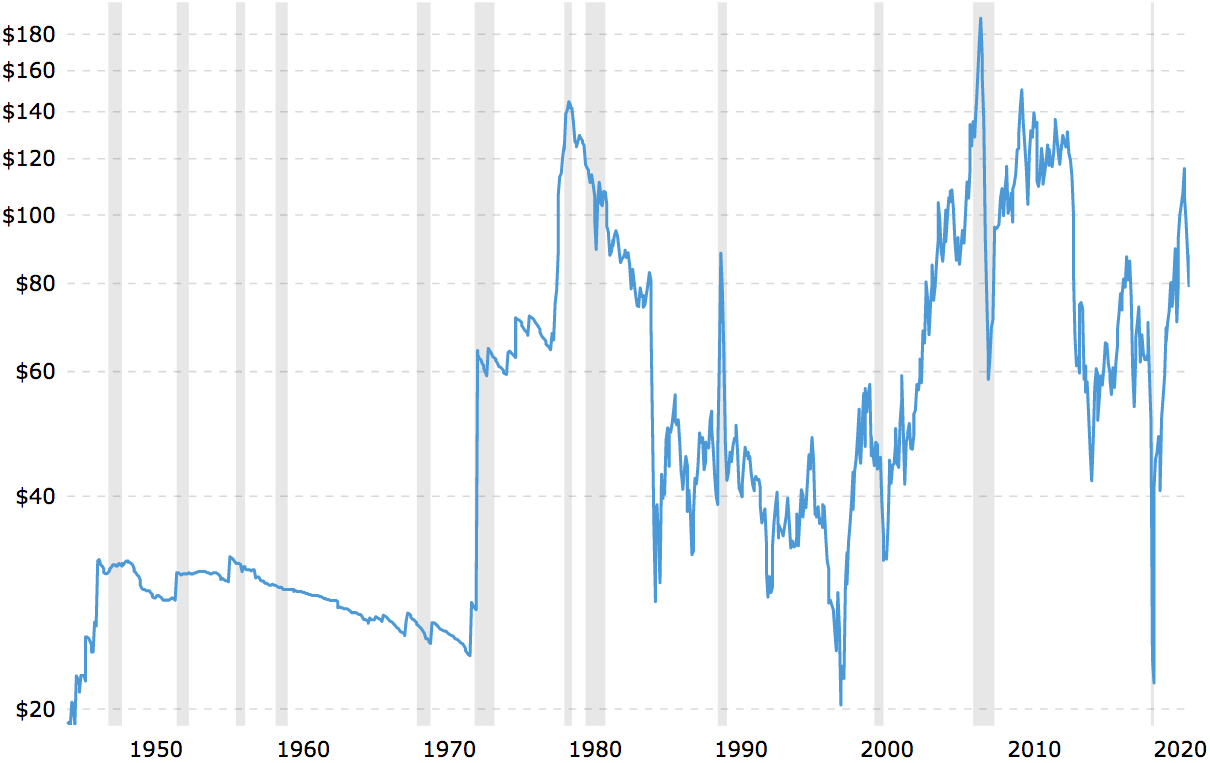
If it were not for OPEC, oil prices would be much lower, and upstream oil businesses would make very little profit over the long-term. You see, in a competitive market, commodity prices tend to drift toward the break-even point.
Here’s another look at the history of oil prices:
History Of Oil Prices (Jenna Ross – Visual Capitalist)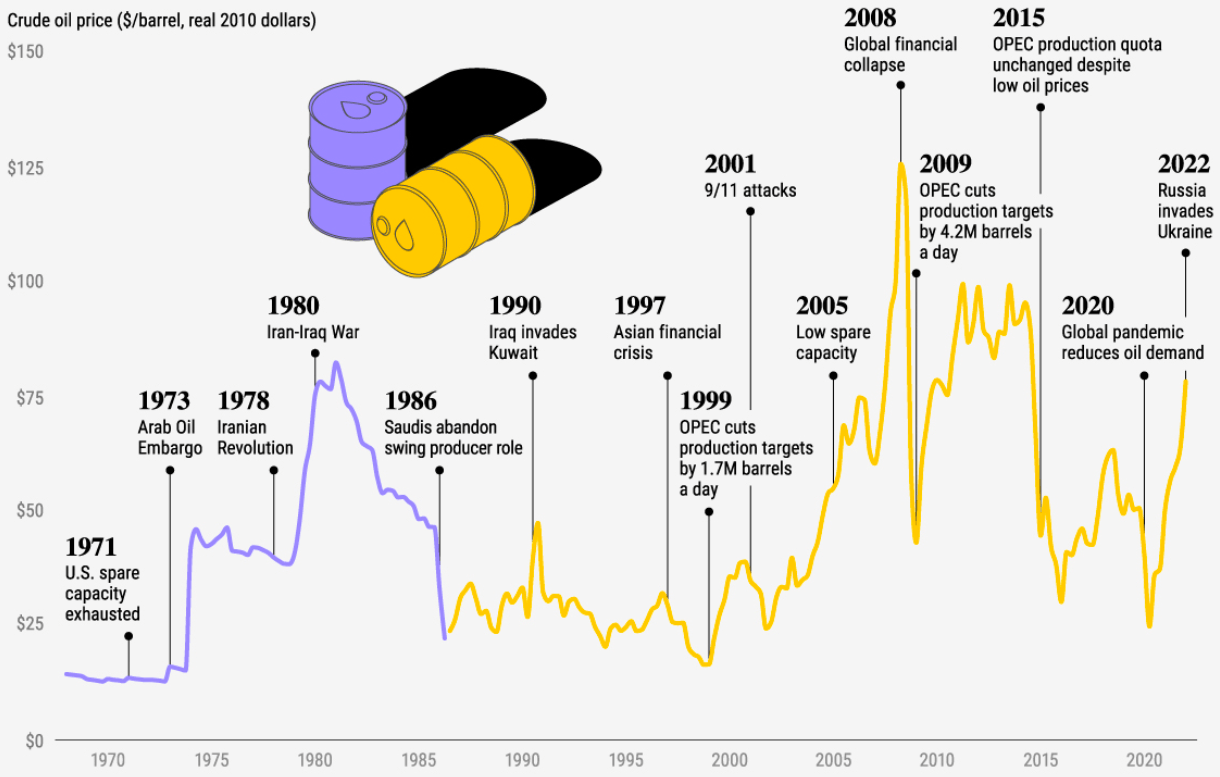
The takeaway here is that oil prices are elevated relative to history. Oil prices tend to drop off in times of recession. Exxon and Chevron’s stocks are living dangerously high after a parabolic rise, which sets them up nicely for a sharp drop if oil prices reverse.
More Expensive Than You Think
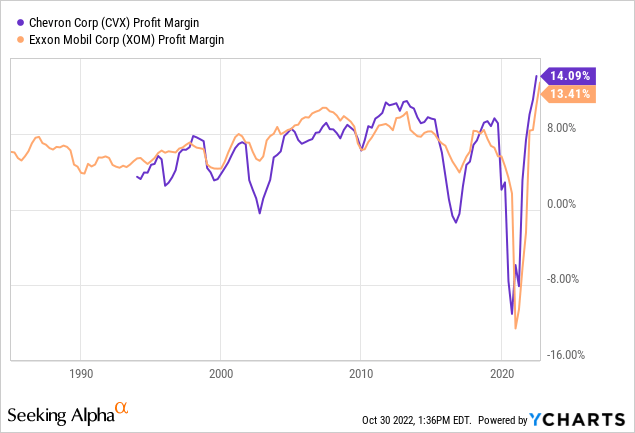
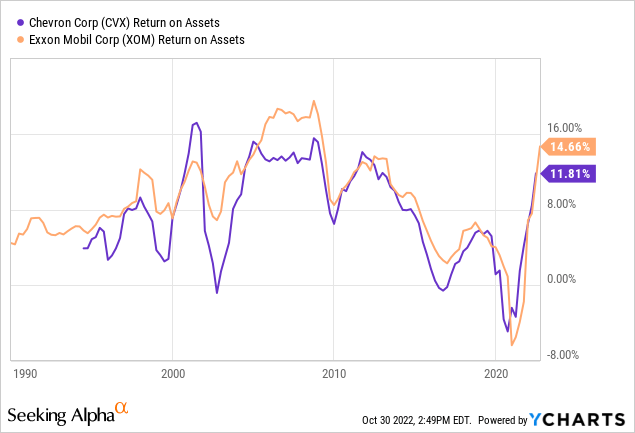
Exxon and Chevron look cheap based on a forward PE, but the forward PE assumes analysts know what oil prices will do over the next year. In the short-term, the price of oil is remarkably unpredictable. What we do know is that these companies are currently over-earning with higher profit margins than ever before:
They’ve also seen their price to sales and price to book ratios expand of late, but to give readers some context, they were even more expensive on a price to book ratio through much of the 2000’s, a period marked by war in the middle east:

If we look at their earnings over the past 10 years, Chevron and Exxon trade at CAPE ratios of 30 and 23:
CAPE Ratio (Image Created By Author With Data From Seeking Alpha)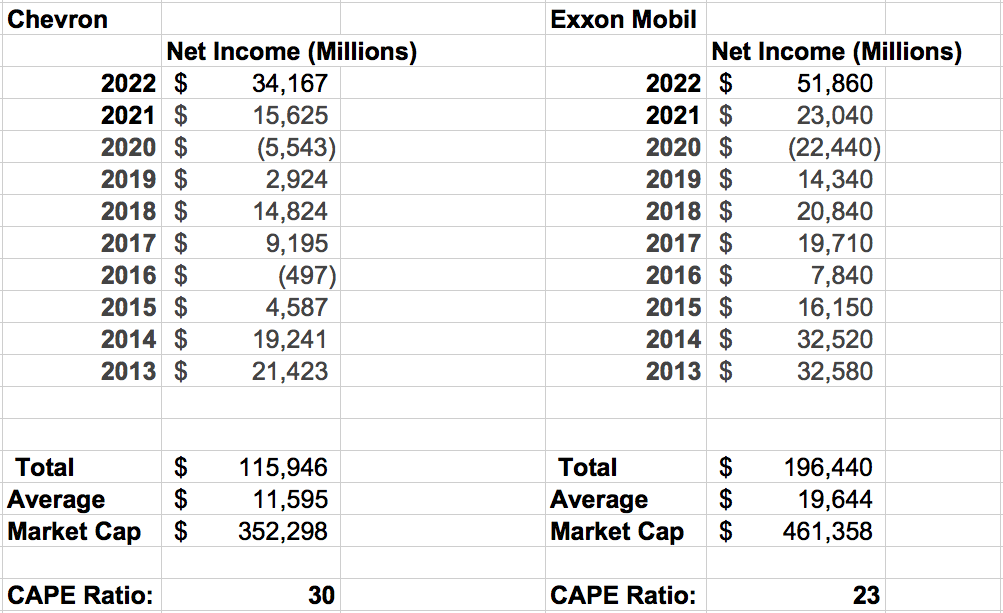
Both Exxon and Chevron have averaged around an 8% return on assets and 6% profit margin over time. If we combine these numbers, we get normalized earnings of $17.1 billion for Chevron and $26.4 billion for Exxon. Based on the market caps above, that means Chevron’s normalized PE is now 20.6x and Exxon’s 17.5x, more expensive than you think. And, this is on fairly robust assets and revenues.
Prospective Returns
Our 2032 price targets for Chevron and Exxon are $195 and $155 respectively, implying returns of 5% and 7% per annum with dividends reinvested. Keep in mind, this is just our base-case scenario.
We believe both Exxon and Chevron can grow their normalized earnings per share at 6% per annum as a result of modest buybacks, expense reductions, acquisitions, and organic growth. This gives you $11.50 per share for Exxon and $15.60 per share for Chevron by 2032. We’ve applied a terminal multiple of 12.5x for Chevron and 13.5x for Exxon. We expect normalized multiples to decline for these businesses as oil reserves decline. The world has found a viable alternative in electric vehicles. These oil majors will eventually be forced to reinvent themselves. Exxon Mobil can delay this process with its exceptional downstream business and vast oil reserves:
Proven Oil Reserves (Statista)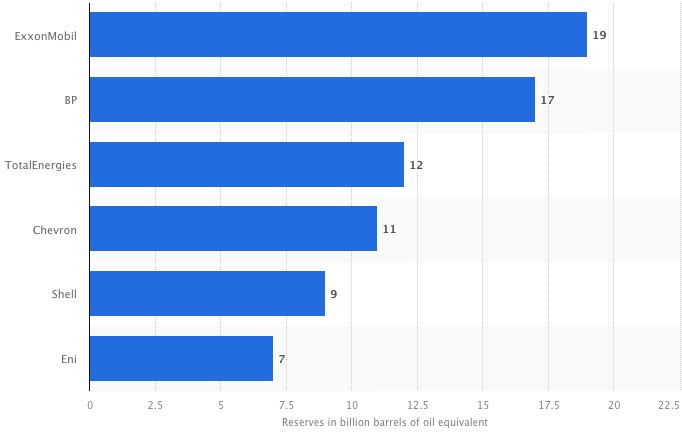
Conclusion
It’s not crazy to expect low forward returns following the parabolic rise of Chevron and Exxon. A deep dive into their CAPE ratios and normalized earnings, as well as the history of oil prices signals it’s time for caution. A winding down of the war in Ukraine, a recession, or both could cause oil prices to drop. We’re currently nearing a peak in the cycle. While we have a “sell” rating on Chevron and a “hold” rating on Exxon, we believe there are still great buys in this sector globally. For more on this, check out my articles:
- TotalEnergies: Enormous Total Returns
- Petrobras: Buy This ‘Value Trap’
- Shell: The Hyper-Growth Green Energy Empire
- BP: Buy The Dip Like Buffett
Disclosure: I/we have a beneficial long position in the shares of TTE, SHEL either through stock ownership, options, or other derivatives. I wrote this article myself, and it expresses my own opinions. I am not receiving compensation for it (other than from Seeking Alpha). I have no business relationship with any company whose stock is mentioned in this article.
Additional disclosure: This article includes base-case scenario estimates, using known facts and economic projections. The future is uncertain, and investors must draw their own conclusions.