
Summary:
- Cisco beat EPS and revenue estimates, raising its 2024 revenue outlook to $53.6-$53.8 billion. The stock price remained flat, decreasing by only 0.13%.
- The fair stock price estimate is $63.63, with a future target of $92.46 by 2029, supporting a “strong-buy” rating and implying a 28.1% upside and 14.4% annual return.
- Cisco’s valuation is boosted by Splunk, which added around $4.21 billion in new revenue, potentially increasing to $5.62 billion for FY2025 as Cisco integrates Splunk with its customer base.
- Cisco leads with a 15.32% market share, ahead of competitors like Juniper and Arista. Cisco’s total addressable market is expected to grow at a 13.14% annual rate through 2028/2029.
- Cisco aims to enhance networking for AI and IoT, but faces risks from slow historical growth.
HJBC/iStock Editorial via Getty Images
Thesis
In my previous article on Cisco Systems, Inc. (NASDAQ:CSCO), I reiterated my “strong-buy” rating on Cisco citing that according to my estimates, Cisco could miss estimates for 2024, 2025, and 2026 and it would still be undervalued if it beat on estimates for 2027-2029. Therefore, there was room for opportunities which was time in favor of Cisco. The concluding estimated fair price in that article was $67.87 and the future price for 2029 was $104.25.
Cisco released Q3 2024 earnings on May 15, beating EPS estimates by 7.3% and revenue by 5.50%. Additionally, Cisco also increased its outlook for 2024 to a range of $53.6-53.8B which is higher than the $53.4B estimate. Since my previous article, the stock has decreased by 0.13%, which in other words means that the stock price remained flat.
After re-evaluating Cisco, I arrived at presenting a fair stock price estimate of $63.63 and a future stock price of $92.46, targets that still support my “strong-buy” rating, therefore I reiterate it.
Overview
Growth Plan
As you may know (and as you will see again in the valuation section) Cisco is heavily dependent on networking equipment. What is networking? It’s the equipment used to build networks of servers and devices. This equipment includes switches, cables, routers, and firewalls. Cisco offers all of that.
At first sight, it may look like a legacy sector that is not going to benefit from the recent AI boom, but it’s all the opposite. Networking is poised to also benefit because companies will need better routers, and ethernet cables that can handle the increased bandwidth requirement of AI data centers.
This is the reason why Cisco’s strategy is to continue improving its networking improvement to address more AI expansion as well as securing partnerships with important clients.
How does Cisco Compare Against Peers?
Cisco is the leading networking company for data centers, however, it does not hold the majority market share, since it only controls around 15.32% of the market. However. Other competitors include Juniper Networks, Inc. (JNPR), Arista Networks, Inc. (ANET), and Broadcom, Inc. (AVGO), through its branch VMWare. These companies control 2.80%, 3.19%, and 4.70% of the market respectively.
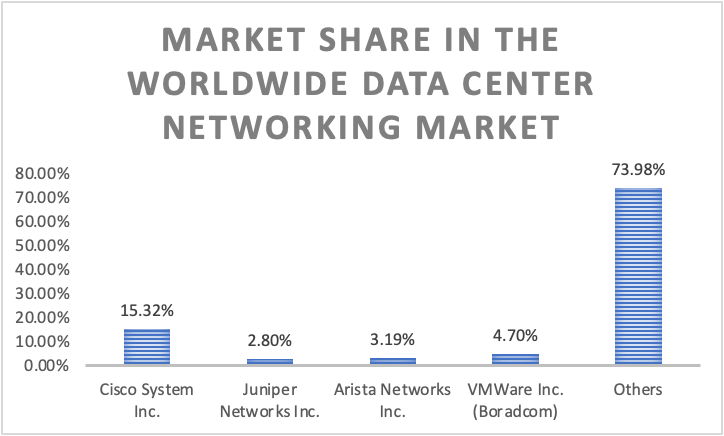
Author’s Calculations
Industry Outlook & Addressable Market
The worldwide networking segment of the data center market is expected to grow at a CAGR of 6.88% throughout 2028. By that year, the total market volume should reach $256.10B from 2023’s $190.50B.
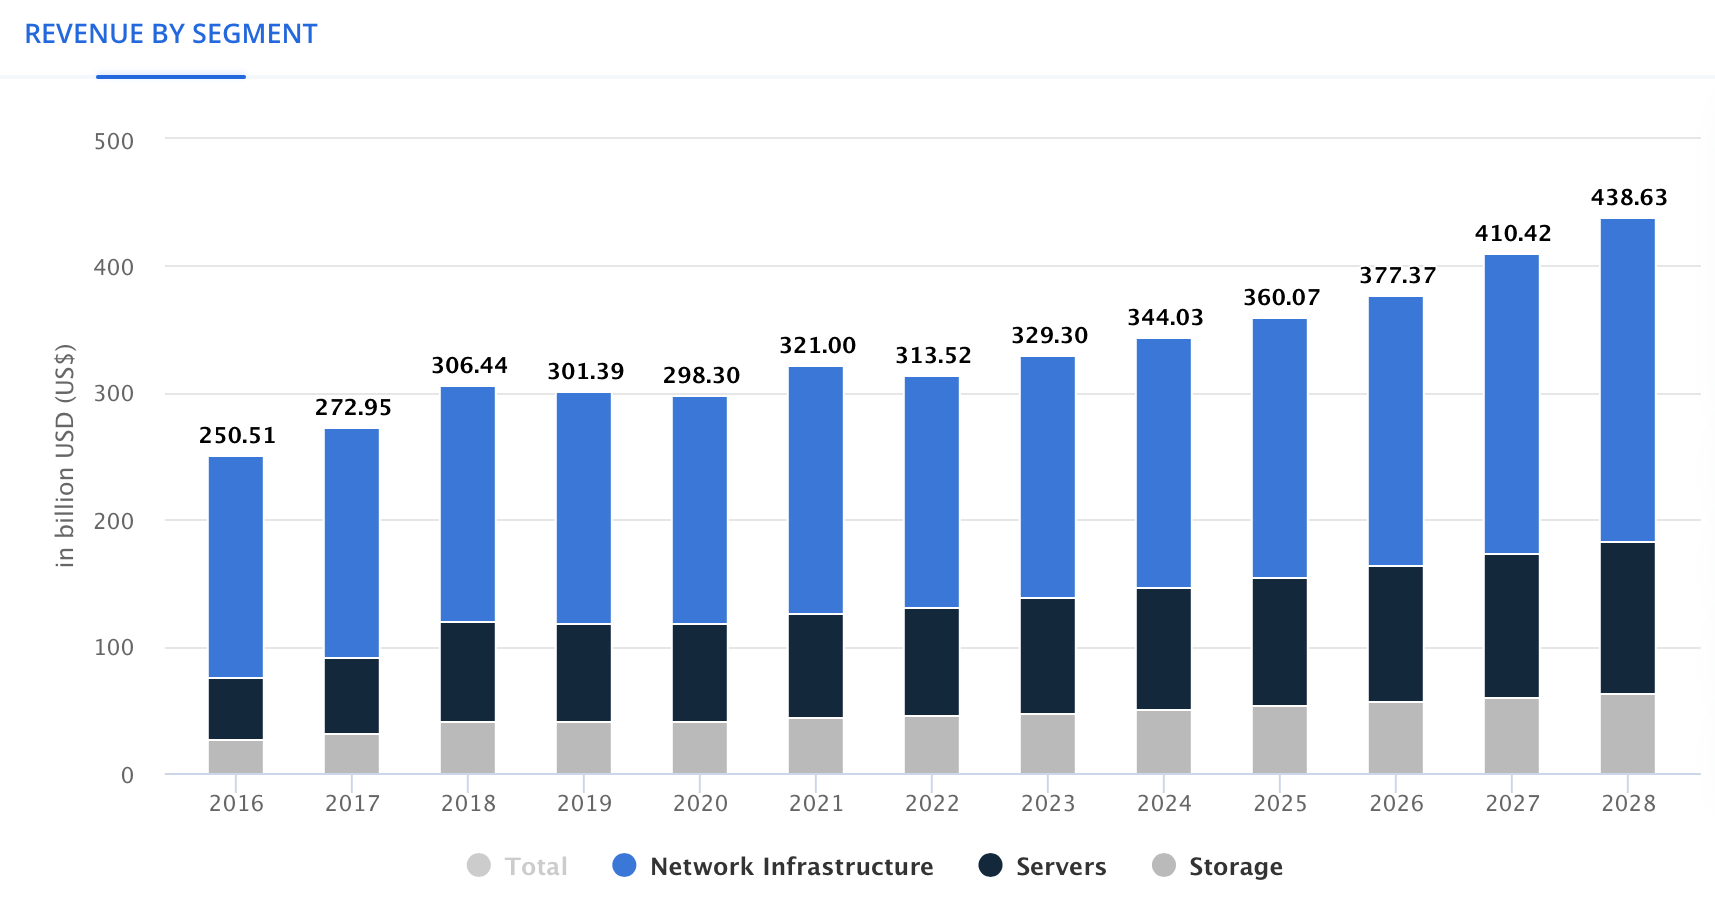
Statista
Then it’s the “internet of the future” which is no longer displayed on Cisco’s financial reports. IoT aims to facilitate the connection between the cloud and interconnected devices. Cisco offers optic connectivity and the Silicon One (which is a chip used for delivering the “highest bandwidth routing possible“). Since this is necessary for all the sectors aiming to implement this technology, Cisco can serve all the segments of the IoT market.
The IoT market is expected to reach a $1.38B revenue by 2024 and thereafter grow to $2.22B by 2028. Implying a 12.57% CAGR throughout the period.
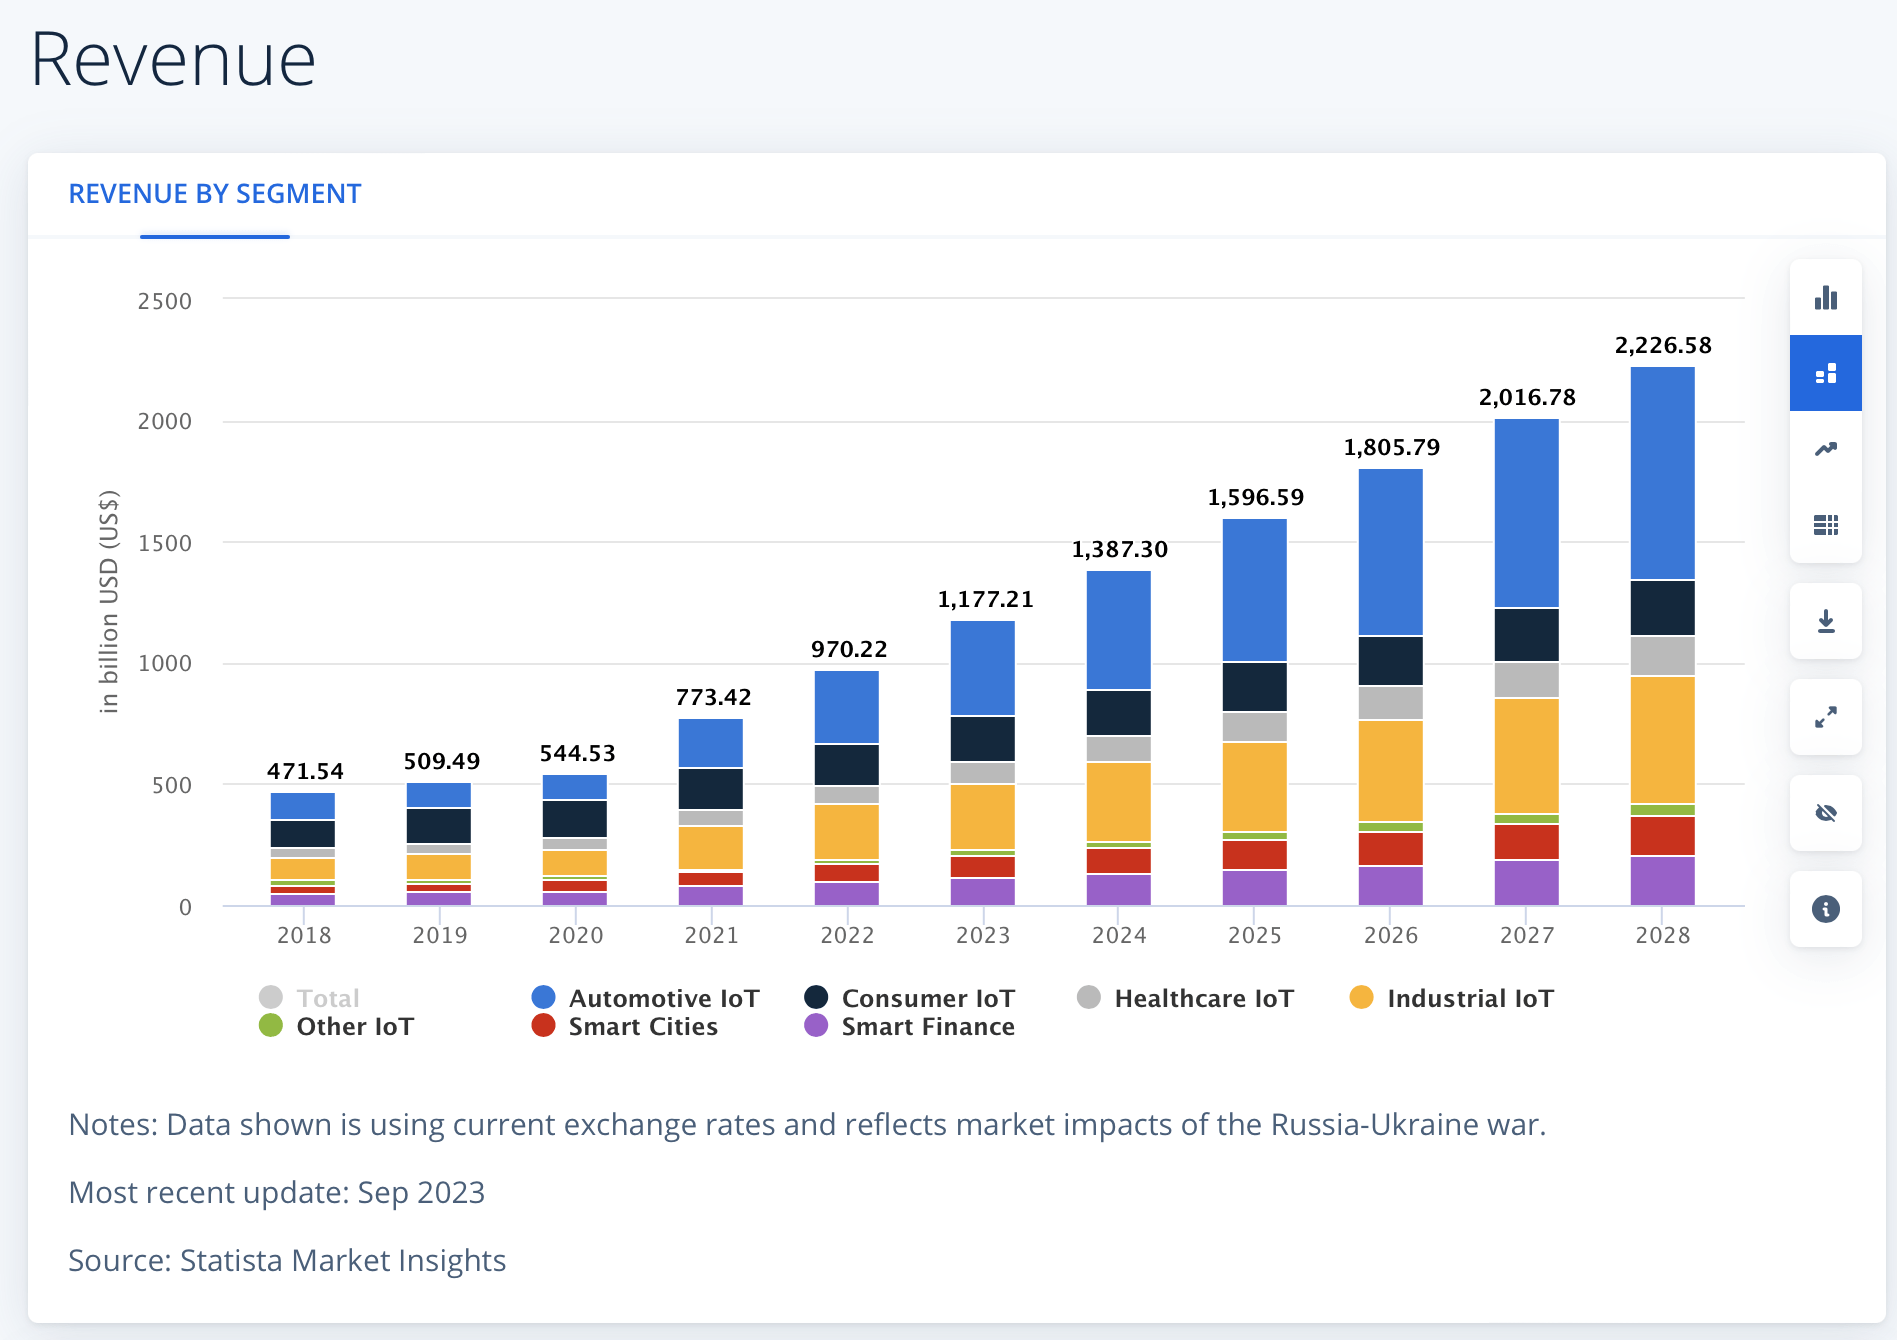
Statista
Then it’s Cisco’s cybersecurity operations which is offered to networking clients. Cisco’s offerings include Hypershield, which delivers the necessary architecture for hyperscaler (which means an agile method of data processing) technology, as well as Cisco XDR, which is a suite for threat detection, and SSE which unifies several functions for cloud cyber-protection, among others.
The revenue of the worldwide cybersecurity market is expected to grow at a rate of 10.48% throughout 2028, from 2023’s 165.20B to $273.50B in 2028.
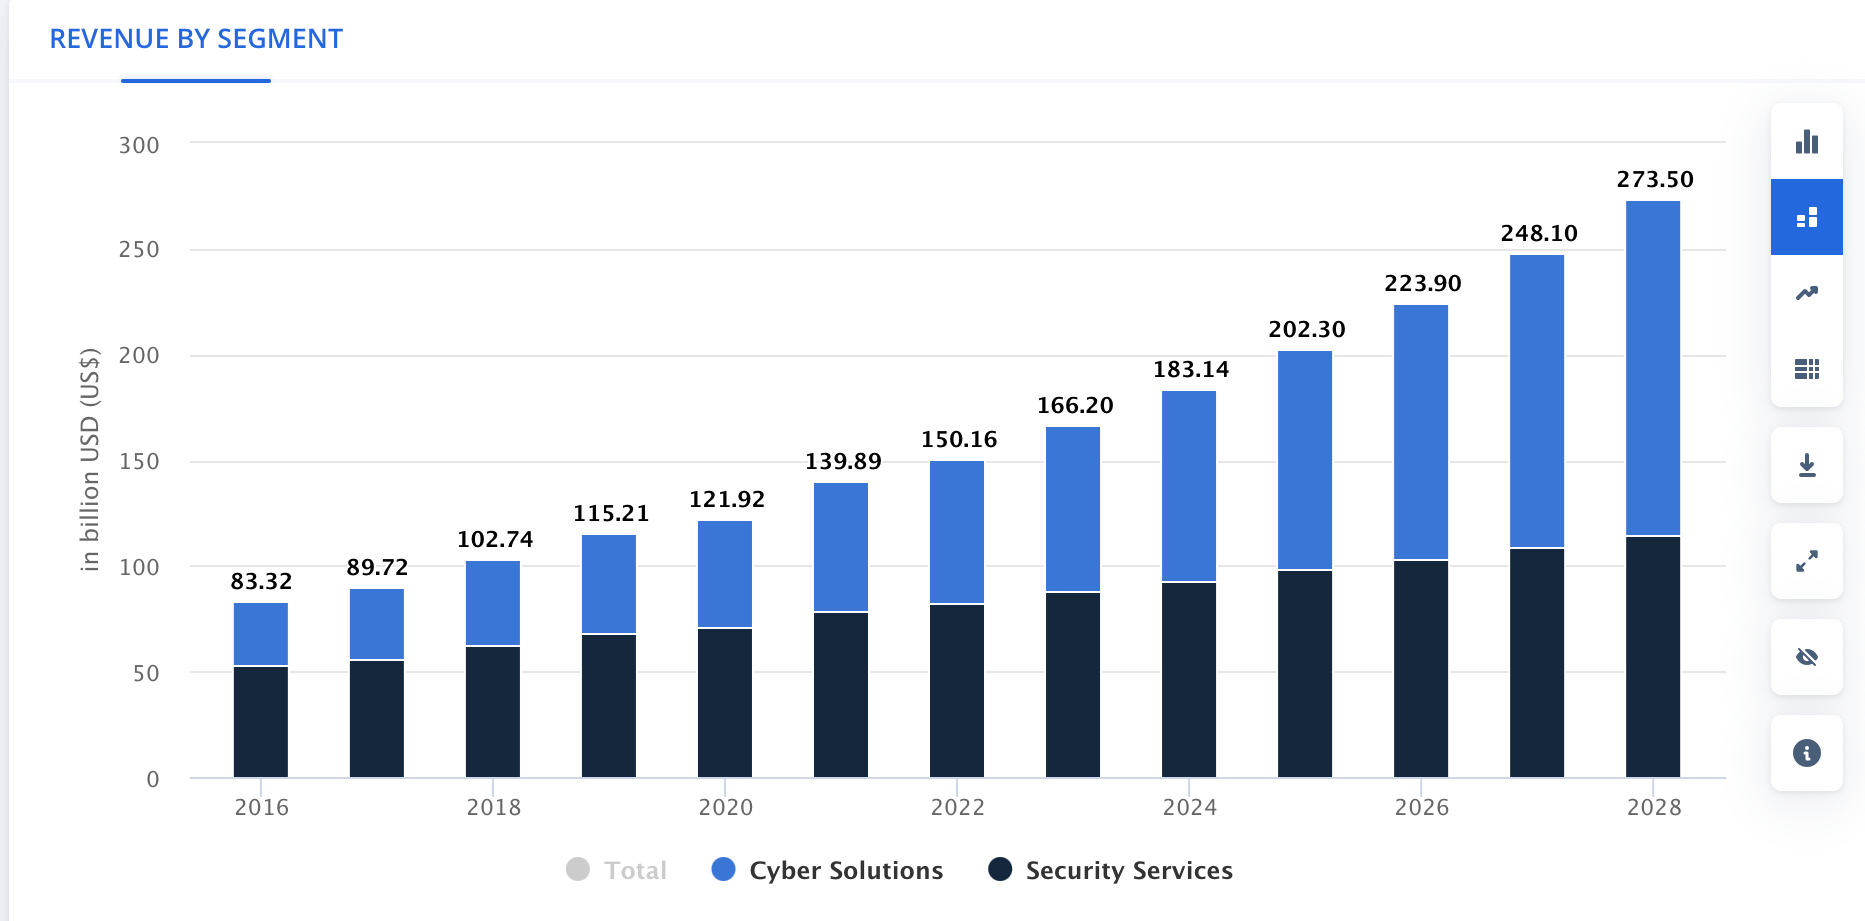
Statista
Then it’s the collaboration software segment whose main objective is to speed up workflows. Cisco’s collaboration software permits video calls, call centers, and communication platforms as a service (CPaaS). The business productivity software market is expected to grow at a 13.5% CAGR throughout 2031, a year in which the market is expected to be valued at $150.59B from 2023’s 54.68B.
These figures bring Cisco’s current addressable market at around $411.76B and for 2028/2029 that number is expected to climb to $682.41B, which is a 13.14% annual growth for Cisco’s total addressable market.
Can Cisco Achieve these Growth Rates?
In its FY 2023 10-K, we can observe that the networking segment grew by 14.09% annually, meanwhile, internet for the Future grew by 8.8%, end-to-end security by 7.57%, and optimized application experiences by 12%. The only segment that had negative growth was collaboration with -7.44%.
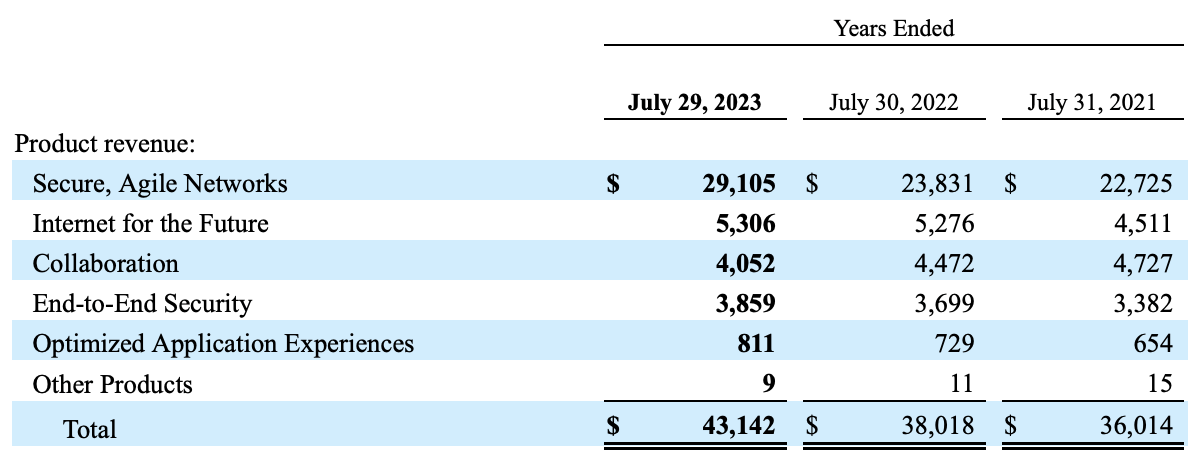
Cisco FY 2023 10-K
As you can see, networking revenue growth was significantly higher than the 6.88% expected for the worldwide networking infrastructure market, and since Cisco’s revenue depends 56% on networking, outperformance in this segment can compensate for the slight underperformance in other segments.
Valuation
I will value Cisco through a DCF model. In the table below you can find all the financial information that will be used. The WACC was calculated with the already-known formula. The result was 8.87%, which with the estimated FCF growth rate of 19.62% (19.62%/(19.62%-8.87%)), results in a perpetuity growth rate of 1.82%. Lastly, D&A will be calculated with a margin tied to revenue, which came out at 1.41%.
| TABLE OF ASSUMPTIONS | |
| (Current data) | |
| Assumptions Part 1 | |
| Equity Market Price | 198,210.00 |
| Debt Value | 31,993.00 |
| Cost of Debt | 2.18% |
| Tax Rate | 30.09% |
| 10y Treasury | 4.342% |
| Beta | 0.91 |
| Market Return | 10.50% |
| Cost of Equity | 9.95% |
| Assumptions Part 2 | |
| CapEx | 663.00 |
| Capex Margin | 1.20% |
| Net Income | 12,116.00 |
| Interest | 699.00 |
| Tax | 2,193.00 |
| D&A | 778.00 |
| Ebitda | 15,786.00 |
| D&A Margin | 1.41% |
| Revenue | 55,364.0 |
| R&D Expense Margin | 21.67% |
The first step is to calculate revenues, and for this, I will start with Splunk. Its current TTM revenue stands at $4.21B, which divided by the 15K customers it has, brings us to a revenue per customer of 300K.
Cisco in its FQ3 2024 earnings release said that they identified 5K existing Cisco customers that could also become Splunk customers. So, since I think that in 3 months they won’t be able to add those 5K new customers, I will add them all for FY2025. Thereafter this subsidiary will grow at 10.48% of the global cybersecurity market.
For the rest of the segments, I will assume a 6.88% growth rate for networking, services, and optimal application experience. Meanwhile, I will assume 13.6% for Internet of the Future, 10.48% for the $3.85B in cybersecurity revenue that existed previous to the Splunk acquisition, and 13% for collaboration. All of them are in line with their respective market.
Lastly, the company said they were expecting an FY2024 revenue of $53.6-$53.8B, which means that I need to cut around $7.59B from my estimates. I will do this by taking out $3.79B in revenues from Secure Agile Networks and Services.
| Secure, Agile Networks | Services | Internet for the Future | End-to-End Security | Collaboration | OptimizedApplication Experience | |
| FY 2023 | 29,105.0 | 13,735.9 | 5,306.0 | 3,859.0 | 4,052.0 | 811.0 |
| FY 2024 | 27,310.4 | 10,883.9 | 6,027.6 | 8,478.4 | 4,133.0 | 866.8 |
| FY 2025 | 29,189.4 | 11,632.7 | 6,847.4 | 10,772.0 | 4,215.7 | 926.4 |
| FY 2026 | 31,197.6 | 12,433.1 | 7,778.6 | 11,900.9 | 4,300.0 | 990.2 |
| FY 2027 | 33,344.0 | 13,288.5 | 8,836.5 | 13,148.1 | 4,386.0 | 1,058.3 |
| FY 2028 | 35,638.1 | 14,202.7 | 10,038.3 | 14,526.0 | 4,473.7 | 1,131.1 |
| FY 2029 | 38,090.0 | 15,179.9 | 11,403.5 | 16,048.3 | 4,563.2 | 1,208.9 |
| Growth Rate % | 6.88% | 6.88% | 13.60% | 10.48% | 2.00% | 6.88%c |
Now it’s time to predict net income. The first thing is the cost of revenues, for which I will maintain the current gross margin of 64.20% (this is to make my model more conservative since I already know the result).
Then for general & administrative expenses I divided the FY2024 TTM figure of $12.33B which divided by the amount of full-time employees of 87.6K, gives a total expense per employee of $150K per year. Then I will assume that Cisco will continue to add 2.7K employees annually, mirroring the behaviors displayed in 2021-2024TTM.
Regarding R&D expenses, I will use the current expense ratio of 21.67% of gross income.
Then for total debt, I will maintain the growth displayed in 2018-2024TTM of 4.1% annually, and for marketable securities, the annual 9.9% decrease displayed in that same period.
Now it’s time to calculate interest expense and interest income. For interest expense, I found that during 2023 (a period of high interest rates) Cisco paid a 2.18% interest towards that debt, however in 2019 (a period with low interest rates) Cisco paid 3.75%. This, in my opinion, reflects an improvement in CIsco’s creditworthiness. For this reason, I will instead use the average of 2.92% throughout the net income projection. Then for interest income, I found that in 2023 Cisco generated 14.27% from its short-term investment and 5.22% in 2019. So, what I will do is that for 2024 and 2027, interest rates will be high and thus I will use the 14.27% figure, and for 2025,2026,2028, and 2029, I will use the low-interest rate number of 5.22%. You can see the explanation for this in my article about Bank of America Corporation (BAC) in the valuation section.
Then, currency exchange gains and losses will be the average registered during the 2018-2024 TTM of -$66.7M.
Lastly, the income tax expense will be calculated with an effective tax rate of 15.33%.
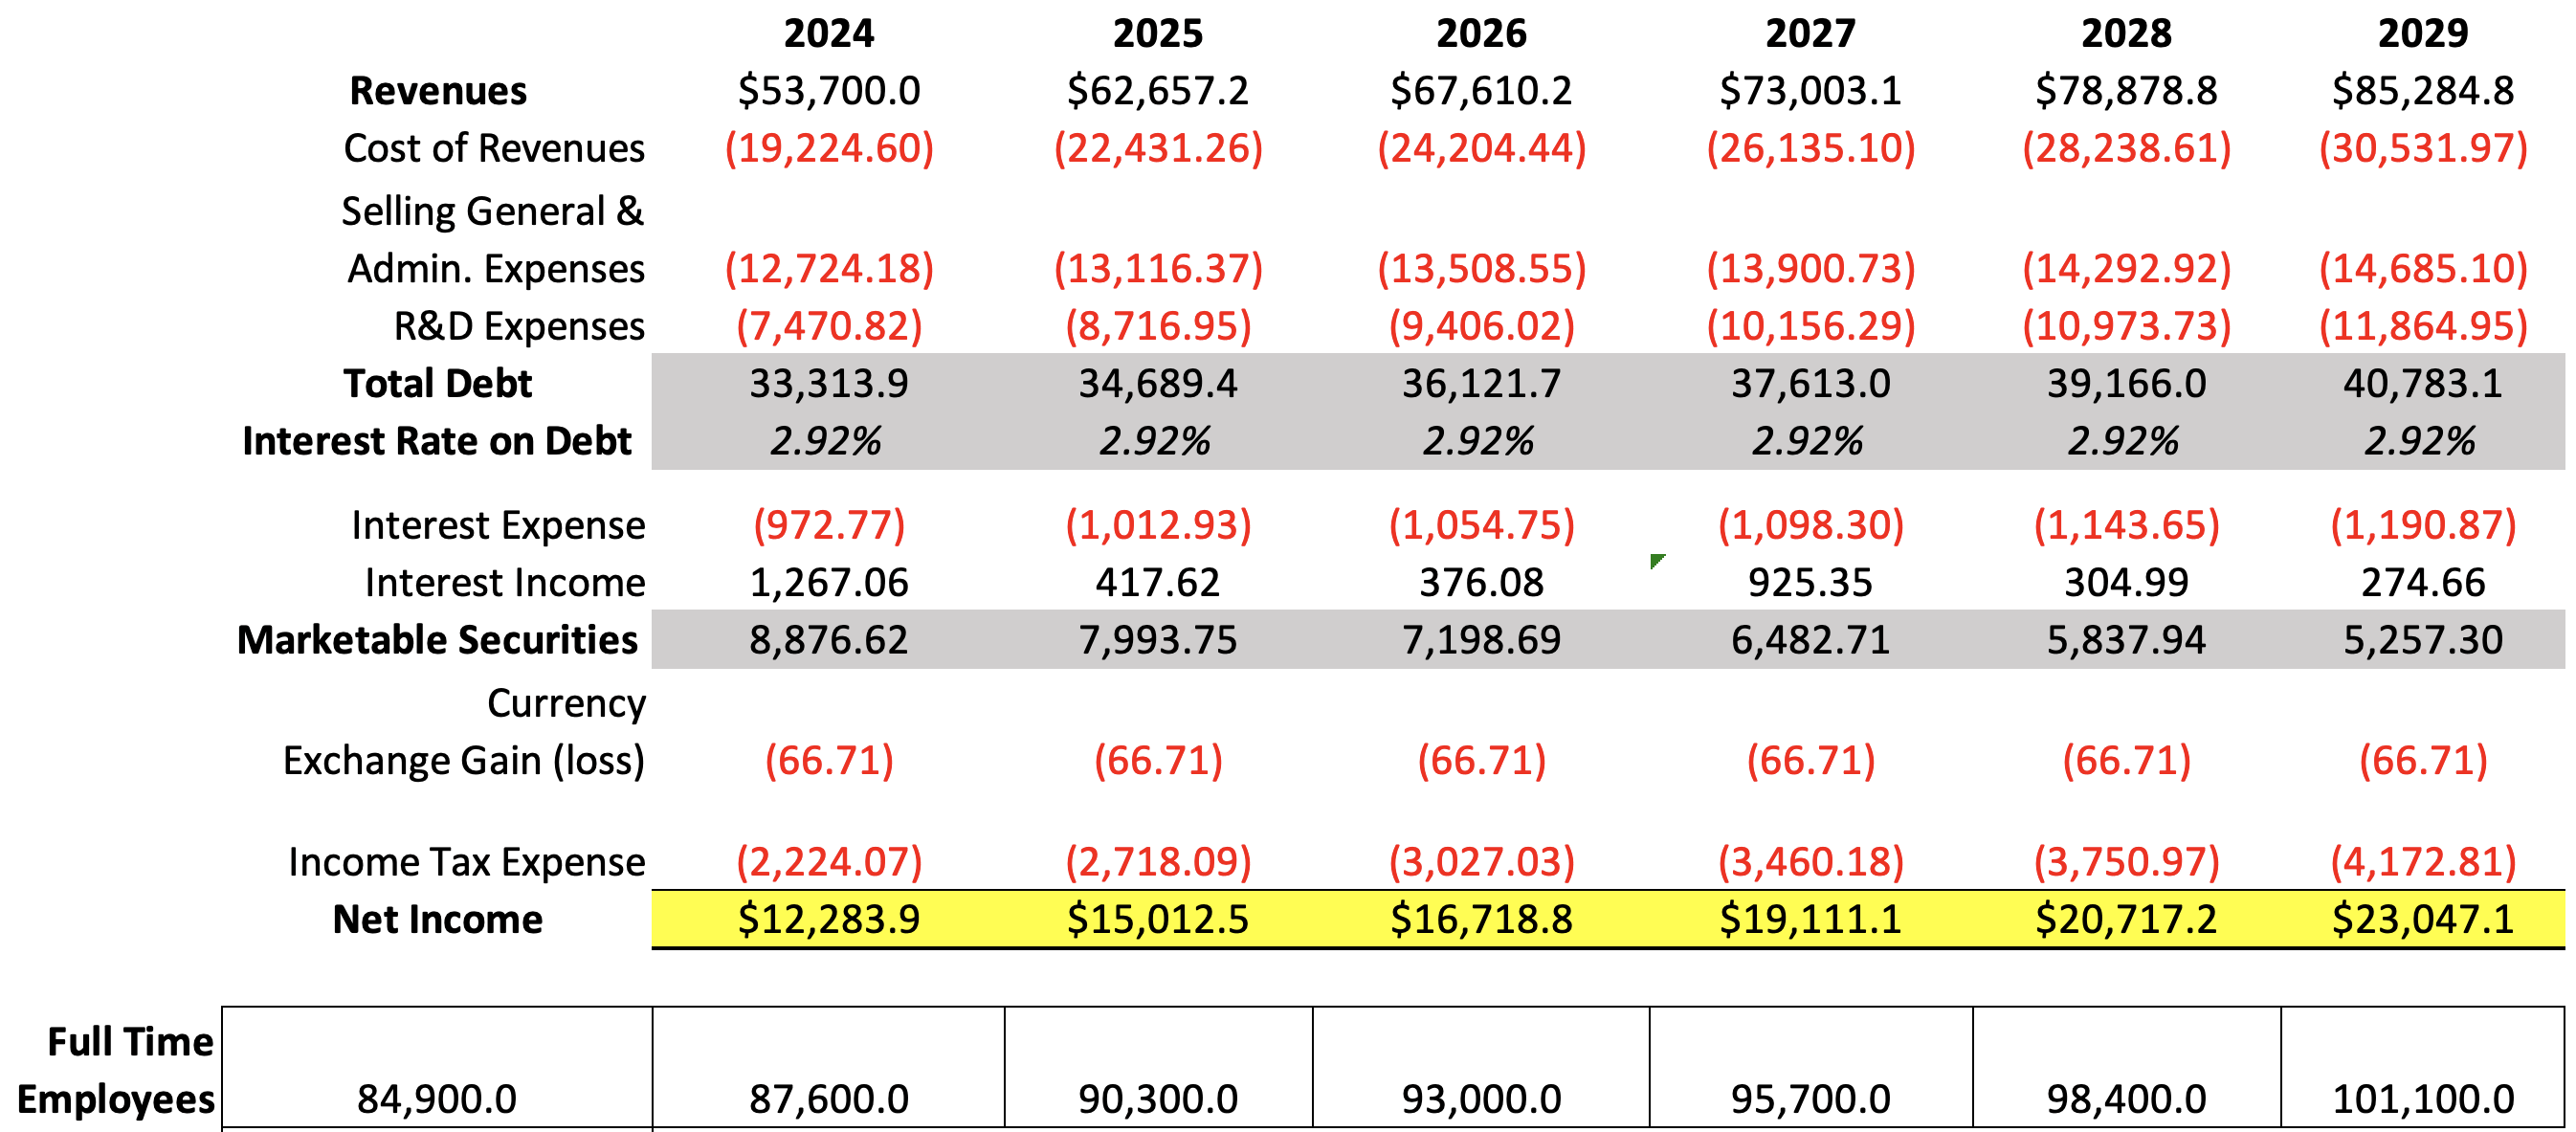
Author’s Calculations
The final results indicate that Cisco to attain my valuation needs to grow its revenue by 9.77%. However, the reason why it’s so high is because of the addition of Splunk’s revenue, which if not included, would push this figure down to 7.23%.
| Revenue | Net Income | Plus Taxes | Plus D&A | Plus Interest | |
| 2024 | $53,700.0 | $12,283.91 | $14,507.98 | $15,262.60 | 16,235.36 |
| 2025 | $62,657.2 | $15,012.46 | $17,730.56 | $18,485.17 | 19,498.10 |
| 2026 | $67,610.2 | $16,718.75 | $19,745.78 | $20,695.87 | 21,750.62 |
| 2027 | $73,003.1 | $19,111.11 | $22,571.29 | $23,597.16 | 24,695.46 |
| 2028 | $78,878.8 | $20,717.20 | $24,468.17 | $25,576.61 | 26,720.26 |
| 2029 | $85,284.8 | $23,047.09 | $27,219.90 | $28,418.36 | 29,609.23 |
| ^Final EBITA^ |
To calculate the future stock price for 2029, I will use the undiscounted cash flows that are highlighted in green in the DCF model, as well as predict which could be the future value of each of the elements that conform to equity.
To do this last thing I will take as a base the behavior of these variables during 2018-2024TTM. This means that short-term debt will increase by 21.1% annually, meanwhile, long-term debt will remain almost flat by decreasing at a 0.2% annual pace, and current assets by 6.9% annually. Marketable securities were already calculated during the net income projection phase.
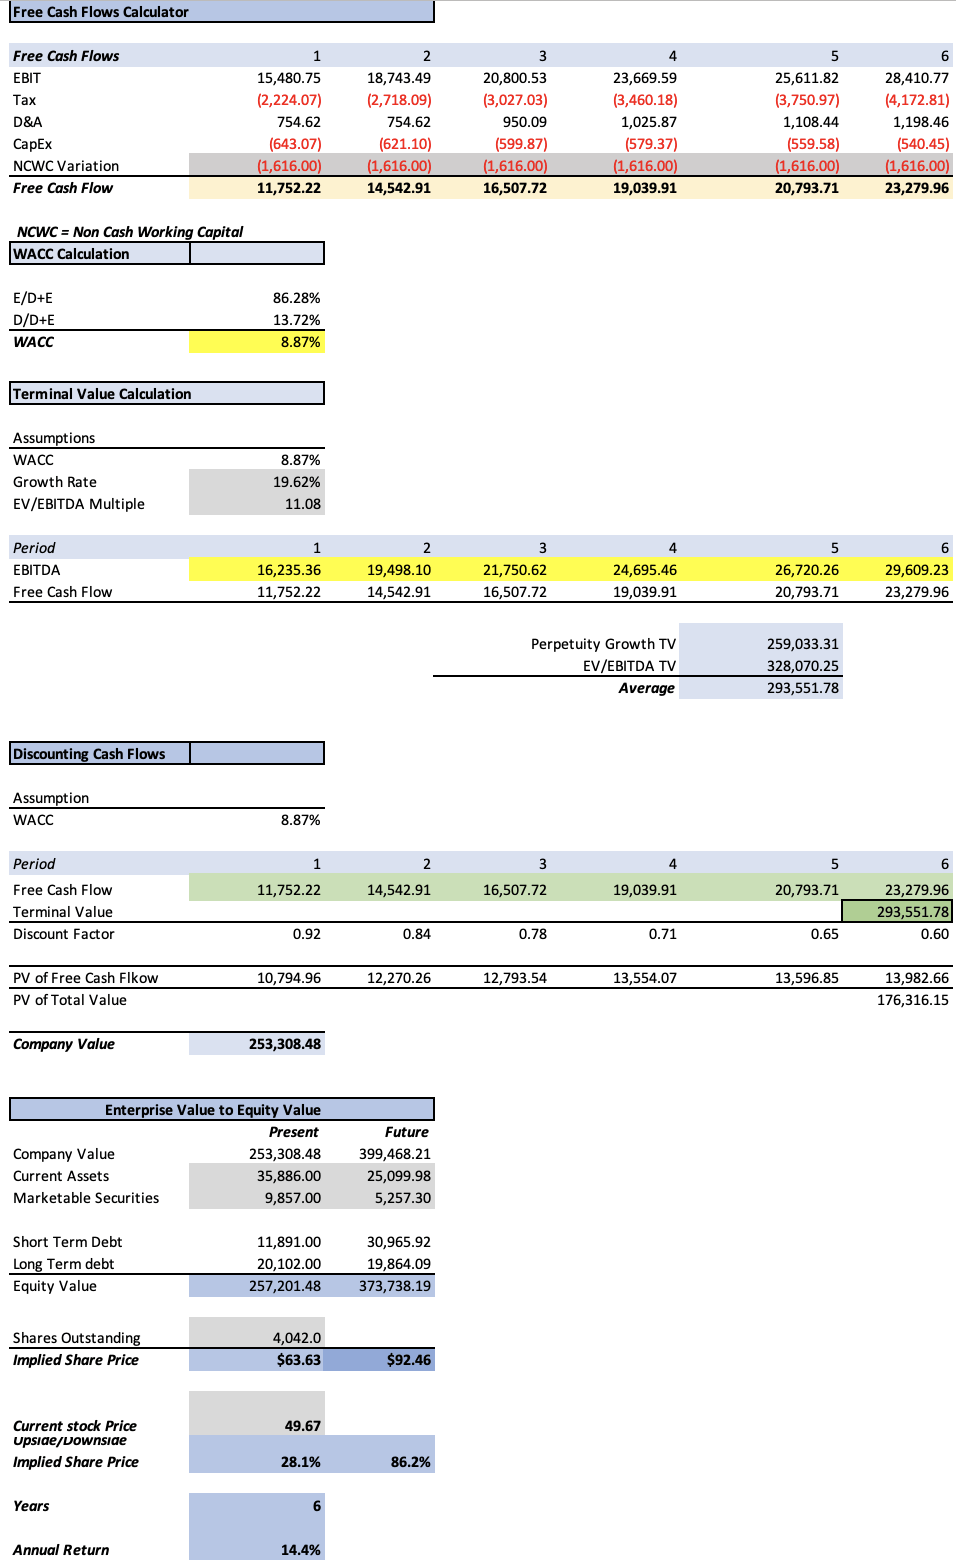
Author’s Calculations
As you can see, the model suggests a fair price per share of $63.63 which is 28.1% above the current stock price of $49.67, and a future stock price for 2029 of $92.46, which translates into a 14.4% annual return throughout 2024-2029.
Risks to Thesis
The main risk with Cisco remains its historical slow growth since its revenue growth has been 2% annually and operating income at 1.9% annually. And this sluggish growth can be observed in its stock price since 2018. The ups and downs are sentiment level. Nevertheless, the good part is that Cisco is a company that can remain flat if it achieves no growth, because it could be the opposite, and instead of remaining flat because of its sluggish growth, the stock tanks.
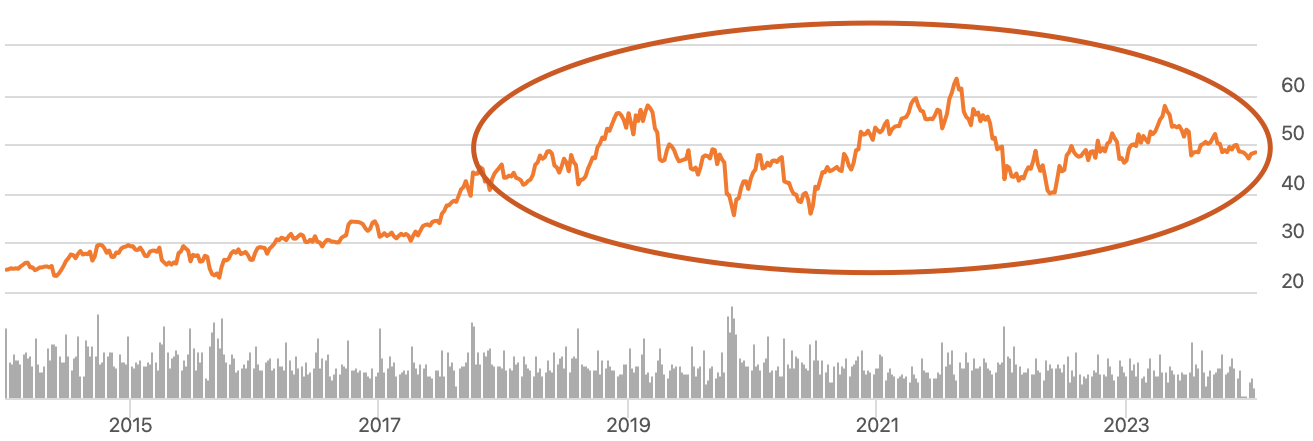
Seeking Alpha
The other risk is that its cybersecurity, collaboration, and services segments are largely dependent on the networking segment. Therefore, if there is a slowdown for that segment all the other segments will be affected and therefore the company’s performance will be dragged down.
Conclusion
Cisco remains hugely undervalued according to my estimates. Since my previous article, the stock has remained flat. Cisco’s stock price struggle is not recent, it can be dated back to 2018, and thereafter the stock has been on a roller-coaster of optimism with ups and downs that have concluded with a flat stock price trend until today.
Nevertheless, I think that the rigidity of the stock price is an advantage here since it’s possible to open a position in the stock and wait until it realizes the big upside that’s implied by my model without the preoccupation that the stock is going to collapse shortly.
I reiterate my strong buy rating on Cisco as my fair price estimate stands at $63.63, which is 28.1% above the current stock price of $49.67, and my future price estimate for 2029 at $92.46. This last one implies 14.4% annual returns.
One of the main boosts in Cisco’s valuation is Splunk which added around $4.21B in new revenue and that number could increase to $5.62B for FY2025, as Cisco plans to offer Splunk to 5K of its customers. For these reasons, I reiterate my “strong-buy” rating on Cisco.
Analyst’s Disclosure: I/we have no stock, option or similar derivative position in any of the companies mentioned, and no plans to initiate any such positions within the next 72 hours. I wrote this article myself, and it expresses my own opinions. I am not receiving compensation for it (other than from Seeking Alpha). I have no business relationship with any company whose stock is mentioned in this article.
Seeking Alpha’s Disclosure: Past performance is no guarantee of future results. No recommendation or advice is being given as to whether any investment is suitable for a particular investor. Any views or opinions expressed above may not reflect those of Seeking Alpha as a whole. Seeking Alpha is not a licensed securities dealer, broker or US investment adviser or investment bank. Our analysts are third party authors that include both professional investors and individual investors who may not be licensed or certified by any institute or regulatory body.