Summary:
- Cisco share price declines often lead the economy into recession, as a function of slashed corporate dollars on capital spending projects.
- Valuations may not be as cheap as you think in a deep recession scenario, as operating results turn sharply lower.
- Technical momentum stats have been quite bearish since August, diverging with the decent share price rally from October.
- I rate shares a Sell/Avoid until later in the year, when a recession is more fully discounted into the quote.
kynny
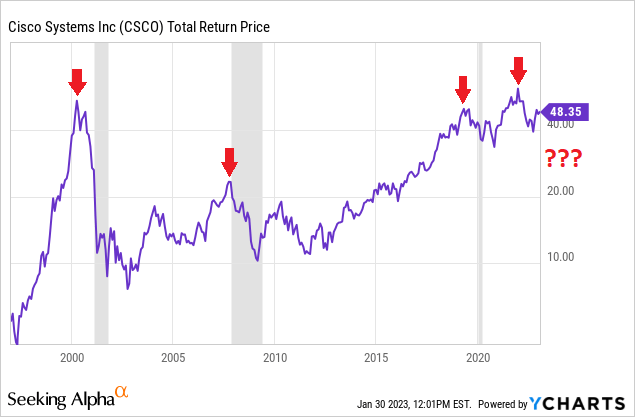
One of my favorite “lead” signal callers of an approaching recession is Cisco (NASDAQ:CSCO). Since becoming a mega-cap, mature business in the late 1990s, its stock quote has turned lower before each of the last 3 recessions, including the original Tech Bust of 2001-02, Great Recession of 2008-09, and even the pandemic dump of 2020. Capital spending is usually cut first when an economic slowdown appears, which is the router, cloud, and internet connectivity business pulse on the economy Cisco represents.
No matter what your view on the current valuation story (Cisco has retained the appearance of a value stock since 2002), any recession in 2023 will not be kind to its underlying operations. If we get a deep recession, Cisco will likely miss the revenue and earnings estimates of today by a wide margin over the next 12-18 months.
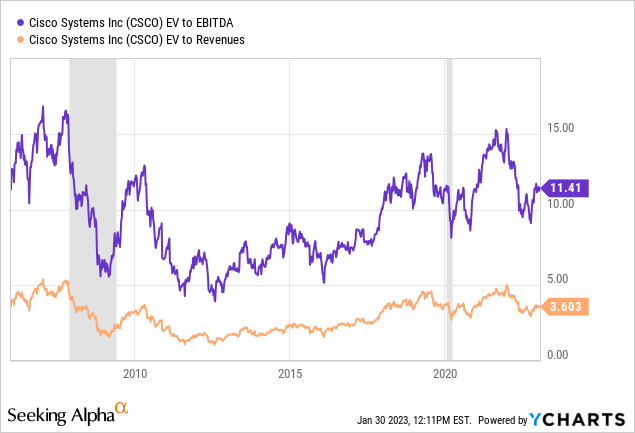
In terms of valuations, Cisco is near the middle of its range since 2006 on many basic ratio data points, a good 17 years of recent history. On enterprise value to trailing EBITDA and revenues, you can see how much lower the company has been re-rated during the last two recessions.
YCharts – Cisco, EV to trailing EBITDA & Revenues, Since 2006, Recessions in Grey
Recession Performance
Below is a graph of total returns outlined by Cisco since 1997, with official U.S. contractions in real GDP shaded in grey. Typically, Cisco’s stock will peak months ahead of any GDP drop, as an excellent leading indicator of trouble dead ahead. Does every Cisco decline in price indicate a recession? No, but today’s setup is further evidence an S&P 500 downturn (as corporate profit declines become a more central part of the investing thesis) and economic slide are the here and now danger to contemplate.
YCharts – Cisco, Total Return Adjusted Price, Author Reference Points, Since 1997
Ugly Technical Chart
Cisco’s stock price did peak with the Tech Boom 2.0 peak in late 2021. Numerous investors are hoping the 2022 decline is just an arbitrage move similar to other Big Tech businesses. However, this drop may also be signaling technology CapEx spending is rolling over in the global economy. Higher inflation and interest rates may take more of the blame for bearish Cisco trading behavior.
My read of the Cisco trading pattern is real underlying weakness has been coincidentally (or not) part of the equation in January 2023. This bearish pattern with sliding momentum indicator readings suggests another large price downmove could be approaching.
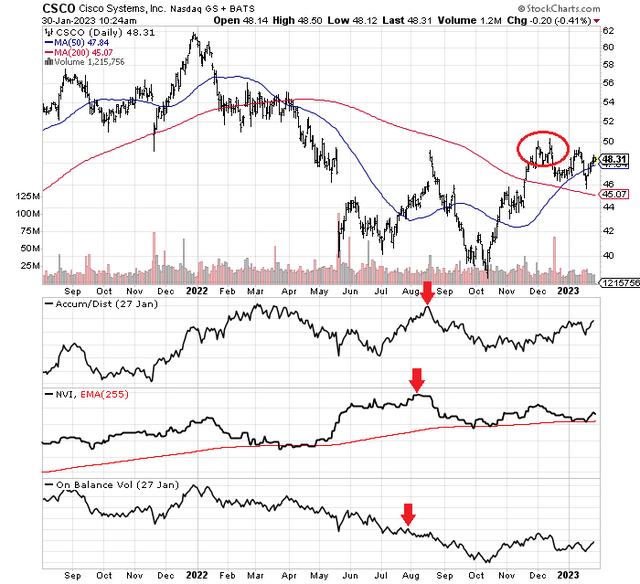
I have drawn an 18-month chart of daily price and volume changes below. The first thing you will notice is Cisco’s worth peaked during December 2021 in the low-$60s. Then, price slid a whopping -40% into October 2022.
What bothers me most is a variety of momentum indicators were holding up well into August. However, they have suffered mightily since that point, despite a 30%+ rally into December. I have circled in red how the 7-month price highs of December are matched against subtle momentum “divergences” in the Accumulation/Distribution Line, Negative Volume Index, and On Balance Volume calculations. Marking higher readings with red arrows, each indicator has actually outlined a significant decline since the summertime.
StockCharts.com – Cisco, Dividend-Adjusted 18 Months of Price & Volume Changes, Author Reference Points
Statistically, in my research over the last decade, rising trends in at least 2 of these 3 indicators is considered a “healthy” setup for future gains. The fact all 3 are in decline, at the same time as price has risen, is a major warning flag to me – the present rally doesn’t have serious support.
Final Thoughts
If a recession is next (and I strongly believe it is here or nearly so, based on the wicked inversion in the Treasury interest rate curve), Cisco will almost surely fall to new lows under $38 a share. I can model prices as low as $30 in a deep recession (using lower EV ratios on worse than forecast operating results), which would line up well with past occurrences for percentage losses (specifically the 2000-03 and 2008-09 recessions).
What could prevent a Cisco disaster for shareholder returns? Specifically, a “soft landing” where a recession is avoided could keep prices above $40 all year. My view is such a scenario is not very probable. If you want to dream a little, a soft-landing scenario and China’s reopening could support price above $50 a share, as Cisco revenue and earnings at least meet current forecasts. Nevertheless, I view this possibility as wishful thinking, lacking any real-world evidence.
The economy is slowing, interest rates are still rising, and a major drop in overall corporate incomes will be the final domino to fall. That’s how the economic cycle has worked in the past anyway. If large businesses cut back on network spending, Cisco will suffer soon, and the stock quote will backpedal appreciably.
My research heavily suggests Cisco’s price will not remain in the upper-$40s. Consequently, I rate shares a Sell today for a 6-month to 12-month outlook. I am modeling a total return performance between a slight -10% loss to a -30% ride lower for shareholders by the end of 2023.
Thanks for reading. Please consider this article a first step in your due diligence process. Consulting with a registered and experienced investment advisor is recommended before making any trade.
Disclosure: I/we have no stock, option or similar derivative position in any of the companies mentioned, and no plans to initiate any such positions within the next 72 hours. I wrote this article myself, and it expresses my own opinions. I am not receiving compensation for it (other than from Seeking Alpha). I have no business relationship with any company whose stock is mentioned in this article.
Additional disclosure: This writing is for educational and informational purposes only. All opinions expressed herein are not investment recommendations, and are not meant to be relied upon in investment decisions. The author is not acting in an investment advisor capacity and is not a registered investment advisor. The author recommends investors consult a qualified investment advisor before making any trade. Any projections, market outlooks or estimates herein are forward looking statements and are based upon certain assumptions and should not be construed to be indicative of actual events that will occur. This article is not an investment research report, but an opinion written at a point in time. The author’s opinions expressed herein address only a small cross-section of data related to an investment in securities mentioned. Any analysis presented is based on incomplete information, and is limited in scope and accuracy. The information and data in this article are obtained from sources believed to be reliable, but their accuracy and completeness are not guaranteed. The author expressly disclaims all liability for errors and omissions in the service and for the use or interpretation by others of information contained herein. Any and all opinions, estimates, and conclusions are based on the author’s best judgment at the time of publication, and are subject to change without notice. The author undertakes no obligation to correct, update or revise the information in this document or to otherwise provide any additional materials. Past performance is no guarantee of future returns.
