
Summary:
- Historical earnings patterns are predictive of future earnings results, making it rational for investors to use them to increase the probability of investing success.
- Dividends become important in addition to earnings for mature businesses, as they offer insurance against potential stock price declines.
- The “Dividend Time Until Payback” analysis estimates how many years it will take for an investor to earn back their initial investment through dividends.
karandaev
Introduction
Perhaps the most important feature of a quality business is that it maintains a repeatable process that can be sustained, and ideally grown, over time. In this sense, most good businesses work similarly to an algorithm. Good businesses take raw materials, run them through a standardized process that transforms them in some way to produce a product, and then sell that product for more money than it took to make it. The product is eventually consumed, needs to be replaced, so the business runs this algorithm again, perhaps making small changes along the way to adapt to any external changes in the market.
Different types of businesses will have different degrees of repetition-to-change. A consumer staples business like Coca-Cola (NYSE:KO) might be 90% repetition to 10% adaptation in a given year, while a business like Microsoft (MSFT) might be more like 50% repetition to 50% adaptation. It has reportedly been said that Warren Buffett once told Bill Gates, “A ham sandwich could run Coca-Cola.” In Warren’s eyes, this was a good thing because it made Coke easier to run and Coke’s future easier to predict. My view is this is due to Coca-Cola’s ability to repeat its business algorithm over and over again with little need for adaptation.
As medium and long-term investors, we want to invest in the best business algorithms. The clearest evidence of a good business is the end result of this process: Earnings. Businesses that can run their algorithms during multiple types of external environments (like recessions, booms and busts, changing interest rates and regulatory environments, etc.) and still produce good earnings results have demonstrated the long-term success of their repeatable processes.
Because businesses have these repeatable processes as the driving force behind consistent long-term earnings success, historical earnings patterns become very predictive of future earnings results. For well over a century, Coca-Cola, and many other great businesses, have demonstrated this fact. For this reason, it’s very rational for investors to use historical earnings patterns to increase the probability of future investing success. This thinking holds true as a baseline for all businesses. But once businesses are more mature, often they are not fast-growth businesses anymore because there isn’t much more room to grow using their traditional processes. In these cases, in addition to earnings, investors expect the businesses to pay out dividends as well, and investors can use a combination of earnings and dividends metrics to value the business.
In this article, I will explain my dividend valuation process and show the predictive power of data from 2004-2013 applied to the current decade. Then I will use the same valuation method for Coke stock today to estimate its value today based on future dividend payouts.
Categorizing Coke’s Business
Understanding a business’s earnings history is critically important both for properly categorizing the business and for estimating future returns. In the FAST Graph below, earnings per share are represented by the dark green shaded area.
FAST Graphs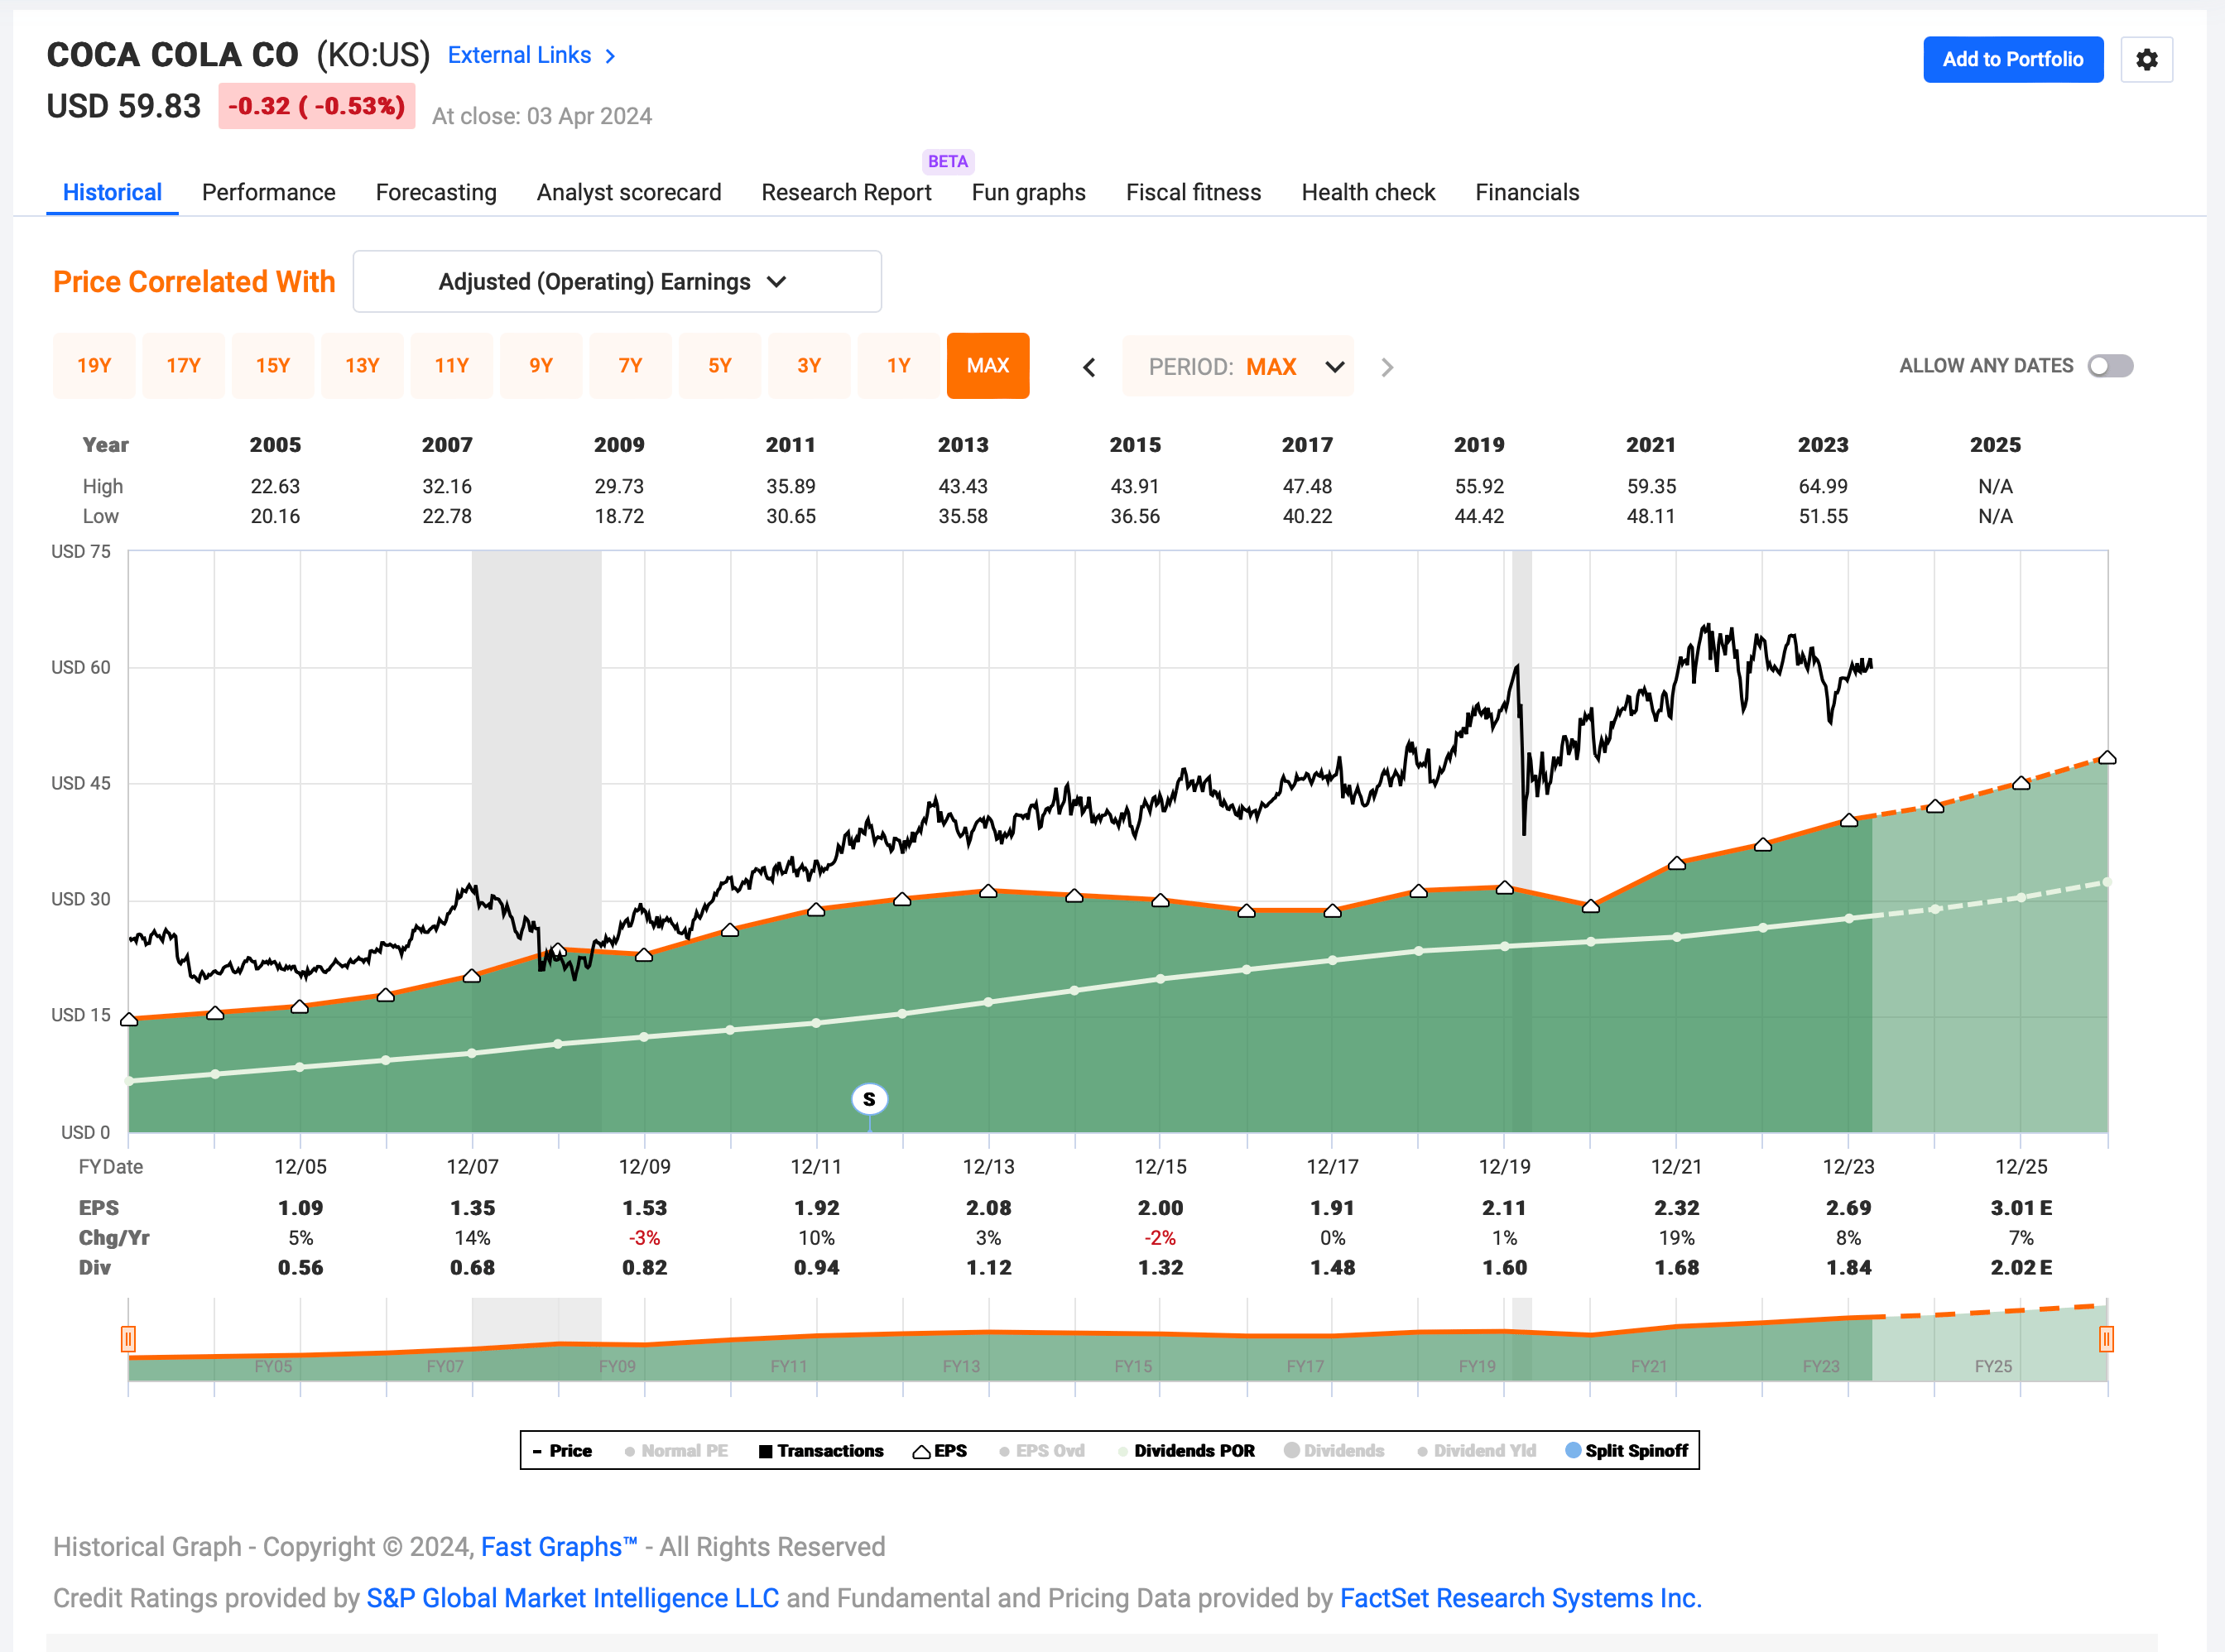
When initially examining a business, the only thing that really matters are the historical earnings patterns. We want to see if there is evidence the business algorithm works, and how consistently or inconsistently it works, over time under differing external conditions. What we see with Coke is slow, but consistent, long-term earnings growth during these two decades.
Once we know we have a growing and relatively predictable business, the next thing we want to know is how fast earnings are growing. The very quick earnings growth estimate (without digging particularly deep into financials, stock buybacks, or cyclicality) is about 5% earnings growth in a 3% inflationary environment. This is slow real earnings growth over this entire period, and during the most recent decade roughly flat real earnings growth.
What we do once we understand what earnings growth is like, is to categorize the stage of the business life cycle Coca-Cola is in right now. Every successful public business has a life cycle. Along with earnings cyclicality, it is important to estimate early on as part of one’s analysis what part of the business life cycle a business is likely in. Additionally, estimating where the business is trending toward over the medium-term future is important as well. I created the graphic below to help illustrate where I think Coke’s business belongs in this cycle.
Cory Cramer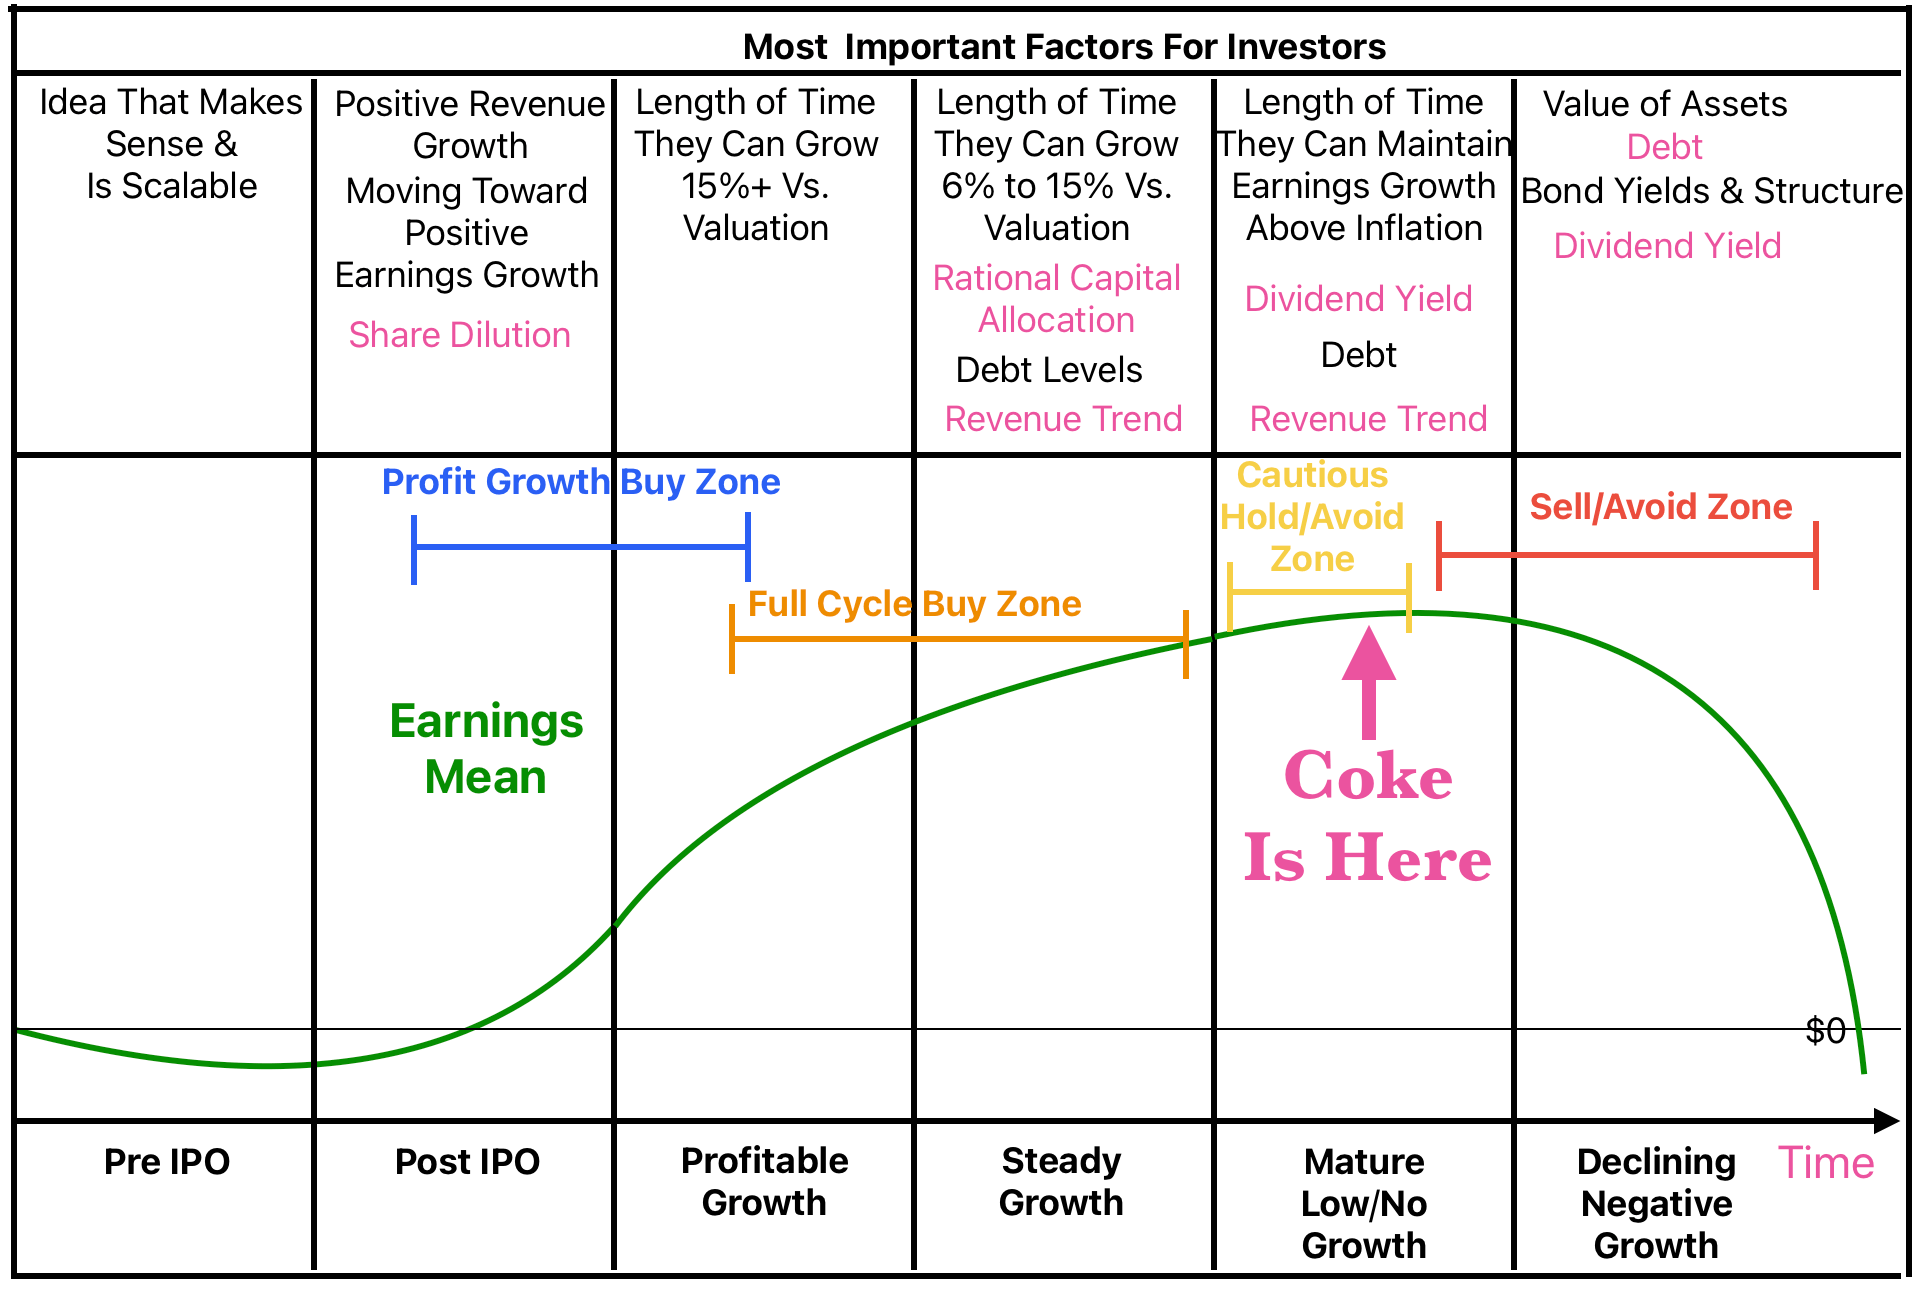
Coke has been a remarkable company that has been publicly traded for around a century. They managed to spread the time they spent in the “Profitable Growth” and “Steady Growth” stages over several decades each. This century, however, we are at a point where Coke’s beverages are nearly within arm’s reach of anyone who desires them all around the globe. And while businesses can always adapt and add new products, it becomes increasingly difficult for those adjustments to move the needle on earnings growth in a substantial way. Typically, new innovations act more to defend the position the company has already established so that it doesn’t slip into the final “Declining Growth” stage, rather than propel additional earnings growth. Based on Coke’s relatively slow earnings growth of late, combined with what we know about their worldwide market penetration, I place Coke pretty firmly in the “Mature Low/No Growth” growth stage.
It is at this stage that dividends can become important in addition to earnings for investors. While sometimes it’s possible for a business to have a second phase of faster growth (As we’ve recently seen with Microsoft), it is very rare. Therefore, investors should prepare in two ways when investing in mature, later-stage, businesses.
First, they should diligently watch for signs that the business may have begun to decline. The reason for this is that most businesses are valued on their future earnings expectations. If earnings are growing, then growth gets extrapolated up into the future, and one can justify the stock price potentially rising at some point to follow that growth. But if earnings are shrinking, then the extrapolation works in reverse and the stock price is likely to fall. This can be especially damaging when earnings flip from growth to decline, so investors can suffer very big losses in the value of the stock (which may never fully recover).
Second, because of this risk, dividends that are paid out of the company offer a form of insurance against future potential stock price declines. If the dividends are high enough and grow fast enough, then an investor could potentially earn all of their initial investment back via the dividend, before the company tips into negative growth and the stock price falls significantly (and potentially permanently).
It is these dynamics that make a dividend analysis make rational sense in these cases. Because of this, I have structured my dividend analysis to estimate how many years it will take an investor in a mature company to earn an amount equal to their initial investment back via only the dividend and dividend growth. I call this the “Dividend Time Until Payback” analysis.
Dividend Time Until Payback
The process of estimating the dividend time until payback is simple. All you need is the dividend yield and expected long-term dividend growth rate. However, in order to estimate the dividend growth rate, we need to estimate the earnings growth rate first. Dividends come from earnings. They are not in addition to earnings, as some investors think. For that reason, if we are going to estimate future dividend growth, we must estimate future earnings growth, first. Because, as I explained earlier, history is very predictive of the future, I estimate future earnings based on the recent trends of the past.
Because dividend growth will be limited by earnings growth, I limit the dividend growth rate estimate to the expected earnings growth rate unless the payout ratio is less than 50%, in which case I average the historical dividend growth rates and earnings growth rates together to get the future dividend growth rate. For example, if a business has a 5% historical earnings growth rate, a 10% dividend growth rate, and a 40% payout ratio, then the future dividend growth rate expectation would be 7.5%. If the same business had a 60% payout ratio, then the future dividend growth rate would be limited to the historical earnings growth rate level of 5%.
Importantly, I assume these dividends will be collected by the owner of the business and held or spent. I do not assume they will be reinvested. If a retiree wishes to live off their dividends, they can’t both spend them and reinvest them.
As part of this process, I assume the investor starts with a $100 investment, and I test to see how long it would take them to accumulate an additional $100 only from the dividends using the process above. At that point, if a mature business begins to decline, at least an investor will have earned their money back and averted losses.
Because there can be differences in businesses, I think it’s useful to compare a relatively slow-changing business like Coca-Cola to itself during a different time period so that investors can get an idea of the company’s valuation. I will do this by performing the same dividend valuation process on Coke from 2004-2013 and then from 2014-2024. This adds the additional benefit of being able to test how predictive the valuation process was if one used it in 2014.
Coke From 2004-2013
FAST Graphs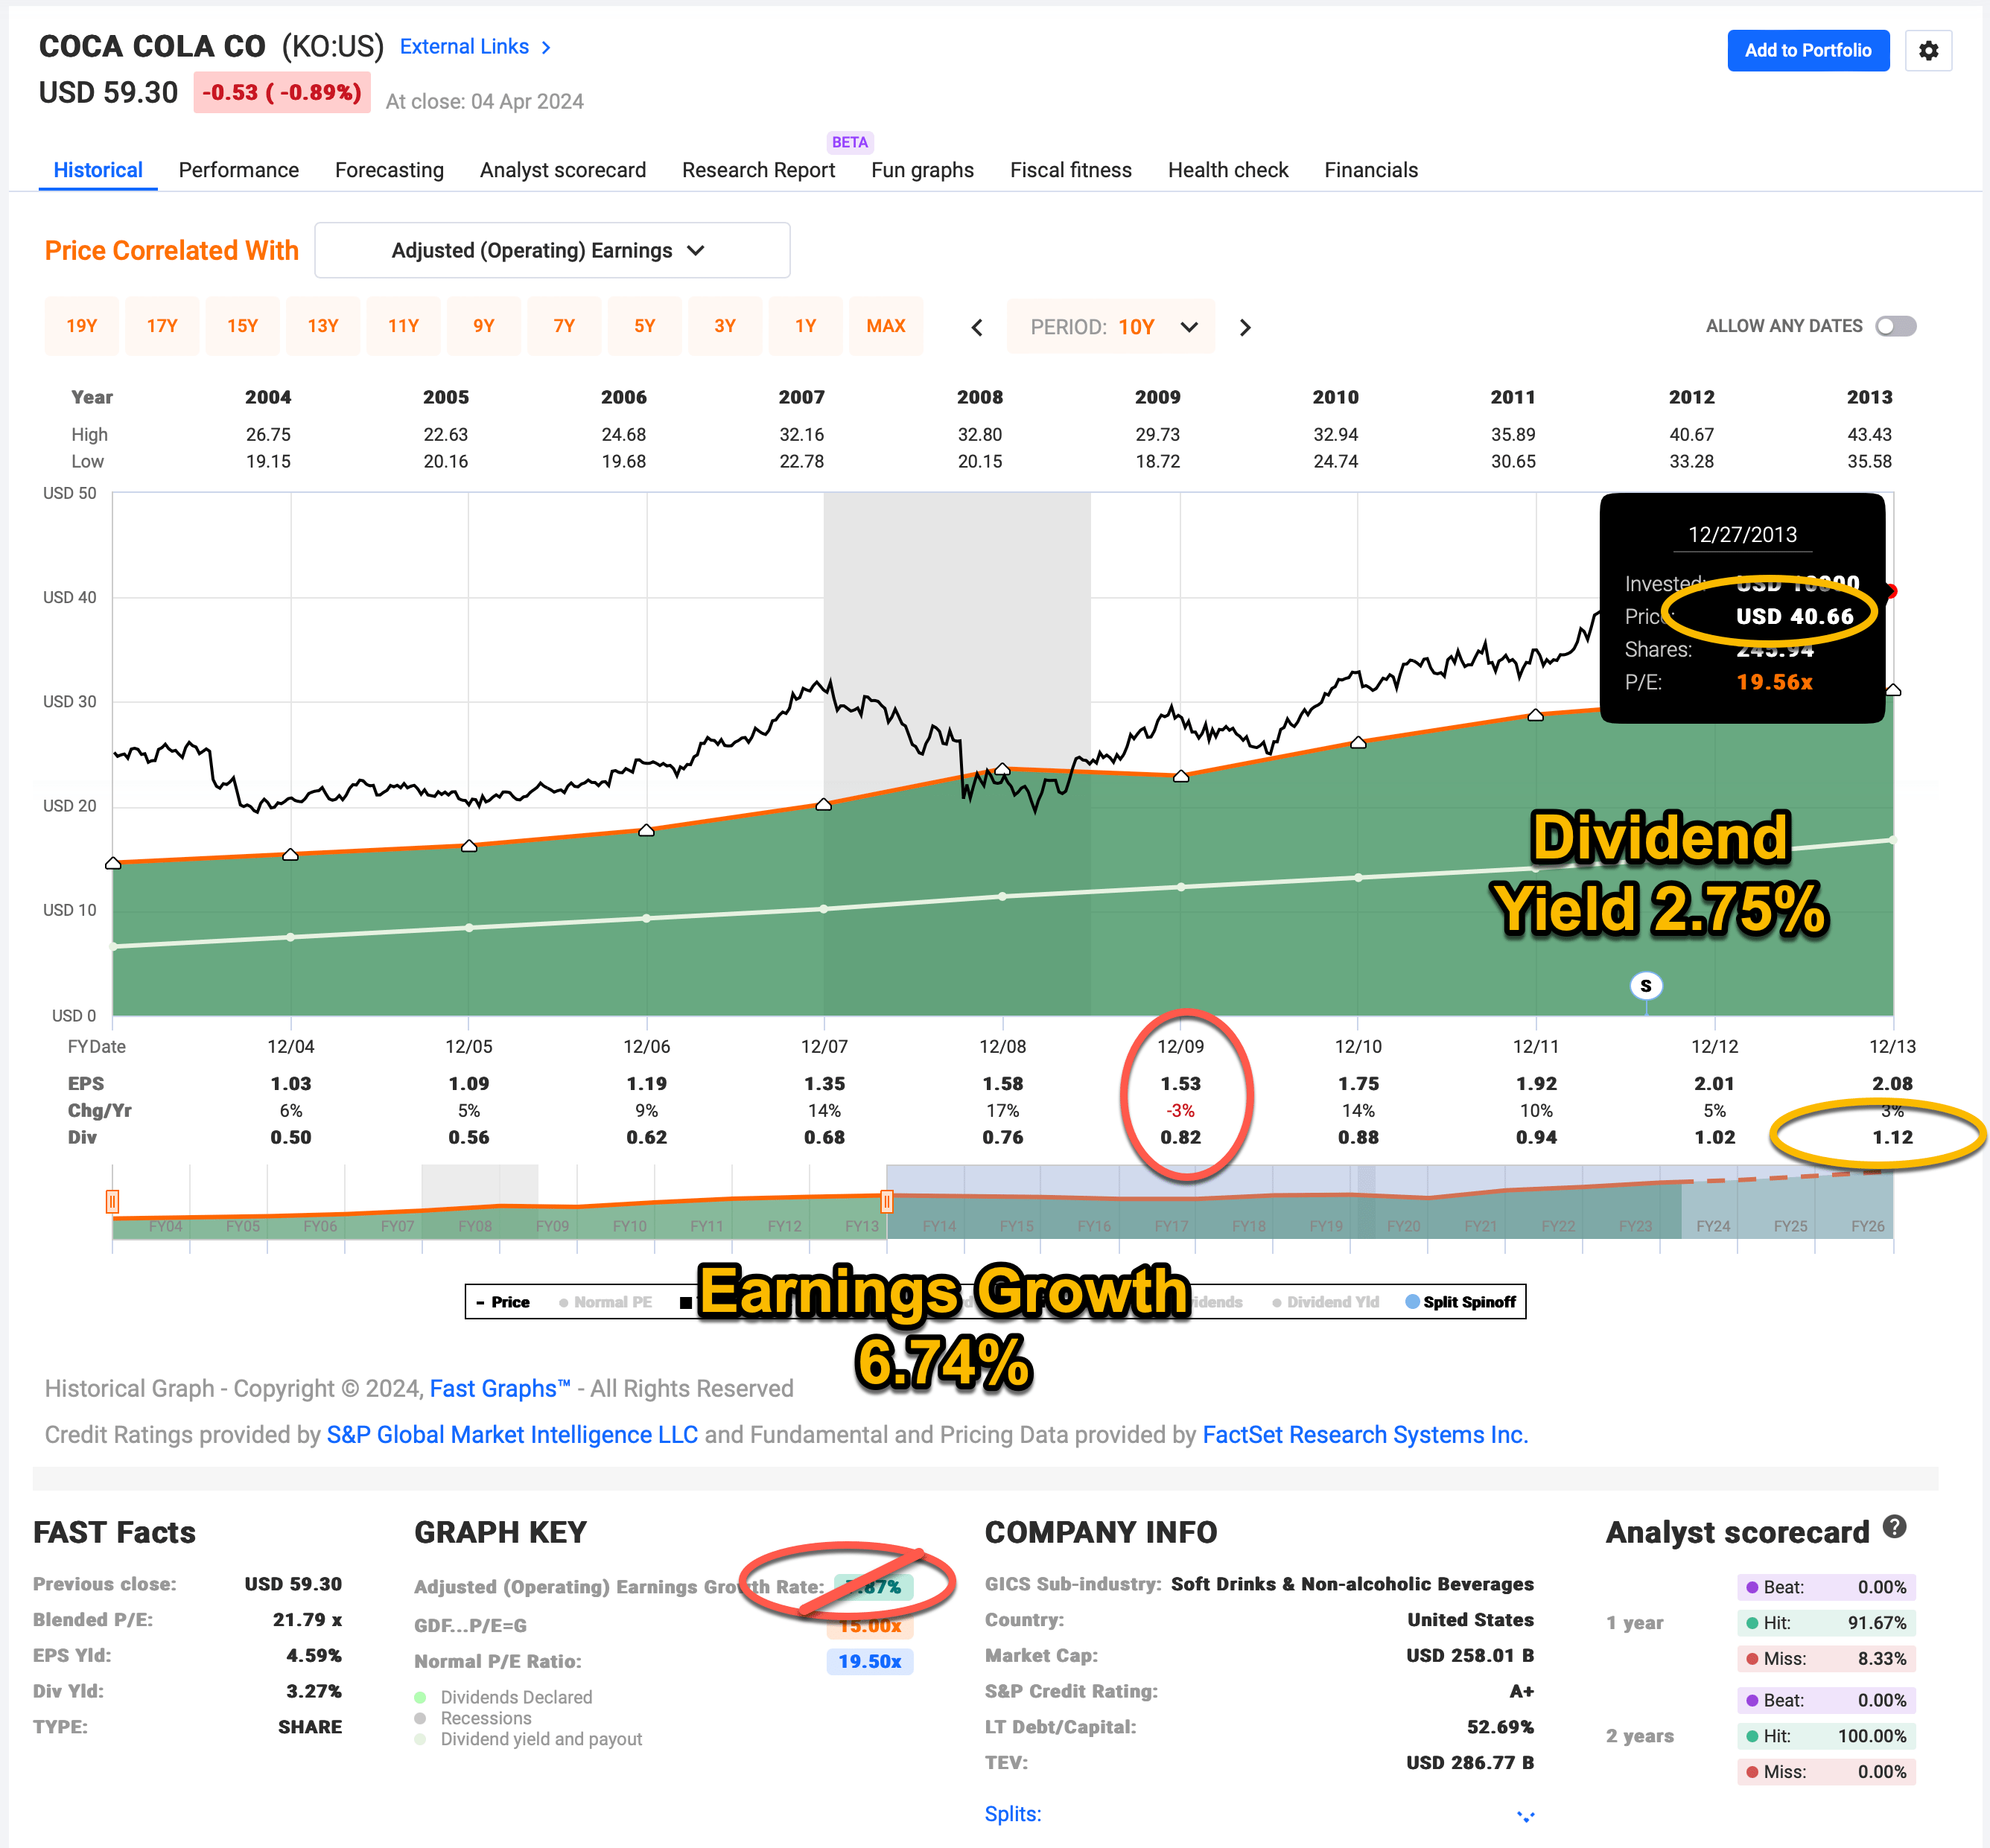
The time frame in the graph above is 2004-2013. At the end of that period, Coke’s dividend yield was 2.75%. The earnings growth during this period, once I controlled for the -3% earnings decline in 2009, and the roughly 10% of shares outstanding the company bought back, was +6.74%. Earnings were $2.08 and the dividend was $1.12, producing a 53.85% dividend payout ratio. Because this payout ratio was over 50%, I will use the +6.74% earnings growth rate as the expected long-term dividend growth.
This means we have a +2.75% dividend growing at +6.74%. What we want to know is how many years it will take to earn $100 in dividends on a $100 initial investment back in 2014.
| Year |
Dividend Projection On $100 |
Projected Cumulative Dividends |
Projected Year | Actual Dividends On $100 |
Actual Dividends Collected On $100 |
| 1 | $2.94 | $2.94 | 2014 | $2.68 | $2.68 |
| 2 | $3.14 | $6.08 | 2015 | $2.90 | $5.58 |
| 3 | $3.35 | $9.43 | 2016 | $3.07 | $8.65 |
| 4 | $3.58 | $13.01 | 2017 | $3.25 | $11.90 |
| 5 | $3.81 | $16.82 | 2018 | $3.43 | $15.33 |
| 6 |
$4.07 |
$20.89 | 2019 | $3.51 | $18.84 |
| 7 | $4.35 | $25.24 | 2020 | $3.60 | $22.44 |
| 8 | $4.64 | $29.88 | 2021 | $3.69 | $26.13 |
| 9 | $4.95 | $34.88 | 2022 | $3.87 | $30.00 |
| 10 | $5.29 | $35.17 | 2023 | $4.01 | $34.01 |
| 11 | $5.64 | $40.81 | 2024 | ||
| 12 | $6.03 | $46.84 | 2025 | ||
| 13 | $6.43 | $53.27 | 2026 | ||
| 14 | $6.86 | $60.13 | 2027 | ||
| 15 | $7.33 | $67.46 | 2028 | ||
| 16 | $7.82 | $75.28 | 2029 | ||
| 17 | $8.35 | $83.63 | 2030 | ||
| 18 | $8.91 | $92.54 | 2031 | ||
| 19 | $9.51 | $102.05 | 2032 | ||
|
19 Year Time Until Payback |
What I show in the table above, is that using my Dividend Time Until Payback valuation approach, a person buying Coke stock in early 2014 as a dividend investment, should have expected to earn an amount equal to their initial investment back in about 19 years. The projected dividends collected during the first 10 years on a $100 investment was $35.17 and Coke actually delivered about $34.01 for each $100 invested in 2014. So, for a decade-long projection, my estimate was very close to reality.
Now let’s take the same process and apply it to Coke’s valuation today.
Coca-Cola Stock From 2014-2024
FAST Graphs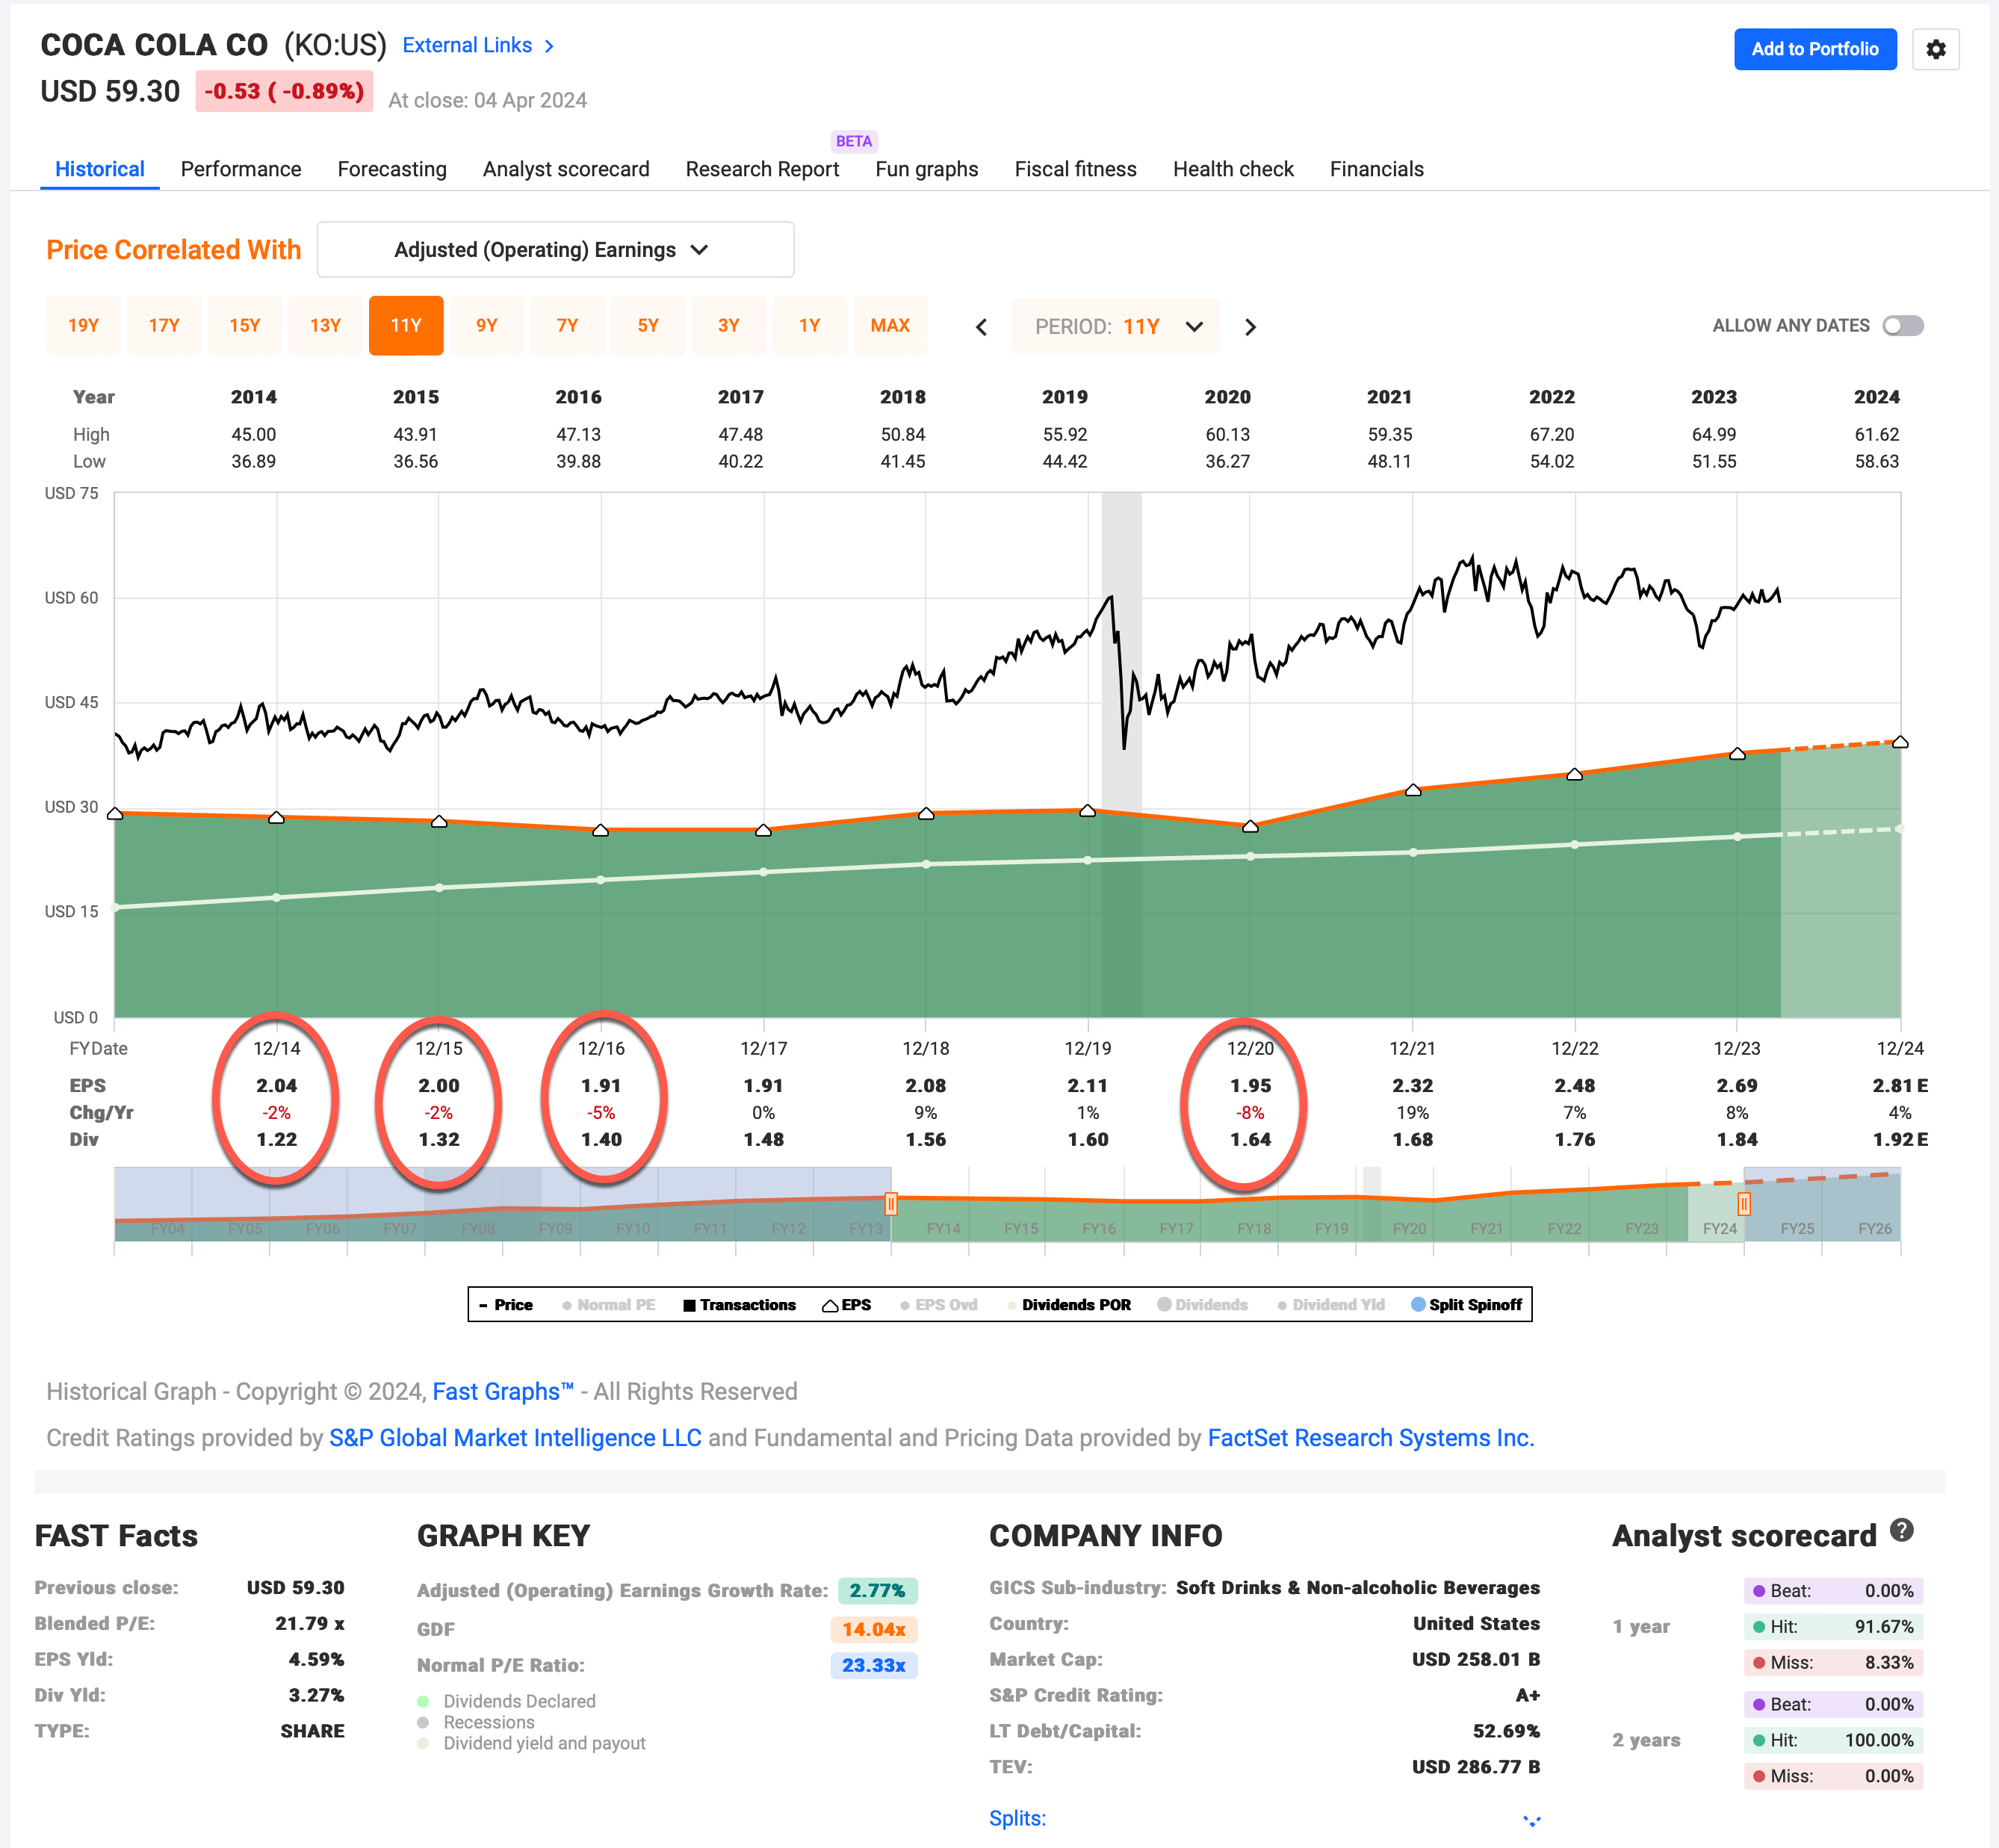
Coke had pretty weak earnings growth during this time period, producing only a +2.77% EPS growth rate, which is about the same as US inflation.
Now that we have an earnings growth rate estimate, let’s examine their dividend growth.
FAST Graphs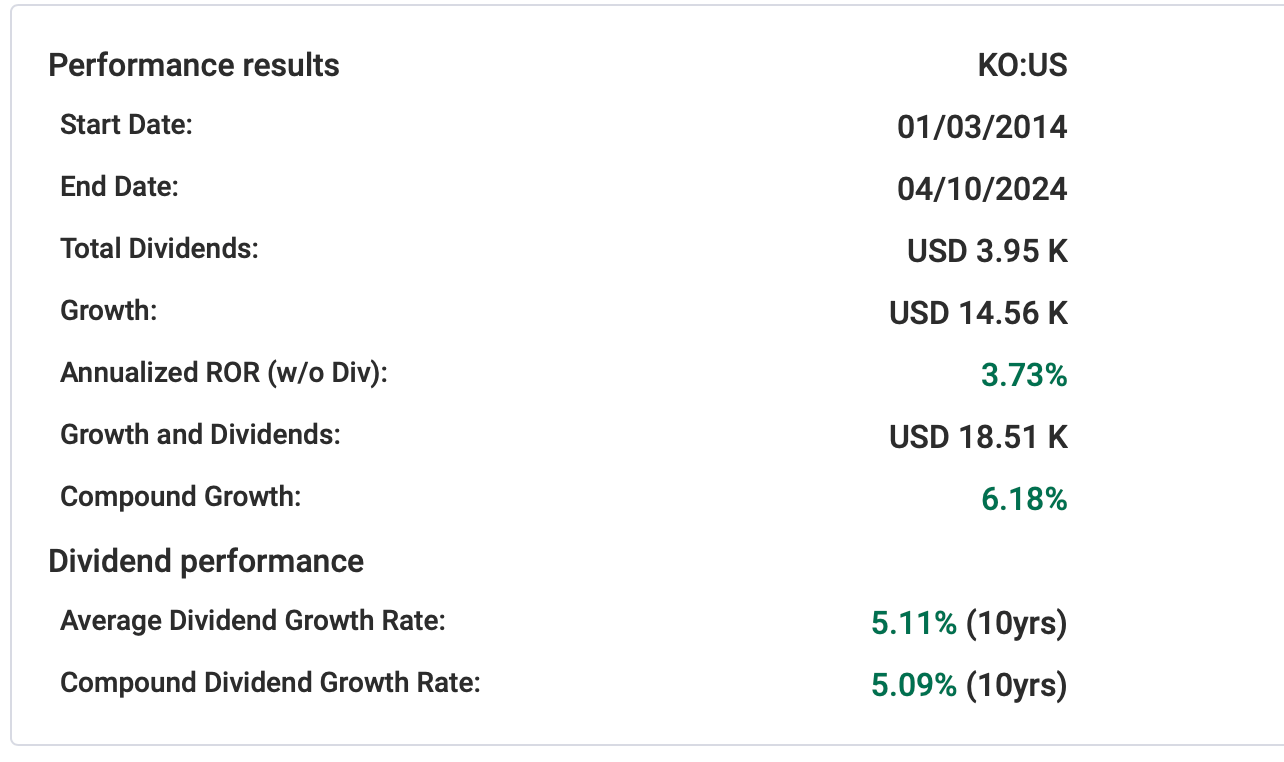
Coke’s compounded dividend growth rate during this period has been +5.09%.
Using Coke’s 2024 forward earnings estimates, its payout ratio is about 65.48%, which is higher than 50%. That means I will use the lower of Coke’s +2.77% earning growth and +5.09% dividend growth rates as my expected long-term dividend growth rate, so, I will use +2.77% as the projected dividend growth rate going forward. (As a side note, I think this will probably more or less match the US inflation rate, whatever it happens to be.)
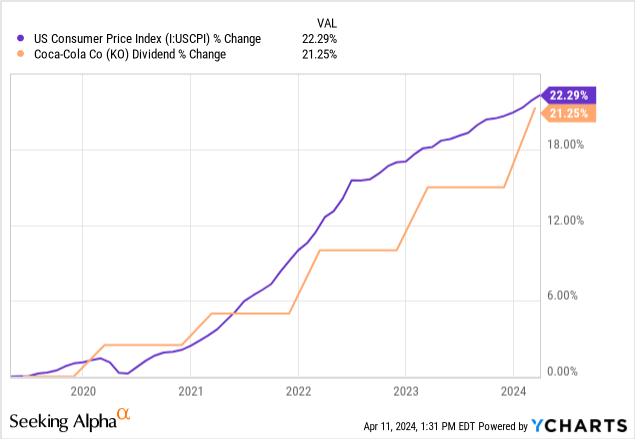
You can see that over the past 5 years, the US CPI and Coke’s dividend growth rate have essentially been the same.
Today I assume a +3.29% dividend yield growing at +2.77%. What we want to know is how many years it will take to earn $100 in dividends on a $100 initial investment in 2024.
| Year | Projected Dividend on $100 | Projected Cumulative Dividends on $100 |
| 1 | $3.38 | $3.38 |
| 2 | $3.47 | $6.85 |
| 3 | $3.57 | $10.42 |
| 4 | $3.67 | $14.09 |
| 5 | $3.78 | $17.87 |
| 6 | $3.88 | $21.75 |
| 7 | $3.99 | $25.74 |
| 8 | $4.10 | $29.84 |
| 9 | $4.23 |
$34.07 |
| 10 |
$4.34 |
$38.41 |
| 11 | $4.46 | $42.87 |
| 12 | $4.59 | $47.46 |
| 13 | $4.79 | $52.18 |
| 14 | $4.85 | $57.03 |
| 15 | $4.99 | $62.01 |
| 16 | $5.13 | $67.14 |
| 17 | $5.27 | $72.41 |
| 18 | $5.42 | $77.83 |
| 19 | $5.57 | $83.40 |
| 20 | $5.73 | $89.13 |
| 21 | $5.89 | $95.02 |
| 22 | $6.06 | $101.08 |
| 22 Year Time Until Payback |
We can see it would take about 22 years for an investor buying Coke stock today to earn their initial investment back via the dividend and dividend growth, compared to 19 years for investors who bought KO back in 2014. This is interesting considering the interest rate environment is much different (higher) now than it was back then. Regardless of bond rates, though, KO’s stock price would need to fall about -13% to -14% (about 4 years worth of dividend payments) to trade at 2014 valuations. This is important to note because if the value of one’s asset falls, then dividends don’t add as much to one’s wealth. If we take this danger into account, then it would take about 26 years instead of 22 years for an investor to maintain the same level of wealth and earn their investment back via dividends. Interestingly, the time it would take an investor to earn their initial investment back on a 3.86% bond (which is what iShares 20+ Year Treasury Bond ETF (TLT) currently yields), is about 26 years as well.
For a couple of additional relative comparisons, when Warren Buffett and Charlie Munger were buying KO stock in late 1987, I estimate the dividend time until payback at that time was about 13 years, or half the current valuation. And I estimate that a 60/40 portfolio like iShares Core Growth Allocation ETF (AOR) would take about 20 years of time until payback.
Forecasting & Time Risk
A unique aspect of the dividend time until payback valuation method is that it highlights the time risk investors are taking more than other methods do. While Coke’s business is certainly easier to forecast compared to other faster-changing businesses, the farther out in time we forecast, the more likely it is we will be inaccurate. There are relatively few businesses in 2002 whose earnings we could have accurately forecasted in 2024. Dividends can often be a little easier than earnings since they tend to fluctuate less, but two decades invite a lot of error.
For example, the Dow Jones Industrial Index is a fairly dividend-heavy index, usually composed of 30 of the best companies in the world. Since 1999, more than 2/3rds of the companies in the index have been removed (and it wasn’t due to good performance) several of them going totally bankrupt. The lesson here is that the longer one waits to have their capital returned to them, the more risk they take. So it’s not just about time, it’s about risk as well. More often than not, companies that are paying dividends are closer to the end of their lifecycle than the beginning.
Conclusion
I’ve done my best in this article to frame Coke’s dividend valuation in the most comprehensive way I could. I estimate it will take about 22 years for a Coke investment at today’s prices to return an investor’s money to them via the dividend. My personal threshold for buying a strictly dividend-based investment is 10 years, perhaps 12 years at most. But it is well-known I like to get very good returns on my investments, so I like to buy stocks when they are very cheap. What other investors want to pay is up to them. I currently track around 71 Dividend Kings along with KO. Right now, Coke’s dividend valuation ranks at about the 60th percentile (lower percentile being more attractive) based purely on dividend time until payback metrics.
Analyst’s Disclosure: I/we have no stock, option or similar derivative position in any of the companies mentioned, and no plans to initiate any such positions within the next 72 hours. I wrote this article myself, and it expresses my own opinions. I am not receiving compensation for it (other than from Seeking Alpha). I have no business relationship with any company whose stock is mentioned in this article.
Seeking Alpha’s Disclosure: Past performance is no guarantee of future results. No recommendation or advice is being given as to whether any investment is suitable for a particular investor. Any views or opinions expressed above may not reflect those of Seeking Alpha as a whole. Seeking Alpha is not a licensed securities dealer, broker or US investment adviser or investment bank. Our analysts are third party authors that include both professional investors and individual investors who may not be licensed or certified by any institute or regulatory body.
If you have found my strategies interesting, useful, or profitable, consider supporting my continued research by joining the Cyclical Investor’s Club. It’s only $40/month, and it’s where I share my latest research and exclusive small-and-midcap ideas. Two-week trials are free.