Summary:
- Comcast Corporation proves enticing despite a saturated telecommunications market, supported by thorough analyses, including Discounted Cash Flow models and segment-specific growth projections.
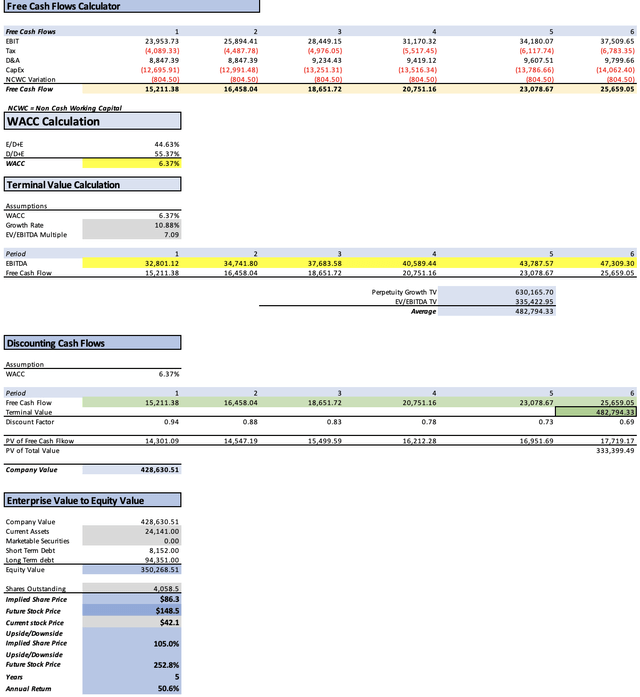
- The first model, which relies on analysts’ estimates, suggests a fair value of $86.3, a 105% upside from the current stock price of $42.10.
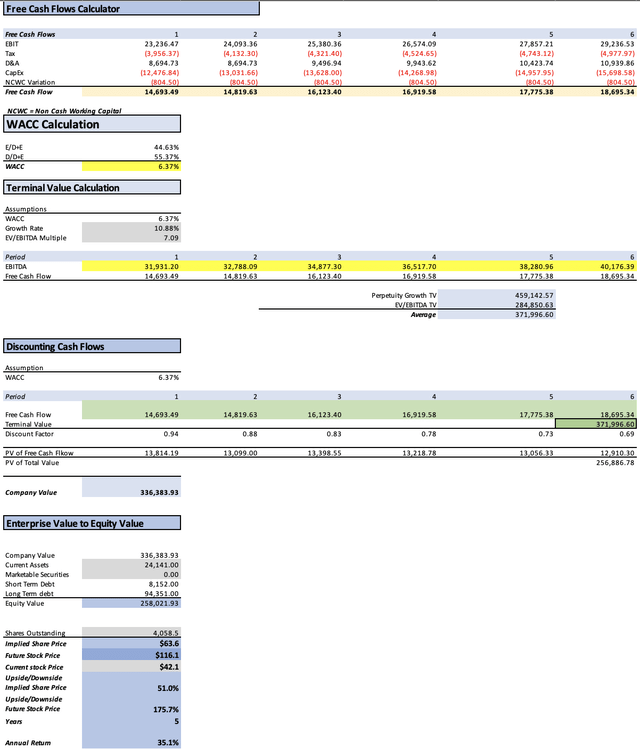
- The second DCF model, relying on conservative estimates, reveals a target of $63.6, which is a 51% upside.
- While acknowledging potential risks, including balance sheet concerns and market saturation, the analysis conveys faith in Comcast’s ability to navigate challenges.
Cindy Ord/Getty Images Entertainment
Thesis
Despite operating in the saturated telecommunications market, Comcast Corporation (NASDAQ:CMCSA) remains an attractive investment opportunity. I conducted two DCF models to evaluate its potential. The first model incorporated analysts’ revenue and EPS growth estimates, while the second utilized my more conservative estimates, revealing a projection lower than the analysts’ consensus. Nonetheless, the analysis indicates a compelling 51% upside from the current stock price of $42.10 and forecasts a future price of $116.10 for 2028
In light of these findings, I confidently recommend Comcast as a “Strong Buy.”
Overview (In millions of USD unless stated otherwise)
Residential Connectivity
The initial focus of Comcast’s earnings report is on its residential connectivity segment. This segment encompasses broadband, wireless (mobile data), and international connectivity (international roaming), collectively contributing approximately 27.80% to Comcast’s total revenues.
Residential Connectivity (Trending Schedule FQ3 2023)
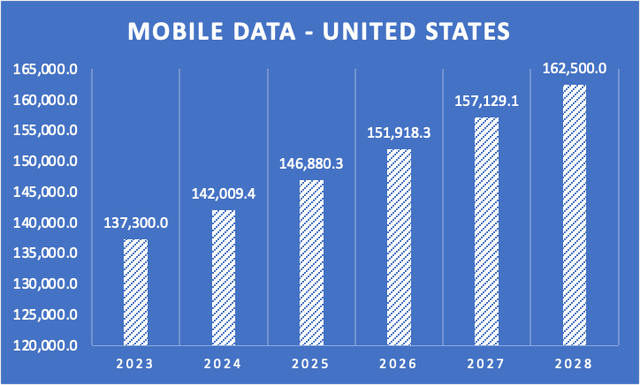
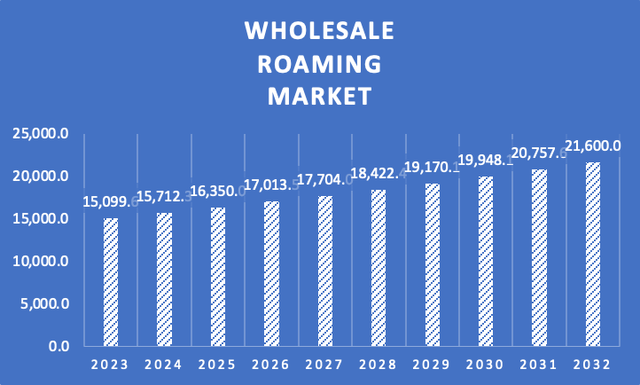
Within this segment, the domestic broadband market is projected to experience a growth rate of 2.61% from 2023 to 2028. Simultaneously, the mobile data segment is anticipated to grow at a rate of 3.43% over the same period. Furthermore, international roaming, as per certain estimates, is forecasted to expand at a rate of 3.9% from 2023 to 2033.
Domestic Broadband Market (Statista) Revenue of the Mobile Data Market – United States (Author’s Calculations with base on Statista) Market Size of the Wholesale Roaming Market – United States (Author’s Calculations with base on Future Market Insights)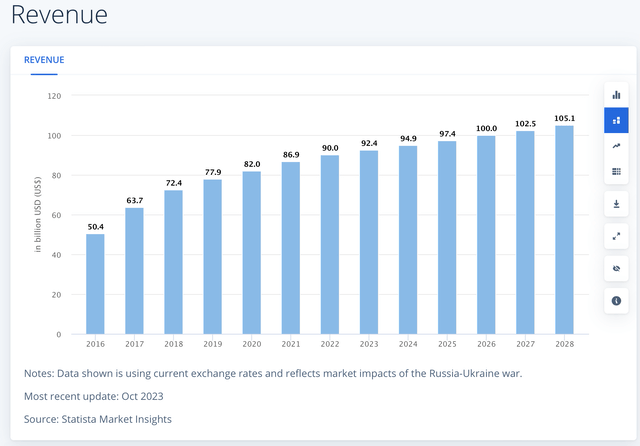
Platforms
Within this segment, Comcast presents its streaming platform, Peacock, offering customers access to TV shows and content produced by Comcast’s own studios.
Platforms (Trending Schedule FQ3 2023)
Peacock may not reach the same level as streaming giants like Netflix, Inc. (NFLX) or The Walt Disney Company (DIS), and probably never will, because Comcast licenses its content which makes it impossible to replicate Disney+’s rapid growth at the start of the pandemic.
In exploring public opinions on Peacock, feedback indicates a mix of positive and negative sentiments. Viewers appreciate the presence of good shows, although they may not be considered outstanding. Some drawbacks mentioned include the inability to disable autoplay, a feature deemed less favorable by users. However, the vast majority of positive reviews signaled that the availability of live sports events made the price of $59.99 a good deal.
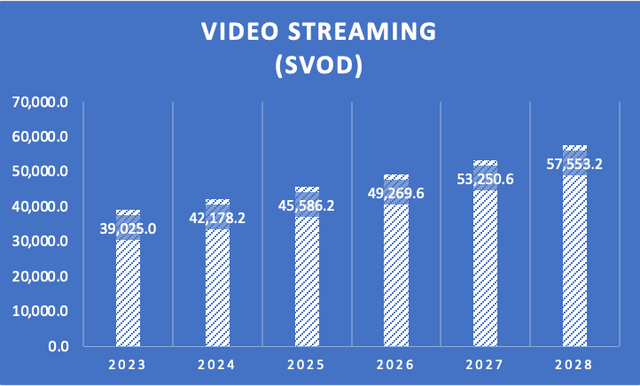
With the above information in mind, we can conclude that Peacock’s edge is likely its live sports coverage. Priced at $5.99 per month or $59.99 annually, subscribers find the offering appealing, particularly for its live sports events. This distinguishes Peacock, as live sports streaming has proven to be a vital element in sustaining the declining Pay-TV industry. Notably, the Global Online Sports Event Streaming market is projected to grow at an impressive rate of 21.5%. Meanwhile, the revenue of the Video Streaming SVOD (Subscription Video on Demand) market is expected to grow at a CAGR of 8.08%
Spending in the Global Sport Event Streaming (Author’s Calculations with base on Playtoday.co) Revenue of the SVOD Video Streaming Market – United States (Author’s Calculations based on Statista)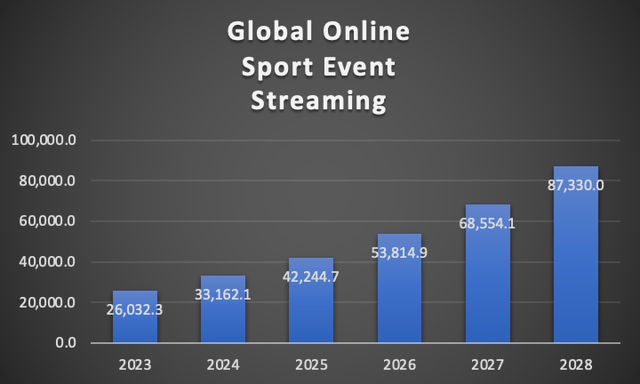
Media
Through its media segment, Comcast engages in domestic advertising and domestic distribution. The latter encompasses Comcast’s proprietary TV channels, including the widely popular financial news outlet CNBC, as well as Sky Group, known for its news broadcasting and channels like Sky Sports. Notably, Comcast acquired Sky from Fox Corporation (FOX) in 2018 for $15.2 billion.
Media (Trending Schedule FQ3 2023)
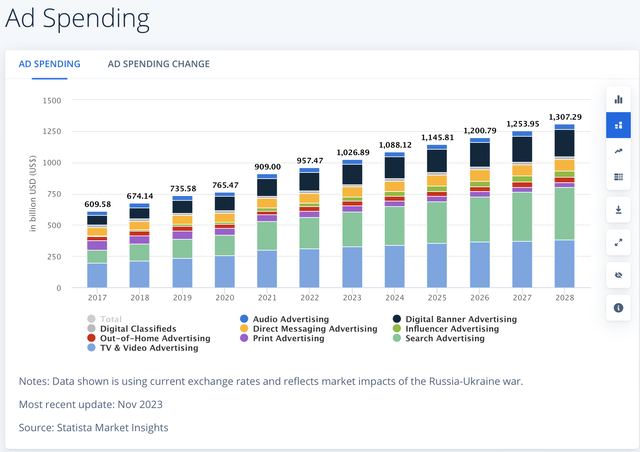
In the realm of advertising, Comcast operates in two primary domains: TV & Video advertising and digital banner advertising. Projections indicate an anticipated growth rate of 4.64% for annual spending in these advertising forms from 2023 to 2028.
Similarly, the domestic distribution market, analogous to Disney’s “linear networks,” is expected to experience a negative CAGR of -2.08% throughout 2028.
Revenue of the Traditional TV and Home Video in the United States (Statista)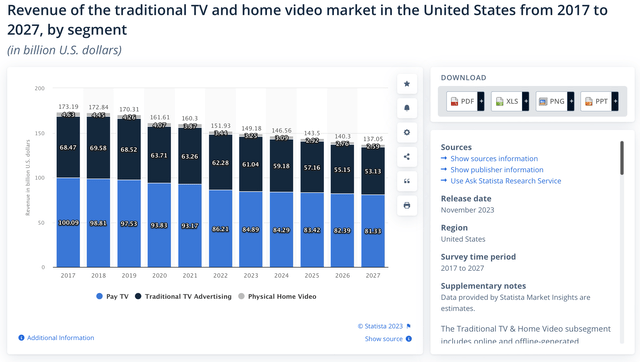
Studios
Comcast’s studio business is epitomized by the renowned Universal Pictures. In addition to this cinematic powerhouse, Comcast also boasts NBC, a prominent news channel that has been the breeding ground for iconic talk shows, including the celebrated Late Night with Conan O’Brien (which concluded its airing in 2009). Comcast’s studio business is epitomized by the renowned Universal Pictures.
Studios (Trending Schedule FQ3 2023)
The main business of NBCUniversal Studios is to license content. Various growth projections exist for the content licensing market. One article on LinkedIn suggests a 5.82% growth rate, while the lowest estimate I found was from Business Research Insights, suggesting 4.34%.
Theme Parks
The last segment under consideration is Comcast’s theme parks, which require minimal elaboration on its nature. This particular segment oversees the operation of Universal Studio’s theme parks located in Orlando, Hollywood, Singapore, Beijing, and Osaka.
For the worldwide theme park market, there are differing growth estimates. For instance, one article on LinkedIn suggests a 3.5% growth rate, while Global Newswire suggests 7.18%, averaging out to 5.34%.
Financials (In millions of USD unless stated otherwise)
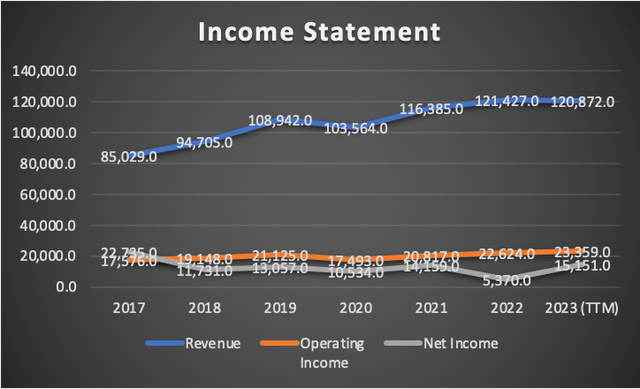
Despite operating in a market considered saturated, Comcast has exhibited commendable financial performance, achieving revenue growth of approximately 6.86% from 2017 to 2023. Similarly, its operating income has experienced a comparable growth rate, averaging 5.57% over the same period. However, net income has mirrored this rate at -5.57%, signaling a negative trend.
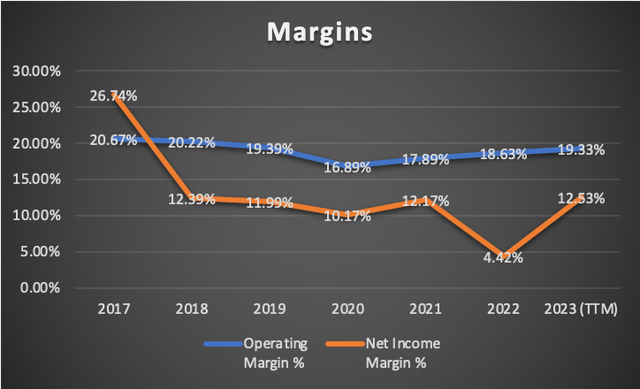
Despite these challenges, Comcast has maintained stable margins. The operating margin has consistently hovered around the 19% mark, while the net income margin has remained steady at approximately 12%.
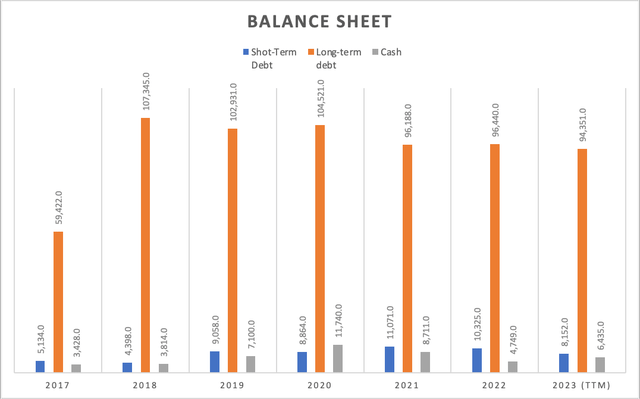
A notable concern in Comcast’s balance sheet, currently burdened with around $94.35 billion in debt and an additional $8.15 billion in short-term debt. This starkly contrasts with its cash reserves, which stand at a comparatively modest $6.4 billion.
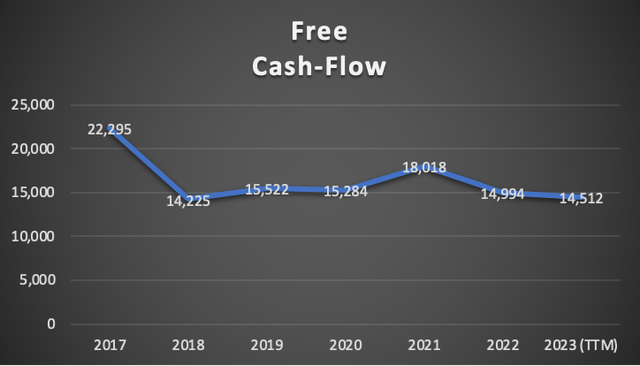
Turning to free cash flow, Comcast experienced a significant 36% slump but has since stabilized around the $14 billion mark. Currently, Comcast’s free cash flow stands at $14.5 billion, ensuring the ability to cover all short-term debt obligations and eliminating the risk of default.
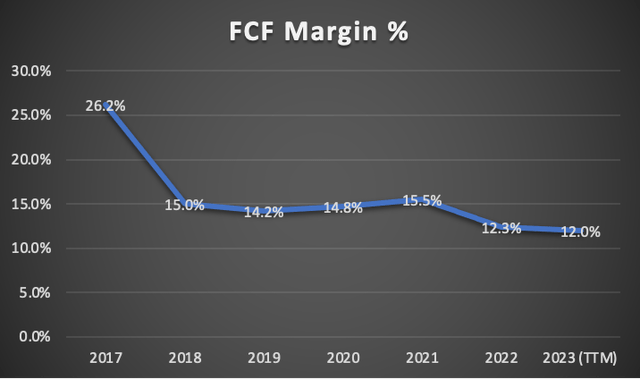
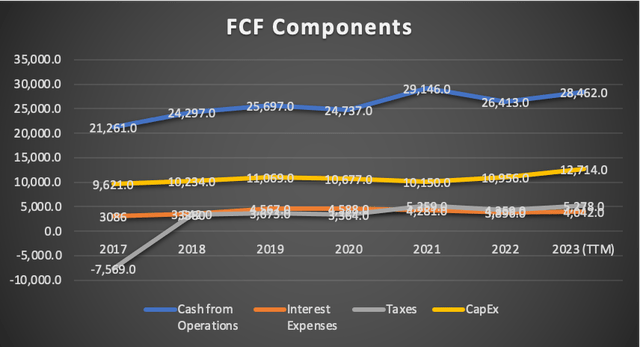
However, a decline in the free cash flow margin from 15.5% in 2021 to 12% in 2023 raises some concerns. This decrease can be attributed to Comcast’s decision to increase capital expenditure by 25% since 2021, rising from $10.1 billion to $12.7 billion as of 2023, as detailed in the “Free Cash Flow Components” table.
In summary, while Comcast is not positioned as a high-growth stock, it maintains a solid financial standing with steady performance across various metrics, despite facing challenges in a saturated market.
Valuation (In millions of USD unless stated otherwise)
In this valuation, I will conduct two DCF models to assess Comcast’s intrinsic value. The first model incorporates Analysts’ estimates for revenue and EPS in FY2023 and FY2024, along with forward revenue growth and the 3 to 5-year long-term EPS growth rate.
The second DCF model is grounded in the anticipated market revenue projections for each of Comcast’s operating segments.
The table provided contains all the current data relevant to Comcast. Utilizing this data, I will compute the WACC by considering Equity value, Debt value, and Cost of debt. Furthermore, Depreciation and Amortization (D&A), Interest, and CapEx will be derived using margins tied to revenue growth. This approach ensures that as Comcast’s revenue expands, these expenses will also increase, offering a more realistic and logical projection.
| TABLE OF ASSUMPTIONS | |
| (Current data) | |
| Assumptions Part 1 | |
| Equity Value | 82,625.00 |
| Debt Value | 102,503.00 |
| Cost of Debt | 3.94% |
| Tax Rate | 25.84% |
| 10y Treassury | 4.40% |
| Beta | 0.85 |
| Market Return | 10.50% |
| Cost of Equity | 9.59% |
| Assumptions Part 2 | |
| CapEx | 12,714.00 |
| Capex Margin | 10.52% |
| Net Income | 15,151.00 |
| Interest | 4,042.00 |
| Tax | 5,278.00 |
| D&A | 8,860.00 |
| Ebitda | 33,331.00 |
| D&A Margin | 7.33% |
| Interest Expense Margin | 3.34% |
| Revenue | 120,872.0 |
Analysts’ estimates
In this initial model, I will consider the current analysts’ estimates for Comcast. Beginning with revenue, projections for FY2023 indicate an anticipated figure of $120.69 billion, with analysts expecting a further increase to $123.51 billion for FY2024.
Annual Revenue Estimates (Seeking Alpha)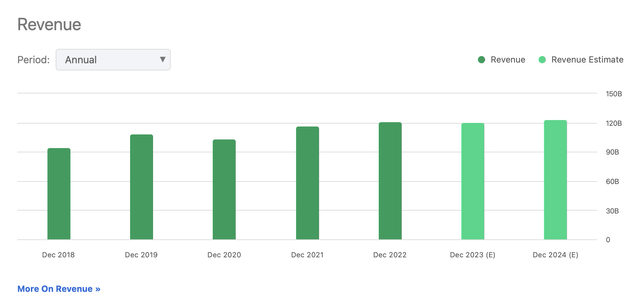
For EPS, analysts are forecasting $3.90 for FY2023 and $4.28 for FY2024. When multiplied by the total number of shares outstanding, these estimates translate into net incomes of $15.8 billion and $17.37 billion, respectively. This trajectory signifies a notable upside of 9.49% from FY2023 to FY2024, reflecting a robust high single-digit growth. Coupled with the expected revenue of $123.51 billion for FY2024, this implies a net income margin of 14%, a noteworthy increase compared to the current 12% figure for the TTM in 2023.
Annual EPS Estimates (Seeking Alpha)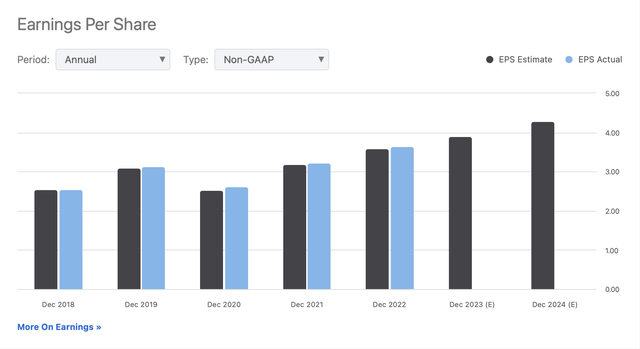
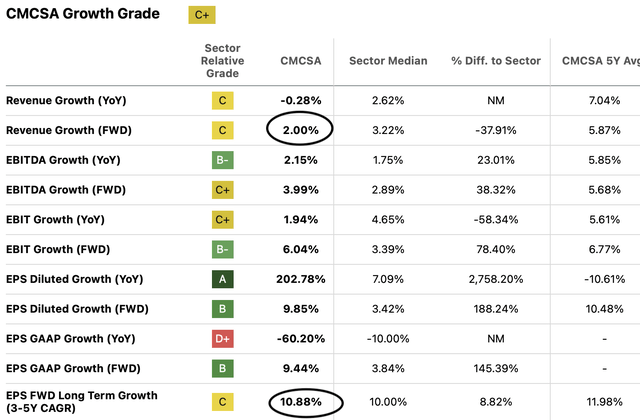
Analysts also project a forward revenue growth of 2%, which will be used to project revenues beyond FY2024. Additionally, a 3 to 5-year EPS growth rate of 10.88% is expected, providing a basis for projecting net income in the model.
| Revenue | Net Income | Plus Taxes | Plus D&A | Plus Interest | |
| 2023 | $120,700.0 | $15,828.15 | $19,917.48 | $28,764.87 | $32,801.12 |
| 2024 | $123,510.0 | $17,370.38 | $21,858.16 | $30,705.55 | $34,741.80 |
| 2025 | $125,980.2 | $19,260.28 | $24,236.33 | $33,470.76 | $37,683.58 |
| 2026 | $128,499.8 | $21,355.80 | $26,873.24 | $36,292.36 | $40,589.44 |
| 2027 | $131,069.8 | $23,679.31 | $29,797.05 | $39,404.56 | $43,787.57 |
| 2028 | $133,691.2 | $26,255.61 | $33,038.97 | $42,838.62 | $47,309.30 |
|
^Final EBITA^ |
Upon completion of the model, the result is $86.3, indicating a remarkable 105% upside from the current stock price of $42.10. Furthermore, the DCF suggests that by 2028, the stock is projected to reach a price of $148.5, representing an impressive upside of 252.8%. In other words, this implies an annual return of 50.6% over a five-year period.
My Estimates
In this second model, I will project the growth of each segment of Comcast based on the anticipated market growth rates for their respective industries.
Residential Connectivity
As specified in the overview section, the broadband market is projected to grow at a rate of 2.61%, while wireless is expected to see a growth of 3.43%. International Connectivity, represented by roaming services, is forecasted to grow at a rate of 3.9%.
| Broadband | Wireless | International Connectivity | |
| FY 2023 | 24,621.6 | 3,142.67 | 4,448.09 |
| FY 2024 | 25,264.3 | 3,250.47 | 4,621.57 |
| FY 2025 | 25,923.6 | 3,361.96 | 4,801.81 |
| FY 2026 | 26,600.3 | 3,477.27 | 4,989.08 |
| FY 2027 | 27,294.5 | 3,596.54 | 5,183.65 |
| FY 2028 | 28,006.9 | 3,719.90 | 5,385.81 |
| % of Revenue | 20.37% | 2.60% | 3.68% |
Platforms
Within this category, Peacock, Comcast’s streaming platform with a primary focus on live sports streaming, was initially expected to grow at a rate of 21.5%. However, considering the overall streaming market is projected to grow at a rate of 8.08%, I will align Peacock’s growth with this industry standard.
| Xfinity Peacock (Streaming) | Advertising | |
| FY 2023 | 29,807.0 | 4,327.22 |
| FY 2024 | 32,215.4 | 4,528.00 |
| FY 2025 | 34,818.5 | 4,738.10 |
| FY 2026 | 37,631.8 | 4,957.95 |
| FY 2027 | 40,672.4 | 5,188.00 |
| FY 2028 | 43,958.8 | 5,428.72 |
| % of Revenue | 24.66% | 3.58% |
Media
This sector, encompassing Comcast’s Pay-TV business, satellite TV, and advertising tied to TV, is anticipated to decline. The revenue of the traditional TV market is expected to decrease by an annual rate of 2.08%, encompassing both advertising and TV revenue.
| Domestic Advertising | Domestic Distribution | International Networks | |
| FY 2023 | 7,336.9 | 10,395.0 | 4,085.5 |
| FY 2024 | 7,184.3 | 10,178.8 | 4,170.5 |
| FY 2025 | 7,034.9 | 9,967.1 | 4,257.2 |
| FY 2026 | 6,888.6 | 9,759.7 | 4,345.7 |
| FY 2027 | 6,745.3 | 9,556.7 | 4,436.1 |
| FY 2028 | 6,605.0 | 9,358.0 | 4,528.4 |
| % of Revenue | 6.07% | 8.60% | 3.38% |
Business Service Connectivity, Studios & Theme Parks
For these segments, I will maintain the approach from the first model. Business service connectivity, akin to domestic connectivity, offering broadband and mobile data to companies, will grow at a rate of 10%. Studios, primarily involved in licensing content, will grow at the rate of the content licensing market, which is projected at 5.82%. Theme parks are anticipated to grow at a rate of 5.34%.
| Residential Connectivity | Platforms | Business Services Connectivity | Media | Studios (Licensing) | Theme Parks | |
| FY 2023 | 32,212.4 | 35,578.3 | 9,307.1 | 21,817.4 | 10,032.4 | 9,669.8 |
| FY 2024 | 33,149.6 | 38,187.4 | 10,237.9 | 22,687.0 | 10,624.3 | 10,172.6 |
| FY 2025 | 34,115.2 | 41,000.6 | 11,261.6 | 23,591.9 | 11,251.1 | 10,701.6 |
| FY 2026 | 35,109.9 | 44,033.7 | 12,387.8 | 24,533.6 | 11,914.9 | 11,258.0 |
| FY 2027 | 36,134.8 | 47,304.4 | 13,626.6 | 25,513.6 | 12,617.9 | 11,843.5 |
| FY 2028 | 37,190.8 | 50,831.5 | 14,989.2 | 26,533.4 | 13,362.4 | 12,459.3 |
| % of Revenue | 27.86% | 31.73% | 7.70% | 20.00% | 8.30% | 8.00% |
Revenue & Net income targets
The table below indicates that net income and revenue for FY2023 and FY2024 are lower than analysts’ estimates. For clarity, I have included the analysts’ estimate targets below the table.
| (My Estimates) | Revenue | Net Income | Plus Taxes | Plus D&A | Plus Interest |
| FY 2023 | $118,617.3 | $15,313.50 | $19,269.86 | $27,964.59 | $31,931.20 |
| FY 2024 | $125,058.8 | $16,145.09 | $20,316.31 | $29,011.04 | $32,977.64 |
| FY 2025 | $131,922.0 | $17,031.13 | $21,431.26 | $31,101.23 | $35,512.75 |
| FY 2026 | $139,238.1 | $17,975.63 | $22,619.79 | $32,826.03 | $37,482.20 |
| FY 2027 | $147,040.8 | $18,982.97 | $23,887.37 | $34,665.56 | $39,582.66 |
| FY 2028 | $155,366.6 | $20,057.83 | $25,239.94 | $36,628.42 | $41,823.93 |
| ^Final EBITA^ |
| Analysts’ Estimates | Revenue | Net Income | Plus Taxes | Plus D&A | Plus Interest |
| 2023 | $120,700.0 | $15,828.15 | $19,917.48 | $28,764.87 | $32,801.12 |
| 2024 | $123,510.0 | $17,370.38 | $21,858.16 | $30,705.55 | $34,741.80 |
| 2025 | $125,980.2 | $19,260.28 | $24,236.33 | $33,470.76 | $37,683.58 |
| 2026 | $128,499.8 | $21,355.80 | $26,873.24 | $36,292.36 | $40,589.44 |
| 2027 | $131,069.8 | $23,679.31 | $29,797.05 | $39,404.56 | $43,787.57 |
| 2028 | $133,691.2 | $26,255.61 | $33,038.97 | $42,838.62 | $47,309.30 |
| ^Final EBITA^ |
Despite the variance, this model suggests that Comcast still presents a significant upside of 51%, projecting the stock to reach $63.60, up from the current stock price of $42.10. Additionally, the model forecasts a future stock price of $116.10, indicating annual returns of 35.1% over a 5-year period from the current stock price.
Risks to Thesis
I can identify three risks associated with this thesis. The first risk pertains to Comcast’s balance sheet, where the company’s stance on substantial cash reserves and low debt is not as pronounced. There is a possibility that Comcast might initiate extensive buyback programs, leading to short-term gains but potential long-term challenges.
The second risk is tied to market dynamics, as Comcast operates in a saturated environment, with 27.86% of its revenue derived from broadband, mobile data, and roaming. Additionally, Peacock’s remarkable growth in recent quarters could be jeopardized if competitors, such as Netflix, enter the live-sports streaming space. This scenario is not far-fetched, considering Disney’s move in a similar direction with Hulu.
The third and final risk concerns free cash flow. In the absence of significant revenue growth, the alternative route to enhancing stock value is by increasing free cash flow generation. This would necessitate Comcast to become more operationally efficient, an area where the company has encountered challenges in the past five years.
Considering these factors, I am assigning a $63.60 stock price target to Comcast, accompanied by a “Strong Buy” rating. This valuation takes into account the risks outlined above and reflects a comprehensive assessment of Comcast’s current standing and potential for future growth.
Conclusion
In conclusion, Comcast Corporation emerges as a compelling investment opportunity, despite operating in a saturated telecommunications market. The thorough analysis conducted, encompassing multiple DCF models and segment-specific growth projections, sheds light on Comcast’s resilience and potential for substantial returns. Notably, the first DCF model, rooted in analysts’ estimates, suggests a noteworthy upside of 105%, with a future stock price of $86.3. The second model, incorporating market growth projections for individual segments, maintains an impressive 51% upside, setting a stock price target of $63.60. Amidst these insights, a “Strong Buy” rating is confidently attached to Comcast, acknowledging its robust financial performance, strategic positioning in various sectors, and the anticipation of future growth.
This optimism is not without awareness of potential risks, such as concerns about Comcast’s balance sheet, market saturation, and the need for enhanced operational efficiency. However, with a keen eye on these challenges, the assigned stock price target of $63.60 reflects a belief in Comcast’s capacity to navigate and overcome these obstacles.
Analyst’s Disclosure: I/we have no stock, option or similar derivative position in any of the companies mentioned, but may initiate a beneficial Long position through a purchase of the stock, or the purchase of call options or similar derivatives in CMCSA over the next 72 hours. I wrote this article myself, and it expresses my own opinions. I am not receiving compensation for it (other than from Seeking Alpha). I have no business relationship with any company whose stock is mentioned in this article.
Seeking Alpha’s Disclosure: Past performance is no guarantee of future results. No recommendation or advice is being given as to whether any investment is suitable for a particular investor. Any views or opinions expressed above may not reflect those of Seeking Alpha as a whole. Seeking Alpha is not a licensed securities dealer, broker or US investment adviser or investment bank. Our analysts are third party authors that include both professional investors and individual investors who may not be licensed or certified by any institute or regulatory body.

