Summary:
- Danaher’s earnings have had three great years on the back of COVID-related demand.
- That demand should wane over the next two years.
- This will likely place pressure on the stock price. Investors who would like to avoid this sort of downside would be wise to take profits.
NicoElNino
Introduction
I always like to start my articles by reviewing any coverage I’ve had of a stock in the past. In the case of Danaher (NYSE:DHR), on October 20th, 2021, I wrote a “Sell” article titled “Taking Profits In Danaher Is Reasonable Here” in which I made the case that Danaher stock was overvalued and therefore likely to produce poor returns over the medium-term. Here is how the stock has performed since that article:
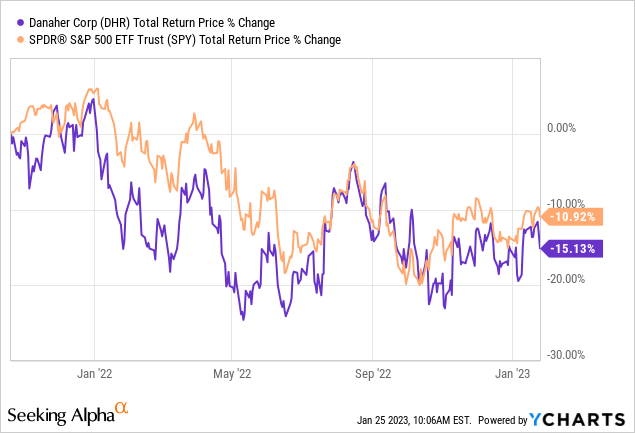
It often takes two or three years for a valuation thesis to play out. Lots of things can drive a stock price over the short term, but longer term, earnings play a greater and greater role. Since that article, DHR is down about -15%, a little more than the S&P 500.
Last quarter, on October 24th, 2022, I published a second “Sell” article on DHR titled “Danaher Stock Has Serious Boom/Bust Risk“. In that article, I highlighted the unsustainable boost in earnings DHR had in 2020 and 2021, and how that was likely to reverse over the next year or two. Here is how the stock has performed since then.
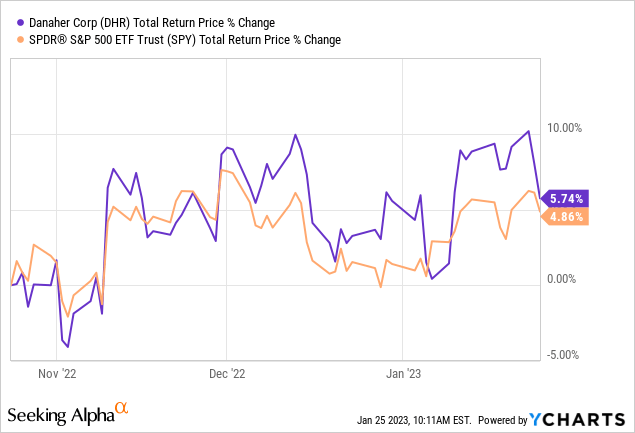
It has been up about 5%, roughly in line with the S&P 500. (Though, after yesterday’s earnings, the stock price is down a little bit).
In this article, I am going to share an updated analysis using the same technique that controls for the recent COVID boom that I used in my last article, except now I will be looking forward to 2024. There are a couple of reasons for this. The first is, as I noted earlier, it can sometimes take a few years for a valuation thesis to play out. My view, as you will see, is that 2020 and 2021 were essentially unsustainable “boom” years for DHR, and 2022 was likely the plateau at the top. I expect it will take a couple of years for the “bust” to be reflected in earnings and for DHR to resume its traditional earnings growth trend.
The market and financial media like to focus on quarterly expectations, but the truth is that quarterly earnings don’t have a lot of predictive power when it comes to the stock price. What we really should focus on, when we can, is what earnings will look like two years from now because that is much more likely to affect the stock price over the next year or two. So, I will be highlighting some of the changes in analysts’ expectations over the past year or two, with a focus on 2023 and 2024.
With that, let’s get into the analysis. I will first share a standard analysis so if you disagree with my boom/bust thesis, there will be a valuation we can use as a baseline. And then I’ll share the adjustments I’m making for the pandemic boom/bust after that.
My Valuation Method For Danaher
The valuation method I use for Danaher first checks to see how cyclical earnings have been historically. Once it is determined that earnings aren’t too cyclical, then I use a combination of earnings, earnings growth, and P/E mean reversion to estimate future returns based on previous earnings growth and sentiment patterns. I take those expectations and apply them 10 years into the future, and then convert the results into an expected CAGR percentage. If the expected return is really good, I will buy the stock, and if it’s really low, I will often sell the stock. In this article, I will take readers through each step of this process.
Importantly, once it is established that a business has a long history of relatively stable and predictable earnings growth, it doesn’t really matter to me what the business does. If it consistently makes more money over the course of each economic cycle, that’s what I care about – numbers over stories.
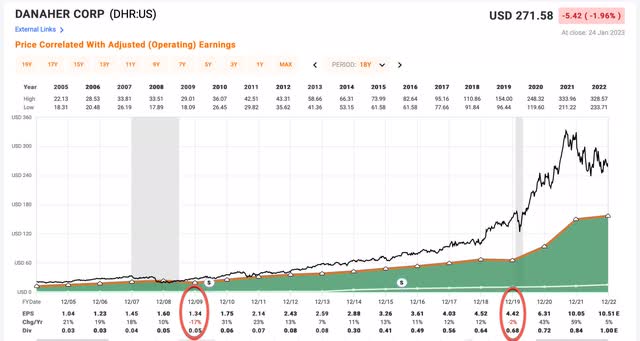
Since 2004, Danaher has only experienced two years of negative EPS growth, once in 2009, when EPS fell -17%, and again in 2019 when it fell -2%. I would classify this as a low-to-moderately cyclical business. Based on that, it is appropriate to use a fundamental analysis using earnings to value the stock, and that’s what I’ll do in this article. (If earnings had been more cyclical, I would’ve used a different valuation technique).
Danaher Stock – Market Sentiment Return Expectations
In order to estimate what sort of returns we might expect over the next 10 years, let’s begin by examining what return we could expect 10 years from now if the P/E multiple were to revert to its mean from the previous economic cycle. For this, I’m using a period that runs from 2015-2022.
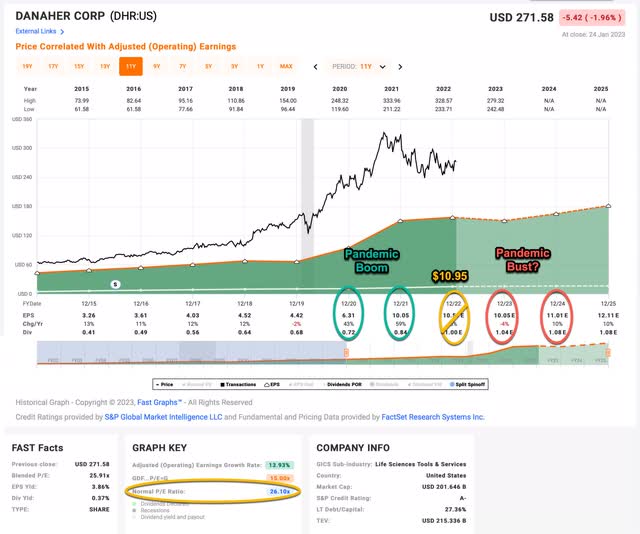
Danaher’s average P/E from 2015 to the present has been about 26.10 (the blue number circled in gold near the bottom of the FAST Graph). Using 2022 earnings of $10.95 Danaher has a current P/E of 24.80. If that 24.80 P/E were to revert to the average P/E of 26.10 over the course of the next 10 years and everything else was held the same, DHRs price would rise and it would produce a 10-Year CAGR of +0.51%. That’s the annual return we can expect from sentiment mean reversion if it takes 10 years to revert. If it takes less time to revert, the return would be higher.
Business Earnings Expectations
We previously examined what would happen if market sentiment reverted to the mean. This is entirely determined by the mood of the market and is quite often disconnected, or only loosely connected, to the performance of the actual business. In this section, we will examine the actual earnings of the business. The goal here is simple: We want to know how much money we would earn (expressed in the form of a CAGR %) over the course of 10 years if we bought the business at today’s prices and kept all of the earnings for ourselves.
There are two main components of this: the first is the earnings yield and the second is the rate at which the earnings can be expected to grow. Let’s start with the earnings yield (which is an inverted P/E ratio, so the Earnings/Price ratio). The current earnings yield is about +4.14%. The way I like to think about this is, if I bought the company’s whole business right now for $100, I would earn $4.14 per year on my investment if earnings remained the same for the next 10 years.
The next step is to estimate the company’s earnings growth during this time period. I do that by figuring out at what rate earnings grew during the last cycle and applying that rate to the next 10 years. This involves calculating the historical EPS growth rate, taking into account each year’s EPS growth or decline, and then backing out any share buybacks that occurred over that time period (because reducing shares will increase the EPS due to fewer shares).
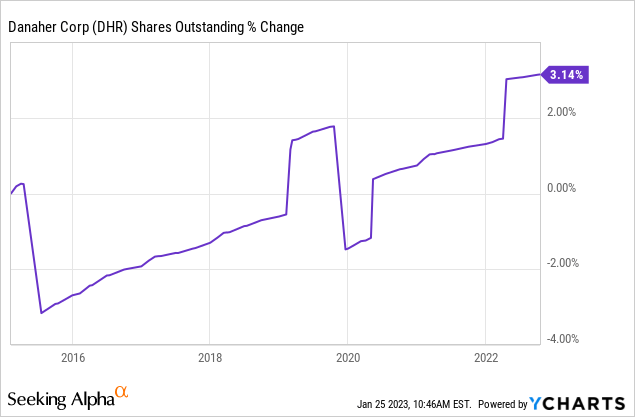
Danaher’s shares outstanding have actually risen over this time period, so we don’t need to make any adjustments for those. I get an estimated earnings growth rate for Danaher during this period of +17.28%, which is extremely good.
Next, I’ll apply that growth rate to current earnings, looking forward 10 years in order to get a final 10-year CAGR estimate. The way I think about this is, if I bought Danaher’s whole business for $100, it would pay me back $4.14 plus +17.28% growth the first year, and that amount would grow at +17.28% per year for 10 years after that. I want to know how much money I would have in total at the end of 10 years on my $100 investment, which I calculate to be about $210.22 including the original $100. When I plug that growth into a CAGR calculator, that translates to a +7.71% 10-year CAGR estimate for the expected business earnings returns.
10-Year, Full-Cycle CAGR Estimate
Potential future returns can come from two main places: market sentiment returns or business earnings returns. If we assume that market sentiment reverts to the mean from the last cycle over the next 10 years for Danaher, it will produce a +0.51% CAGR. If the earnings yield and growth are similar to the last cycle, the company should produce somewhere around a +7.71% 10-year CAGR. If we put the two together, we get an expected 10-year, full-cycle CAGR of +8.22% at today’s price.
My Buy/Sell/Hold range for this category of stocks is: above a 12% CAGR is a Buy, below a 4% expected CAGR is a Sell, and in between 4% and 12% is a Hold. An +8.22% expected CAGR is right in the middle of the “Hold” range, and what I would consider “fair value”. So, just looking at the basic history of Danaher’s earnings, today’s price is right around where a person should expect it to trade.
However, I think it’s reasonable to think these estimates might be too optimistic. Danaher benefitted greatly during 2020 and 2021 when pandemic stimulus money was being pumped into the economy and the pandemic was raging around the globe. It’s highly likely that when the stimulus and pandemic have fully ended in 2023 that Danaher’s earnings, along with the wider economy, will suffer. So, in the next section, I will make some adjustments for this likelihood. These adjustments are what I’m actually using myself, and what will guide my potential purchase price of Danaher stock.
Pandemic Boom/Bust Adjustments
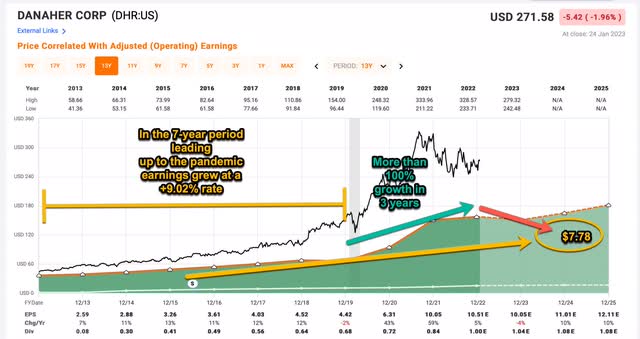
In the 7 years leading up to 2020, Danaher’s earnings growth was about 9%. Then in 2020 earnings grew 43% and in 2021 earnings grew another 59%. Now, at the end of 2022, Danaher’s earnings have come in at a level more than double what they were in 2019. I think it’s reasonable to assume earnings will fall back down to the previous trend over the next two years since the pandemic and stimulus will have ended and we will likely be entering a recession.
I’ll premise this by saying this is just meant to be a rough guide, particularly if the market should happen to overshoot the stock price to the downside at some point over the next couple of years. I use it to have some sort of guideline of where it might make sense to buy this stock with a margin of safety.
What I have done is model out what Danaher’s earnings would have been if the pre-pandemic trend would have continued from 2019 for five years into 2024, and then I assume earnings fall to that level in 2024. I’ve included three years with an extra 5% inflation addition as well for 2020, 2021, and 2022, since some of that stimulus money is here in the economy to stay. Then in 2023 and 2024, I assume the historical 9% earnings growth rate will resume. I think this is pretty generous because I am not factoring in the effects of a potential recession at all here. Doing this, my rough approximation for 2024 earnings is $7.78, and if I assume a steady decline from this year’s peak of $10.95 per share, then the midpoint of these numbers is $9.37. That would be my ballpark figure for this year’s EPS.
When I take $9.37 in earnings for this year and pull it forward, then use a 9.02% earnings growth rate assumption, using the same valuation technique I shared earlier in the article, I get a +3.94% 10-year CAGR expectation. This is right on the edge of my 4% sell threshold, so I would still rate Danaher stock a “Sell” today. Usually, when earnings change direction like I expect them to do, stocks tend to overshoot to the downside, especially if the decline occurs for more than one year.
Interestingly, I think management provided a “tell” in their earnings press release that they are in agreement with my general thesis here (emphasis mine):
Revenues increased 2.5% year-over-year in the fourth quarter of 2022 to $8.4 billion. Non-GAAP core revenue growth was 7.5%, including 7.5% non-GAAP base business core revenue growth…
… starting with the first quarter 2023, the Company will revise its definition of base business core growth to exclude revenues related to COVID-19 testing, vaccines and therapeutics, in addition to the exclusion of currency translation, acquisitions and divested product lines.
I had to shake my head and laugh when I read this. It’s funny that when revenues are booming due to COVID they count as “base business core growth”, but when the boom turns to bust, now all of the sudden those revenue declines no longer count.
I suggest just using the unadjusted revenues for the real story, which only rose 2.5% year over year. They are essentially topping out. All else being equal, I would expect revenues to decline somewhere around 3% to 4% per quarter for the next eight quarters. Obviously, it will likely be much lumpier than that, but I think it will be a decent guide for what to expect.
As it stands, my estimates of 9% earnings growth that I used both in my previous article and this article, are similar to what management is now guiding for 2023’s core base business (ex-COVID):
Now for the full year 2023. We expect high single-digit core growth in our base business.
Effectively what I did in my last article was to make the adjustments that management is making now, only I applied them 3 years ago before the boom, and to also attempt to take into account the extra inflation we’ve had nationwide.
Conclusion
Putting all this together, using a medium-term time-frame of 2-5 years, I think at any price over about $265, this stock is a sell this year. The midpoint of what I would consider “fair value” is about $200. And I would consider buying the stock with a margin of safety if it fell below $154 per share, assuming earnings haven’t fallen below my $7.78 per share 2024 expectation.
Disclosure: I/we have no stock, option or similar derivative position in any of the companies mentioned, and no plans to initiate any such positions within the next 72 hours. I wrote this article myself, and it expresses my own opinions. I am not receiving compensation for it (other than from Seeking Alpha). I have no business relationship with any company whose stock is mentioned in this article.
If you have found my strategies interesting, useful, or profitable, consider supporting my continued research by joining the Cyclical Investor’s Club. It’s only $30/month, and it’s where I share my latest research and exclusive small-and-midcap ideas. Two-week trials are free.

