Summary:
- Versatile Industry Player: Micron Technology demonstrates adaptability and resilience in the dynamic memory and storage solutions market.
- Diversified Business Units: The Compute and Networking, Mobile, Embedded, and Storage units create a well-diversified portfolio, positioning Micron strategically across key markets.
- Financial Metrics Insight: A thorough financial metrics analysis unveils challenges and opportunities, providing a nuanced view of Micron’s financial standing and growth potential.
- Strategic Resilience: Micron, despite industry seasonality and the semiconductor cycle, maintains a historical upward trajectory, showcasing resilience and strategic navigation.
- Optimistic Outlook with “Buy” Rating: The fair price of $122.1, coupled with the lowest target of $88.8, supports a “buy” rating, aligning with an optimistic projection for Micron’s sustained success in the memory and storage solutions domain.
vzphotos
Thesis
Micron Technology, Inc. (NASDAQ:MU) stands out as one of the most cyclical stocks I’ve encountered, exhibiting significant fluctuations during market expansions and contractions. However, since December 30, 2022, coinciding with the 2023 market rally, the stock has surged by approximately 73%. In this analysis, I will illustrate, using valuation models, why Micron is currently undervalued and presents further potential for growth.
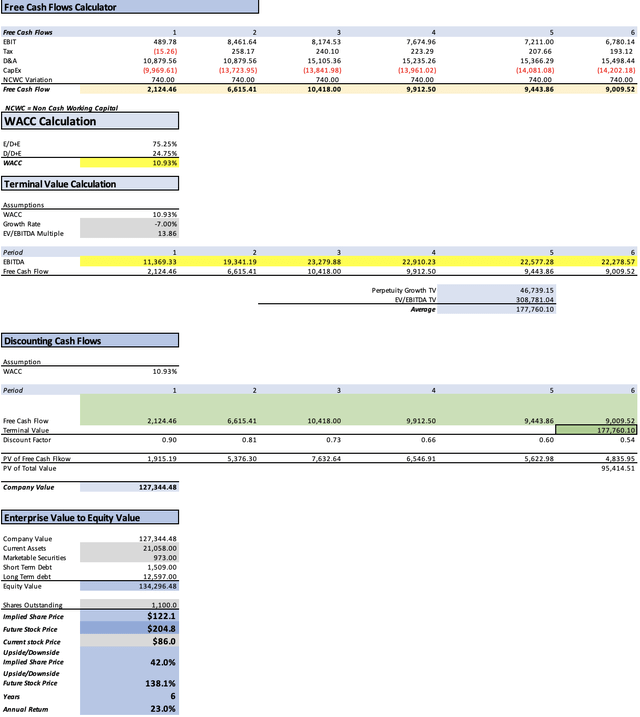
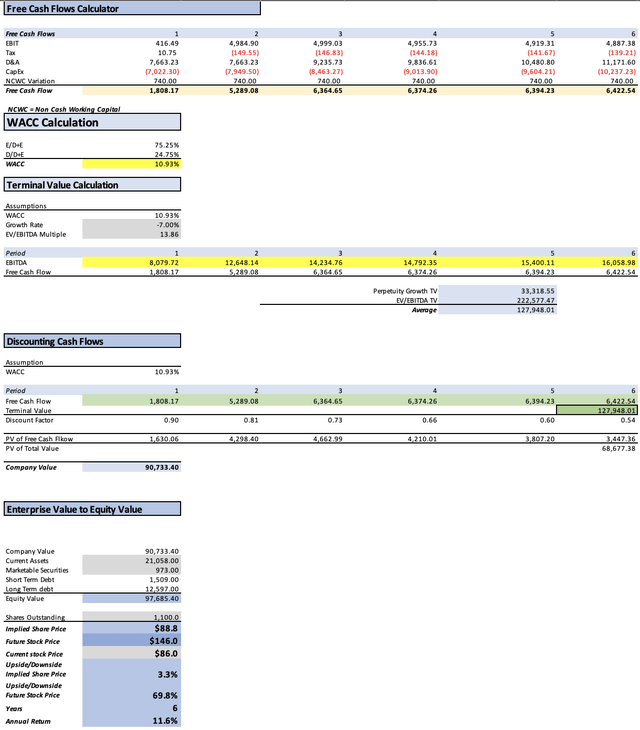
Upon completing the two valuation models, the first yielded a fair price per share of approximately $122.1, while the second model suggested a price of $88 per share. Despite the variance in these results, I maintain a positive outlook on the stock and recommend it as a “buy” based on its current undervaluation and potential upside.
Overview
FQ1 2024 Earnings Report Analysis
Micron exceeded earnings estimates by $0.06, amounting to a substantial $66 million increase when multiplied by the total outstanding shares. Furthermore, the company outperformed revenue estimates by an even more significant margin, surpassing expectations by $100 million. Despite these positive aspects, Micron reported a quarter loss of -$0.95 per share, totaling -$1.04 billion.
Challenges and Troubles Ahead
The primary challenge for Micron stemmed from the harsh impact of plummeting memory prices in 2023. This decline was a consequence of excessive inventories and a demand shortfall that failed to match the abundant supply. Consequently, many memory manufacturers had to scale back their sales. However, a positive shift is on the horizon as numerous companies have responded by curtailing production, aiming to restore balance to the oversaturated market. This strategic reduction in supply is expected to pave the way for an eventual increase in memory prices.
Company Overview
As of Q1 2024, Micron is actively engaged in the networking, mobile, embedded, and well-established storage sectors. While a superficial examination might indicate that storage is not the largest contributor to Micron’s revenue, nor the fastest-growing segment, it’s crucial to clarify that the “Storage” segment does not solely represent where Micron sells its memory products; instead, it spans across all company segments. A comprehensive review of Micron’s 10-K reveals that the core focus across all segments lies in selling memory units. The strategic positioning and diversified engagement across various sectors underscore Micron’s resilience and adaptability in navigating the complex memory market landscape.
Micron Investors’ Presentation
Market
Networking
The Compute and Networking Business Unit is dedicated to providing a range of memory products and solutions tailored for diverse markets. The primary product offerings include DRAM products. This segment serves sectors, including client, cloud server, enterprise, graphics, and networking.
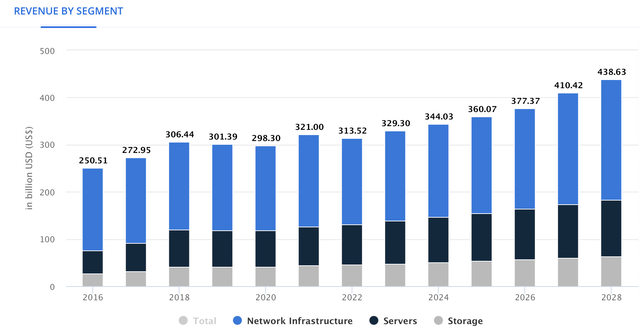
Networking involves the connection of numerous users to servers. It can be classified into enterprise and embedded. The latter pertains to the equipment essential for constructing an enterprise network, which serves as the platform through which employees connect to access company data or programs. Notably, the “Networking Infrastructure” within the data center market is anticipated to experience a Compound Annual Growth Rate [CAGR] of approximately 6.87% until the year 2028.
Mobile
In the mobile domain, the Mobile Business Unit focuses on delivering memory and storage solutions optimized for the mobile market. Key products encompass LPDDR4, LPDDR5 DRAM, discrete NAND, and managed NAND solutions, addressing the growing demand for 5G-enabled devices.
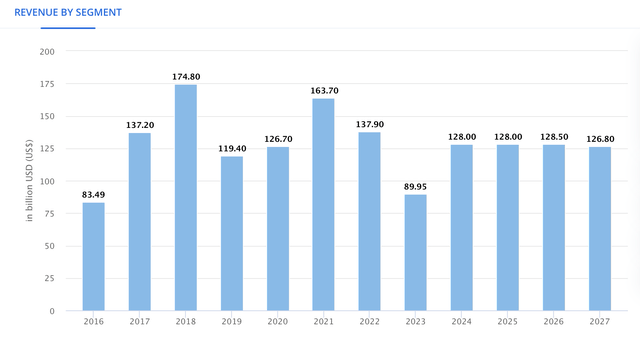
Since I couldn’t find forecasts for this specific segment, I will project it using the forecast of the worldwide memory integrated circuits which indicate that the market is poised for robust growth, with an anticipated rate of 8.96% extending through the year 2027.
Embedded
The Embedded Business Unit specializes in memory and storage solutions for automotive, industrial, and consumer markets. Its diverse product portfolio includes DDR and LPDDR DRAM, NAND, managed NAND, SSDs, and NOR, meeting the escalating requirements of connected and digitized devices in the Internet of Things [IoT].
This segment encompasses Micron’s sales of CPUs and GPUs to individuals and PC brands. The microprocessor and GPU market is anticipated to grow at a rate of 2.9% through 2030.
Author’s Calculations based on Yahoo Finance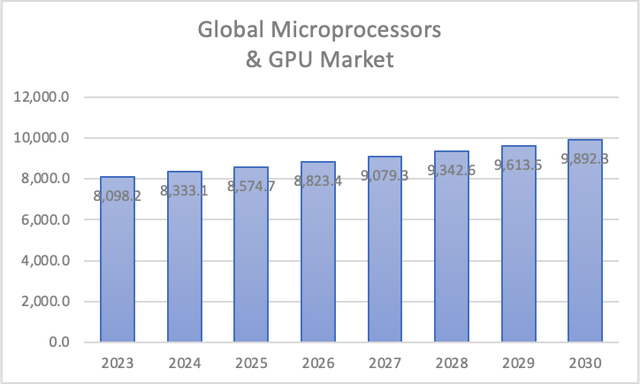
Storage
The Storage Business Unit focuses on SSDs and component-level solutions across enterprise, cloud, client, and consumer storage markets. Notably, SBU’s product focus includes SSDs featuring NAND technology with layers ranging from 176 to 232, catering to the distinct needs of enterprise and cloud, client, and consumer applications. Additionally, SBU engages in the sale of NAND components with varying layer technologies.
As highlighted in the table at the outset of this section, Micron provides both cloud-based solutions through servers and non-cloud solutions utilizing SSDs and HDDs.
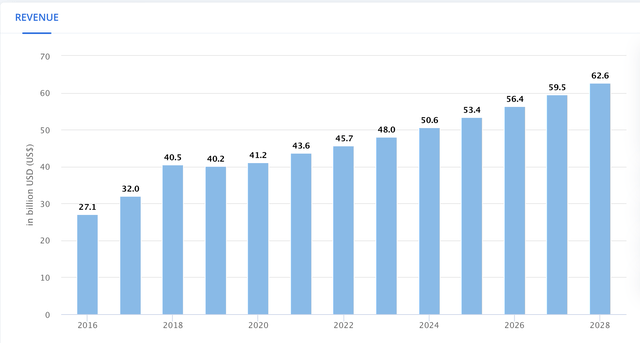
Projections indicate that the global storage market is set to experience revenue growth at a rate of 5.46%.
Financials
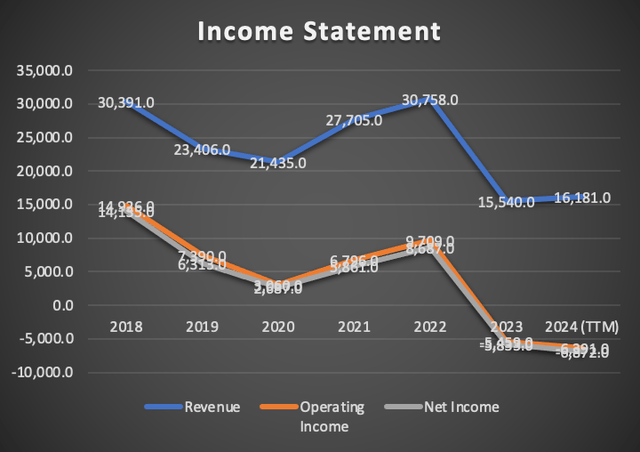
Micron’s financial trajectory has taken a negative turn, notably since 2018, with a discernible -7.8% decrease in revenue growth. Operating income and net income have also experienced substantial declines, contracting at rates of -23.8% and -24.8%, respectively.
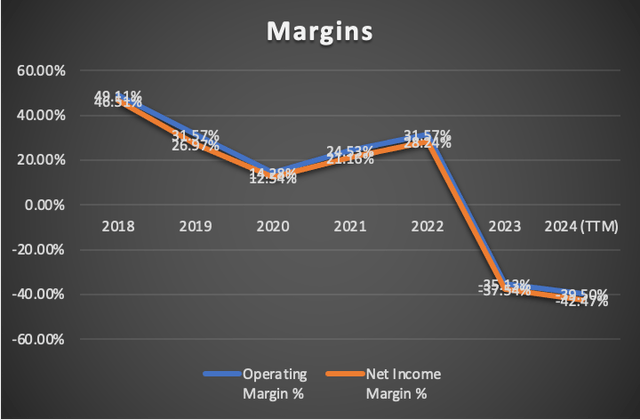
The deterioration extends to the margins, where the operating margin, once robust at 49.11% in 2018, has plummeted to -39.5%. Similarly, the net income margin has seen a significant decrease, falling from 46.51% in 2018 to the current -42%. These stark declines underscore the challenges Micron has faced in maintaining profitability.
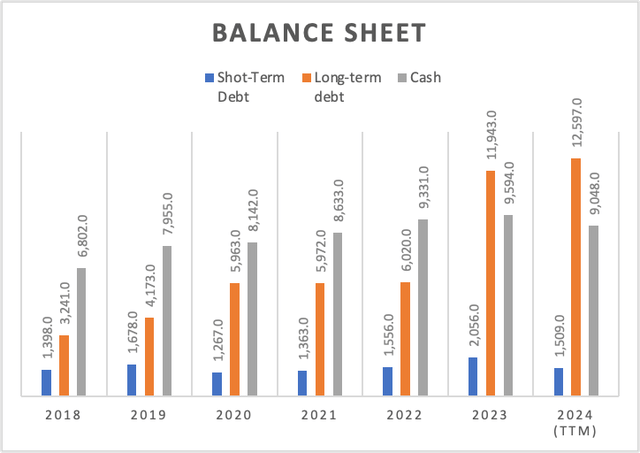
This downward trend has inevitably impacted the balance sheet. In 2018, Micron possessed sufficient resources to cover its total debt load, but the current scenario depicts a shift. With a cash balance of $9 billion and a total debt standing at $14.1 billion, Micron now faces a deficit. While the situation is not dire, with other companies facing more significant challenges, it underscores the need for strategic financial management.
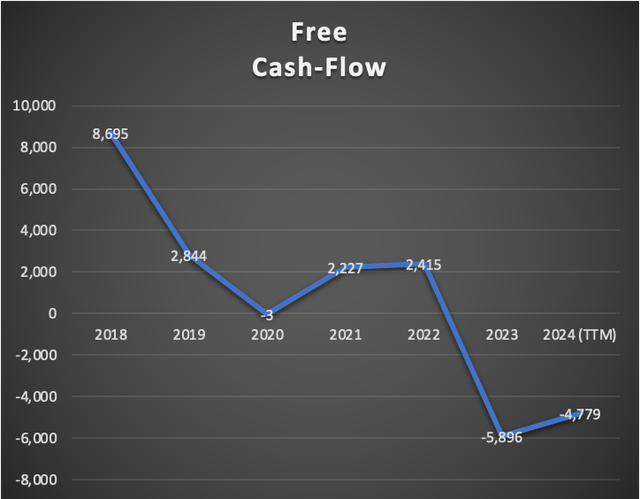
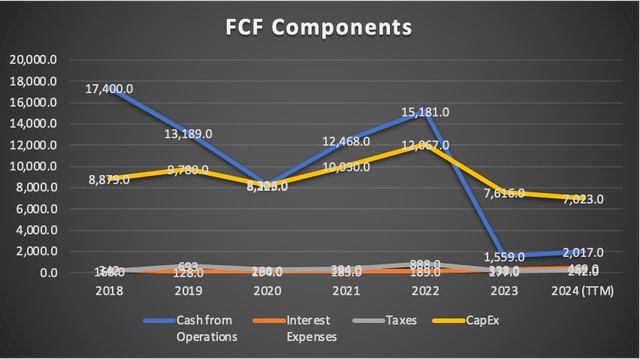
Furthermore, the free cash flow, a critical indicator of financial health, has turned negative, standing at -$4.7 billion, a stark contrast to the positive $8.6 billion observed in 2018. The pivotal year was 2023 when Micron’s revenue contracted by almost 50%, initiating a shift in the company’s financial trajectory.
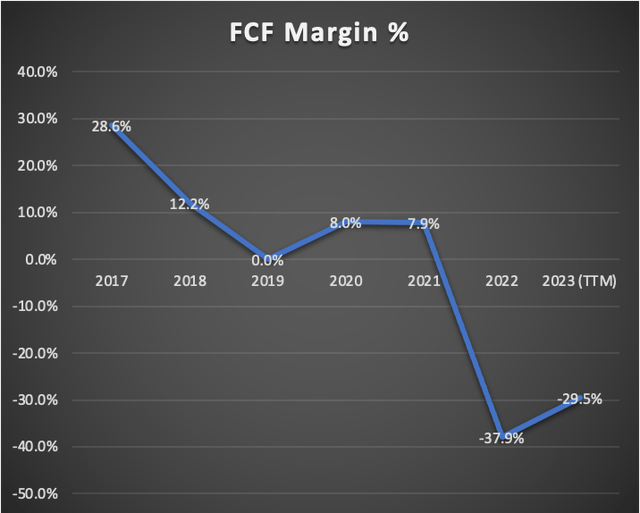
This decline has inevitably impacted the Free Cash Flow [FCF] margin, dropping from 28.6% in 2018 to the current -29.5%. A closer look at the “FCF components” table reveals that the reduction in cash flow is closely linked to the decrease in revenue, with the variable affected being cash from operations. The data suggests a need for Micron to address the core issues affecting revenue generation to stabilize its financial position and improve cash flow metrics.
Valuation
In this valuation analysis, I will employ two Discounted Cash Flow [DCF] models to gauge Micron’s intrinsic value. The first model integrates Analysts’ estimates for revenue and EPS in FY2024 and FY2025, alongside forward revenue growth and the 3 to 5-year long-term EPS growth rate.
The second DCF model is rooted in the anticipated market revenue projections for each of Micron’s operating segments.
A crucial clarification pertains to the tax strategy beyond FY2024. Micron is slated to pay a tax rate of 10.22%, grounded in the tax and revenue benchmarks from 2022. This strategic decision aligns with the company’s anticipated exit from negative net income, rendering it ineligible for substantial tax benefits and mandating larger tax contributions.
The provided table encapsulates all current data pertinent to Micron. Using this data, I will calculate the Weighted Average Cost of Capital [WACC] by factoring in Equity value, Debt value, and Cost of debt. Additionally, Depreciation and Amortization (D&A), Interest, and Capital Expenditures [CapEx] will be computed based on margins linked to revenue growth. This method ensures that as Micron’s revenue expands, these expenses will also increase, providing a more pragmatic and coherent projection.
| TABLE OF ASSUMPTIONS | |
| (Current data) | |
| Assumptions Part 1 | |
| Equity Value | 42,885.00 |
| Debt Value | 14,106.00 |
| Cost of Debt | 3.32% |
| Tax Rate | -3.65% |
| 10y Treassury | 3.90% |
| Beta | 1.45 |
| Market Return | 10.50% |
| Cost of Equity | 13.47% |
| Assumptions Part 2 | |
| CapEx | 7,023.00 |
| Capex Margin | 43.40% |
| Net Income | -6,872.00 |
| Interest | 469.00 |
| Tax | 242.00 |
| D&A | 7,664.00 |
| Ebitda | 1,503.00 |
| D&A Margin | 47.36% |
| Interest Expense Margin | 2.90% |
| Revenue | 16,181.0 |
Analysts’ Estimates
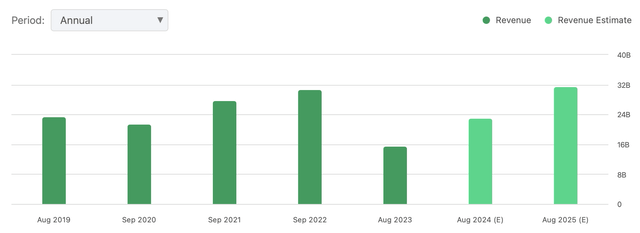
In this preliminary model, I will evaluate Micron based on current analyst estimates. Commencing with revenue, FY2025 projections indicate an expected figure of $22.97 billion, with analysts anticipating a subsequent increase to $31.62 billion for FY2025.
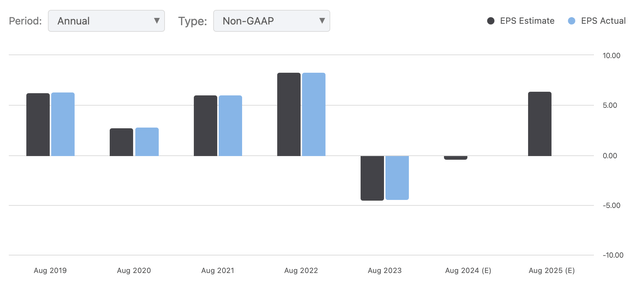
For EPS, forecasts are set at -$0.38 for FY2024 and $6.43 for FY2025. When multiplied by the total number of shares outstanding, these estimates result in net incomes of -$418 million and $7 billion, respectively. This signals a significant upside of around 105% from FY2024 to FY2025.
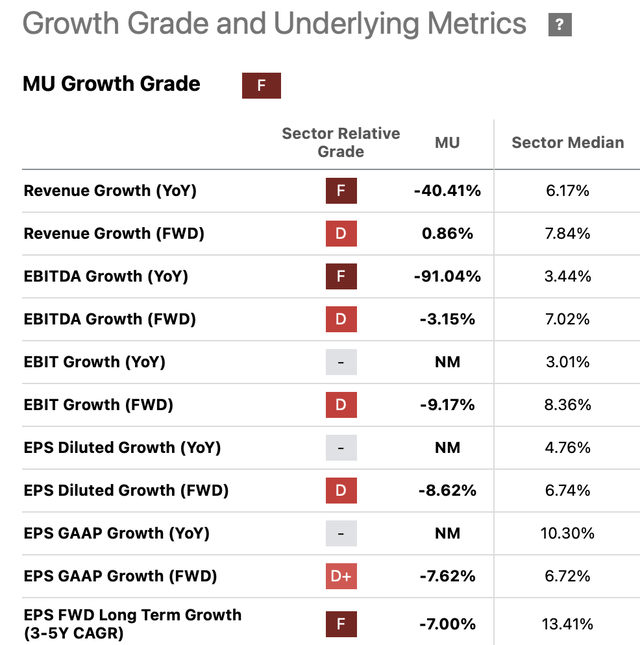
Analysts also project a forward revenue growth of 0.86%, which will serve as the basis for projecting revenues beyond FY2025. Additionally, a 3 to 5-year EPS growth rate of -7% is expected, providing a foundation for projecting net income in the model.
| Revenue | Net Income | Plus Taxes | Plus D&A | Plus Interest | |
| 2024 | $22,970.0 | -$418.00 | -$176.00 | $10,703.56 | $11,369.33 |
| 2025 | $31,620.0 | $7,073.00 | $7,795.86 | $18,675.42 | $19,341.19 |
| 2026 | $31,891.9 | $6,577.89 | $7,250.15 | $22,355.51 | $23,279.88 |
| 2027 | $32,166.2 | $6,117.44 | $6,742.64 | $21,977.90 | $22,910.23 |
| 2028 | $32,442.8 | $5,689.22 | $6,270.66 | $21,636.94 | $22,577.28 |
| 2029 | $32,721.8 | $5,290.97 | $5,831.71 | $21,330.14 | $22,278.57 |
| ^Final EBITA^ |
Analyzing the data, it becomes evident that analysts’ estimates point to a present fair price of $122.1, translating to a promising 42% upside from the current stock price of $86. Looking ahead to FY2029, the model suggests that the stock should be valued at $204.8, indicating an attractive annual return of 23%.
My Estimates
As mentioned earlier, in this second valuation model, I will project each of Micron’s segments based on their respective market growth rates. Specifically, Broadband is anticipated to grow at 2.28%, Networking at 6.87%, Memory Integrated Circuits at 8.96% (which will replace mobile storage components), Embedded at 2.9% and Storage at 5.46%.
| Networking | Wireless | Embedded | Storage | |
| FY2023 | 5,954.6 | 4,432.0 | 3,555.0 | 2,237.8 |
| FY2024 | 6,363.7 | 4,829.1 | 3,658.1 | 2,360.0 |
| FY2025 | 6,800.9 | 5,261.8 | 3,764.1 | 2,488.9 |
| FY2026 | 7,268.1 | 5,733.2 | 3,873.3 | 2,624.8 |
| FY2027 | 7,767.4 | 6,246.9 | 3,985.6 | 2,768.1 |
| FY2028 | 8,301.0 | 6,806.6 | 4,101.2 | 2,919.2 |
| FY2029 | 8,871.3 | 7,416.5 | 4,220.1 | 3,078.6 |
| % ofRevenue | 36.80% | 27.39% | 21.97% | 13.83% |
Moving on to the next phase, I will leverage the net income margins anticipated by analysts. These figures can be derived by dividing net income by the revenue, as displayed in the estimates table from the prior valuation model.
| Net IncomeMargins ExpectedBy Analysts | |
| 2024 | -1.82% |
| 2025 | 22.37% |
| 2026 | 20.63% |
| 2027 | 19.02% |
| 2028 | 17.54% |
| 2029 |
16.17% |
| Revenue | Net Income | Plus Taxes | Plus D&A | Plus Interest | |
| FY 2024 | $16,179.4 | -$294.46 | -$52.46 | $7,610.77 | $8,079.72 |
| FY 2025 | $18,315.7 | $4,097.21 | $4,515.95 | $12,179.18 | $12,648.14 |
| FY 2026 | $19,499.4 | $4,022.72 | $4,433.85 | $13,669.57 | $14,234.76 |
| FY 2027 | $20,768.0 | $3,950.08 | $4,353.78 | $14,190.39 | $14,792.35 |
| FY 2028 | $22,128.1 | $3,881.27 | $4,277.94 | $14,758.73 | $15,400.11 |
| FY 2029 | $23,586.6 | $3,813.95 | $4,203.74 | $15,375.33 | $16,058.98 |
| ^Final EBITA^ |
This approach yields results that are generally more conservative than analysts’ expectations, serving the purpose of calculating a potential downside for Micron. My estimates indicate values considerably lower than what analysts anticipate. In this instance, the model suggests that Micron is nearly fairly valued, implying a modest 3.3% upside from the current stock price of $86. Nonetheless, the model forecasts that Micron will deliver annual returns of 11.6% over the next six years, culminating in a stock price of $146 in FY2029.
Risks to Thesis
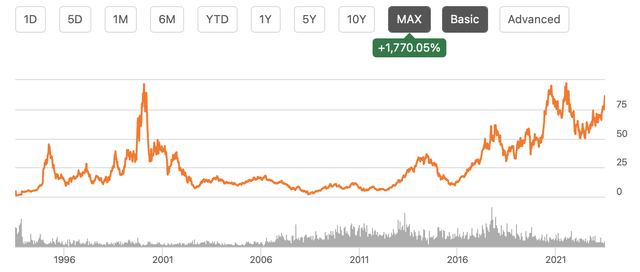
The primary risk factor for Micron revolves around its susceptibility to seasonality and the pronounced impact of the semiconductor cycle. A glance at the stock graph illustrates Micron’s tendency to experience rapid growth when clients necessitate equipment replacement, followed by substantial declines when client demand wanes. Despite this cyclicality, the overall trajectory has been upward. The challenge with Micron lies in timing entry points, and avoiding peaks to optimize investment returns.
This cyclical pattern has persisted over time, showcasing its prevalence even before the dot-com bubble and well beyond the 2008 recession. Notably, during market bubbles, a stock that is already ascending tends to rise even further before experiencing more substantial declines.
The second risk inherent in this business model is the imperative need for sustained competitiveness. Micron operates in a competitive landscape where other companies are also engaged in manufacturing storage components and contributing to data centers. In this scenario, maintaining a robust balance sheet becomes crucial to navigate and thrive in market wars. Micron must strategically position itself to withstand industry competition and technological shifts to secure its foothold in the market.
Conclusion
In conclusion, Micron Technology emerges as a dynamic player in the ever-evolving landscape of memory and storage solutions. The comprehensive analysis spanning business units, financial performance, and future projections paints a nuanced picture of Micron’s resilience and adaptability. The Compute and Networking, Mobile, Embedded, and Storage business units collectively contribute to a diversified portfolio, strategically positioning Micron across key markets. The examination of financial metrics reveals both challenges and opportunities. The calculated fair price of $122.1, alongside the lowest target of $88.8, favors a “buy” rating.
In the face of industry seasonality and the semiconductor cycle’s influence on stock performance, Micron demonstrates a historical upward trajectory, navigating through challenges and leveraging opportunities. The persistence of cyclicality, evident even before major market events like the dot-com bubble and the 2008 recession, underscores Micron’s resilience. With the DCF models projecting favorable outcomes and annual returns, the “buy” rating aligns with the optimistic outlook, suggesting that Micron, armed with strategic positioning and financial resilience, is poised for sustained success in the dynamic realm of memory and storage solutions.
Analyst’s Disclosure: I/we have no stock, option or similar derivative position in any of the companies mentioned, but may initiate a beneficial Long position through a purchase of the stock, or the purchase of call options or similar derivatives in MU over the next 72 hours. I wrote this article myself, and it expresses my own opinions. I am not receiving compensation for it (other than from Seeking Alpha). I have no business relationship with any company whose stock is mentioned in this article.
Seeking Alpha’s Disclosure: Past performance is no guarantee of future results. No recommendation or advice is being given as to whether any investment is suitable for a particular investor. Any views or opinions expressed above may not reflect those of Seeking Alpha as a whole. Seeking Alpha is not a licensed securities dealer, broker or US investment adviser or investment bank. Our analysts are third party authors that include both professional investors and individual investors who may not be licensed or certified by any institute or regulatory body.

