Summary:
- Disney faces negative sentiment due to political rhetoric and “wokeness” accusations, but its core business remains strong and focused on children and families.
- The company’s recent performance has been affected by factors such as the integration of 21st Century Fox and regional issues in India and Southeast Asia.
- Long-term investors may find an attractive entry point in Disney’s stock, as the company is expected to continue growing, improving profitability despite short-term challenges.
Joe Raedle/Getty Images News
Negative Press
For more than a year Disney (NYSE:DIS) has been the target of Florida Governor Ron DeSantis as well as many who no longer “approve” of some of Disney’s content or feel that it is “woke.” The impact of DeSantis’ interest in Disney or that of the anti-woke crowd is dubious at best as Disney is generating revenue at or near all-time record levels. While profitability has suffered as a result of rising expenses, it is important to keep an objective, long-term perspective, and understand the fundamental status of the business.
Attention was drawn to Disney’s wokeness mostly as a result of former CEO Bob Chapek’s comments regarding Florida’s so-called “Don’t Say Gay Bill.” That brought the ire of Governor DeSantis and his acolytes. Governor DeSantis then took it upon himself to use the power of his office to go on the offensive against Disney, focusing on the Reedy Creek Improvement District, currently known as the Central Florida Tourism Oversight District. This district covers just over 39 square miles of land where the Walt Disney World Resort is located. The district was established in 1967 to oversee the land use, enact environmental protections, and to provide essential services including fire, EMTs, water/sewer, electricity, roadway maintenance, etc.
This is not a referendum on whether Disney should control the district or what role it should play in its management. The issue is mentioned to highlight how it has contributed meaningfully to the negative sentiment around the company, regardless of its validity. I have not seen any accusations from the Florida governor’s office in relation to that arrangement stating that Disney has broken any laws, violated any contracts, or partaken in any unfair or unusual business practices that would illicit any investigation. There appears to be no tangible or objective evidence of any wrongdoing related to that issue. It seems reasonable to conclude that the governor’s political opinions and feelings were the impetus for any potential conflict in my view.
Target Audience
Disney owns and controls a significant catalogue of intellectual property. It is what underpins everything the company does through branding, marketing, merchandising, and entertainment channels. Historically, the bulk of those properties used for content creation and distribution were focused on children’s entertainment. That continues to be the main driver of the business through movies, merchandise, streaming content, and park attendance. Beyond content appealing to the younger audience, Disney also produces and distributes sports content and that associated with legacy brands including Star Wars and Marvel Comics.
Understanding that Disney’s business caters to children and families is critical to looking past the current political rhetoric. Disney’s business is durable and will probably outlive everyone reading this sentence. I believe the current mood or politically-charged opinion of older, more conservative-leaning individuals are largely irrelevant. Park attendance is driven by children begging their parents and those parents taking them, spending a lot of money doing so. The same dynamics are at play for subscribing to Disney+ or going to the theater or purchasing merchandise. Today is no different than any other period in time: 5-year old girls and 8-year old boys don’t care about politics, wokeness, or Ron DeSantis. They enjoy the characters and their stories. That’s it.
It’s also important to understand that Disney is a global business with paying customers that are indifferent to American politics. Visit Disney World and there will be people from all around the world. Those people have different backgrounds and different politics, but they spend money just the same. And ultimately that’s what matters.
While I understand that the various narratives about Disney, good or bad, can drive stock prices in the short run, in the long run, when these arguments and opinions are in the rearview mirror, it will be the fundamentals that drive the stock. As a result, this mismatch may be creating an opportunity for patient investors. And if the people most negative on the company are driven by the current wokeness craze and headlines about petty politics rather than the long-term fundamentals, then I am happy to take the other side of that trade.
Recent Performance
Disney reported revenue of $21.8 billion for the second quarter 2023, ended April 1 of this year, a year-over-year increase of 13.5%. The company shed about 4 million total net subscribers from Disney+, ending the quarter with 157.8 million total subscribers, missing analyst expectations of 163.17 million. This weakness was driven by Disney+ Hotstar. Disney+ Hotstar is the version of its streaming service that Disney offers customers in India and other parts of Southeast Asia. Much of these recent losses has been driven by reduced programming for the Indian Premier League cricket matches.
Core Disney+ subscribers were higher during the quarter. Average revenue per paid subscriber increased both for the quarter and year-over-year in aggregate, although Disney+ Hotstar declined in that metric as well. Between the U.S. and Canada, the subscriber base shrunk by about 300,000, although international markets, excluding Disney+ Hotstar, added about 1 million subscribers. Hulu gained 200,000 subscribers during the quarter while ESPN+ added 400,000.
While revenue at its media and entertainment distribution segment continues to grow, albeit at a low single digit rate, expenses have outpaced that growth resulting in negative segment operating income. The largest contributor to this decline is the decline in revenue and stubbornly high expenses within Disney’s linear networks. While revenue was lower at both domestic and international channels, the weakness in international was far greater. Lower advertising revenue was the primary driver of weakness within its international channels, with airing fewer cricket matches for the Indian Premier League again the largest culprit.
Disney parks continued to be a source of strength with operating results exceeding Wall Street estimates for the quarter.
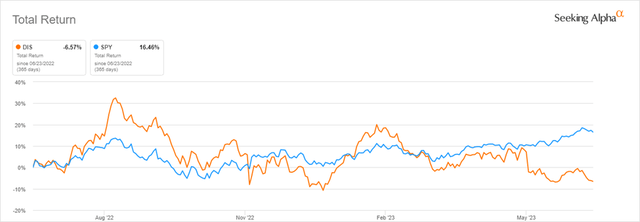
Recent performance in the stock has suffered due to the negative sentiment combined with narrow profit margins and general uncertainty about growth and profitability. The stock is significantly underperforming the broader market, declining 6.6% over the last year compared to a 16.5% gain in the S&P 500 on a total return basis.
1-Year Total Return: DIS versus SPY (Seeking Alpha)
Valuation
The stock is trading at about a 40% discount to historical value when using the metrics in the table below. This is a starting point and not enough information from which to draw a conclusion. It is possible that the stock was overvalued during the last 5 years, skewing the averages higher, or that the stock is undervalued currently, or most likely that it’s some combination of both.
|
Valuation Metric |
DIS |
DIS 5-Year Average |
% Difference to 5-Year Average |
|
P/E Non-GAAP (‘FWD’) |
22.29 |
41.63 |
-46.47% |
|
EV/Sales (‘FWD’) |
2.36 |
3.84 |
-38.60 |
|
EV/EBITDA (‘FWD’) |
13.82 |
21.60 |
-36.02% |
|
EV/EBIT (‘FWD’) |
16.20 |
27.13 |
-40.30% |
|
Price/Cash Flow (‘FWD’) |
16.01 |
26.70 |
-40.03% |
|
Price/Book (‘FWD’) |
1.61 |
2.72 |
-40.92% |
Valuation Versus Peers
While Disney appears significantly undervalued based on its historical valuation, the same cannot be said when making a peer comparison. Disney’s value as measured by the metrics in the table below is at or near the top end of the range with the four competitors/peers shown here. It is difficult to find a truly comparable company for Disney given its wide array of businesses and the scale of those businesses. For example, It makes sense to look at Netflix (NFLX) on the basis of the streaming businesses, but Netflix lacks parks, merchandise, traditional movie production and distribution, real estate operations, etc. Comcast (CMCSA) has overlap on linear television and parks through NBCUniversal, but it also has cable and internet service that better resembles a utility than a consumer discretionary type business. Similarities and differences of this scale exist across the peer group. That said, Disney appears cheap versus Netflix and expensive versus Warner Bros. Discovery (WBD), Comcast, and Paramount Global (PARA). The question is how should this be weighted relative to Disney’s historical valuation.
|
Valuation Metric |
DIS |
Warner Bros. Discovery (WBD) |
Netflix (NFLX) |
Comcast (CMCSA) |
Paramount Global (PARA) |
|
P/E Non-GAAP (‘FWD’) |
22.29 |
13.14 |
37.72 |
10.95 |
23.39 |
|
EV/Sales (‘FWD’) |
2.36 |
1.77 |
5.82 |
2.19 |
0.84 |
|
EV/EBITDA (‘FWD’) |
13.82 |
6.89 |
27.15 |
7.11 |
11.03 |
|
EV/EBIT (‘FWD’) |
16.20 |
445.20 |
30.77 |
11.75 |
13.19 |
|
Price/Cash Flow (‘FWD’) |
16.01 |
5.57 |
46.11 |
5.87 |
NM |
|
Price/Book (‘FWD’) |
1.61 |
0.63 |
7.92 |
1.95 |
0.44 |
Dividend
The last dividend paid by Disney was in December 2019, and was subsequently suspended at the onset of the pandemic. Prior to that, Disney had paid dividends for more than 30 consecutive years. Given the volatility in cash flow over the last several years, and the likelihood that that will continue, I suspect that the decision to reintroduce the dividend is years off. That said, the company could easily cover the dividend amount paid in 2019 from operating cash flow.
Profitability
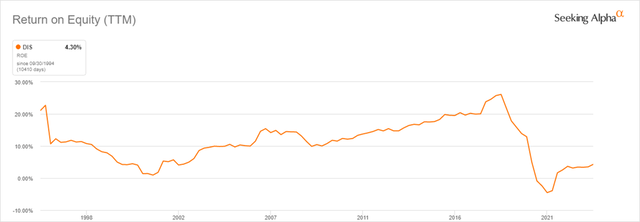
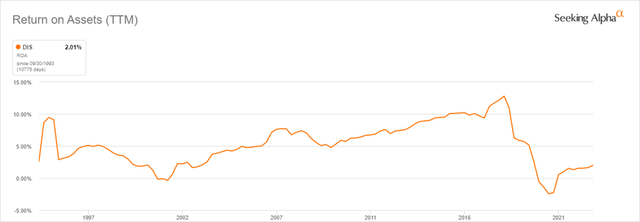
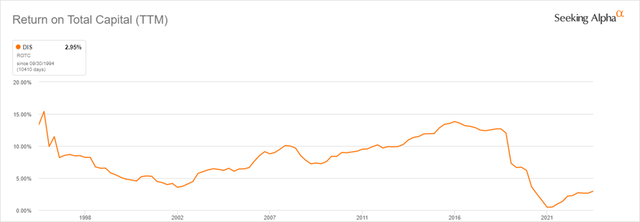
While revenue continues to grow and the gross margin remains at least close to multi-year averages, operating expenses remain stubbornly high relative to revenue, causing net margins to plummet. This in turn has resulted in much lower returns on equity, assets, and total capital. For these figures to rebound, Disney will need to make meaningful improvements to managing its expenses.
|
Profitability Metric |
DIS |
DIS 5-Year Average |
% Difference to 5-Year Average |
|
Gross Profit Margin (‘TTM’) |
33.04% |
35.84% |
-7.81% |
|
Net Income Margin (‘TTM’) |
4.74% |
7.04% |
-32.68% |
|
Return on Common Equity (‘TTM’) |
4.37% |
7.81% |
-44.03% |
|
Return on Total Assets (‘TTM’) |
2.01% |
3.23% |
-37.64% |
|
Return on Total Capital (‘TTM’) |
2.95% |
4.52% |
-34.62% |
As shown in the following three charts, Disney had been successful at increasing returns since the bottom reached during the 2001-2003 recession. The steep decline in profitability started in late 2018 and continued through 2020 as the integration of its purchase of 21st Century Fox. Since then, Disney has been actively cutting costs to improve profitability through measures including shutting the Fox 2000 Picture studio in 2020, layoffs at Fox’s Film Division, canceling numerous Fox films, and selling the Fox Sports Network, among many other efforts.
Long-Term ROE Trend (Seeking Alpha) Long-Term ROA Trend (Seeking Alpha) Long-Term ROTC Trend (Seeking Alpha)


Outlook
Disney is a ‘Hold’ for those with an investment horizon shorter than 1 year, and a ‘Buy’ for those with investment horizons measured in years and decades. I am always a long-term investor and believe that Disney will continue to grow while better managing expenses. At the current share price below $90, recovering half the 40% discount to the 5-year average valuation would represent about 30% of upside. I believe it is reasonable for a move of this magnitude to occur in the coming 12-18 months, driven by improved profitability and erosion of negative sentiment about the company.
Risks
Many risks Disney faces have been touched on throughout this article, including consumer sentiment, preferences, and tastes. Not all new efforts will bring success. Not all Disney movies will break box office records. This is reality, and it is the responsibility of Disney management to navigate through these challenges in its effort to increase shareholder value.
Profitability remains a challenge and any continued headwinds, regardless of source, across business segments pose risks to the company and its share price. Most of Disney’s products and services are considered discretionary spending, and because of this are sensitive to shifts in the economy. While cost cutting and integration in the wake of the Fox deal remains important, effective execution on continuing operations is critical: Growing Disney+ subscribers profitably, developing and producing appealing content for movies, shows, etc., continuing to operate profitably at the parks, etc. Failure in any of those areas poses a material risk to the company and its share price.
Final Thoughts
Disney is an American institution that has brought fun and entertainment through its movies and parks for the better part of the last 100 years. It is a resilient and innovative company, and there is no reason to believe that it won’t continue to be so for many years and decades to come.
The woke and other political narratives are overhyped in my opinion, and it is reasonable to expect that any negative impact they may have will be temporary, creating an attractive entry point for patient investors.
While the company’s performance has been rocky in recent years, that has been driven by several factors. The acquisition and integration of 21st Century Fox has not gone smoothly, the rapid rollout and acceptance of Disney+ has been met with rising expenses that have eaten into profitability, and the performance of streaming and linear programming in India and Southeast Asia has been erratic. The loss of streaming subscribers has been used as evidence of the decline of the brand, although most of those losses have been driven by specific regional factors.
As a shareholder and customer of Disney’s streaming service, parks, movies, and merchandise, I am confident that the business will continue to grow on the top line while expenses are reigned in to boost future profits.
Disney’s performance is always a little volatile. Park and movie attendance are driven by numerous factors beyond Disney’s direct control. Beyond weather and the economic environment at any given time, the company needs to be nimble in serving evolving interests, preferences, and tastes. It has never been easier for consumers to purchase or cancel services, or switch services, or whatever seems to make sense that day. Specifically, streaming customers can come and go based on the ebb and flow of new content. This is far greater flexibility than ever afforded by linear TV or cable service in general, and creates an ongoing challenge for Disney and its competitors.
Disney is a brand that has and should continue to endure. My opinion is that the stock is trading at a discount, but that a turnaround may not be quick and will likely experience some setbacks. Because of this I suggest that investors take a longer-term approach when valuing the stock and deciding whether it is a good fit for their portfolios.
Before adding to an individual position, especially given the short-term uncertainty at Disney, investors should consider the risks of this stock and how any position in it might impact long-term total returns and long-term investment objectives. Thank you for reading. I look forward to seeing your feedback and comments below.
Analyst’s Disclosure: I/we have a beneficial long position in the shares of DIS NFLX SPY either through stock ownership, options, or other derivatives. I wrote this article myself, and it expresses my own opinions. I am not receiving compensation for it (other than from Seeking Alpha). I have no business relationship with any company whose stock is mentioned in this article.
Seeking Alpha’s Disclosure: Past performance is no guarantee of future results. No recommendation or advice is being given as to whether any investment is suitable for a particular investor. Any views or opinions expressed above may not reflect those of Seeking Alpha as a whole. Seeking Alpha is not a licensed securities dealer, broker or US investment adviser or investment bank. Our analysts are third party authors that include both professional investors and individual investors who may not be licensed or certified by any institute or regulatory body.
