
Summary:
- Eli Lily has the highest market capitalization of any Healthcare company, but its low revenue does not justify its lofty valuation at first glance.
- However, the company’s average 5-year forward growth of 16.8% explains the market’s pricing of its stock.
- With a steady pipeline of products with a high focus on Diabetes/Obesity drugs, the company’s outlook certainly justifies its position as the highest-valued healthcare stock.
JHVEPhoto
In our previous analysis of UnitedHealth Group (UNH), we identified that Eli Lilly and Company (NYSE:LLY) has the highest market cap in the Health Care sector despite its revenue being significantly lower than the company’s. In this analysis, we analyzed the company to determine the reason for its high market cap despite its relatively lower revenues.
Firstly, we conducted an in-depth analysis of the company’s P/S ratio, which is derived by dividing its market capitalization by its sales figures. This allowed us to gauge whether the market holds elevated growth expectations for the company, particularly when compared to its competitors. Furthermore, we delved into the company’s ambitious margin growth projections, identifying the key factors driving this anticipated increase in profitability. Additionally, we assessed whether the company possesses any distinctive competitive advantages within the pharmaceutical industry that could substantiate its optimistic growth outlook.
High Revenue Growth Expectations
Firstly, we examined the company’s historical P/S ratio trend in the past 10 years until 2023.
Historical P/S
Macrotrends, Seeking Alpha, Khaveen Investments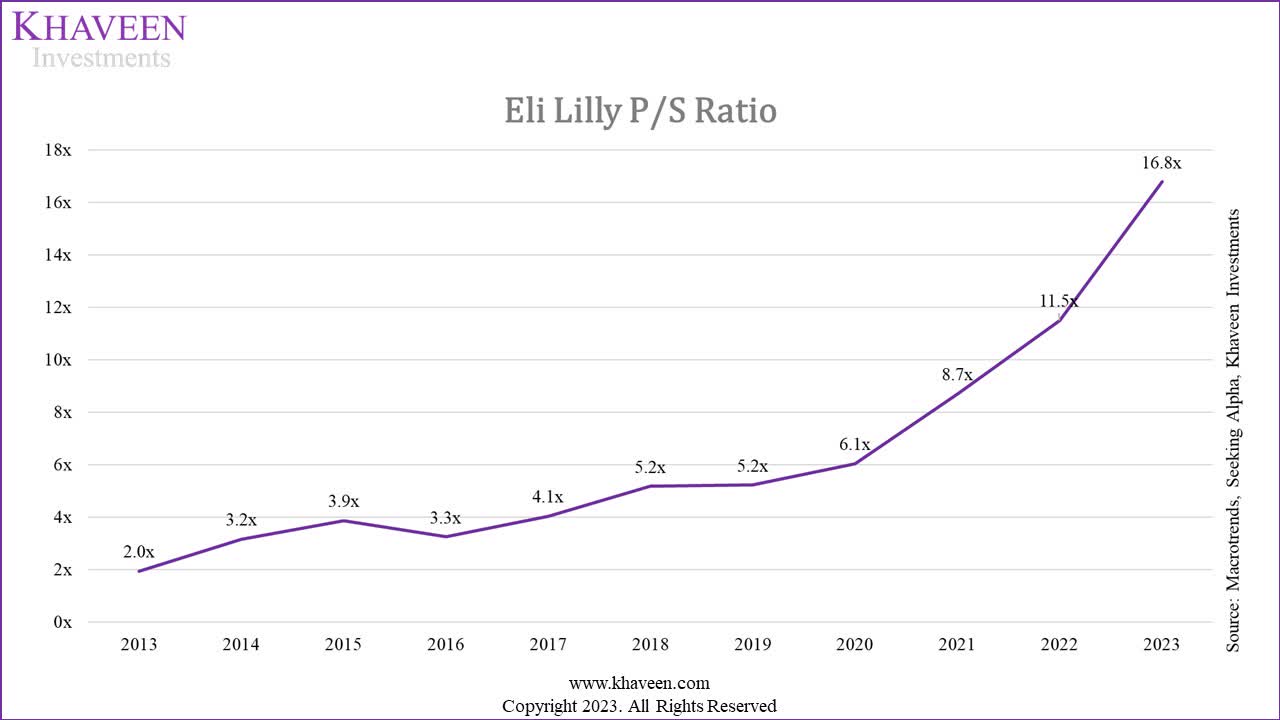
As seen above, in the past 10 years, the company’s P/S ratio increased every year except in 2016 when it decreased slightly. From 2020 onwards, its P/S ratio had increased drastically from 6.05x in 2020 to 16.8x currently. During this period, the company’s average stock return was 48%, significantly higher than its average stock return of 16.2% between 2013 to 2019. We compared the company’s P/S, stock return and revenue growth performance in the table below.
|
Eli Lilly |
2013 |
2014 |
2015 |
2016 |
2017 |
2018 |
2019 |
2020 |
2021 |
2022 |
2023* |
Average |
|
Stock Return |
3.4% |
35.3% |
22.1% |
-12.7% |
14.8% |
37.0% |
13.6% |
28.5% |
63.6% |
32.5% |
67.4% |
27.8% |
|
Revenue Growth % |
2.3% |
-15.1% |
1.7% |
6.3% |
-5.9% |
7.6% |
3.8% |
9.9% |
15.4% |
0.8% |
16.6% |
4.0% |
|
P/S Ratio |
2.0x |
3.2x |
3.9x |
3.3x |
4.1x |
5.2x |
5.2x |
6.1x |
8.7x |
11.5x |
16.8x |
6.3x |
*Revenue based on Q3 YTD
Source: MacroTrends, Seeking Alpha, Company Data, Khaveen Investments
Based on the table, the company’s stock return had been higher than its revenue growth every year in the past 10 years except in 2016 which was the only year in which its P/S ratio decreased. On average, the company’s stock return was 27.8% over the period, 7x higher than its average revenue growth of 4%, which resulted in an increase of its P/S over the period.
Industry P/S
In comparison with the P/S of the top 20 Pharmaceutical companies by revenue, Eli Lilly’s P/S of 16.8x is more than 4x times higher than the average of 3.78x. We plotted the top 20 companies’ P/S and 5-year historical average revenue growth in the chart below. Furthermore, we categorized the companies into 5 US and 15 non-US companies.
Seeking Alpha, Khaveen Investments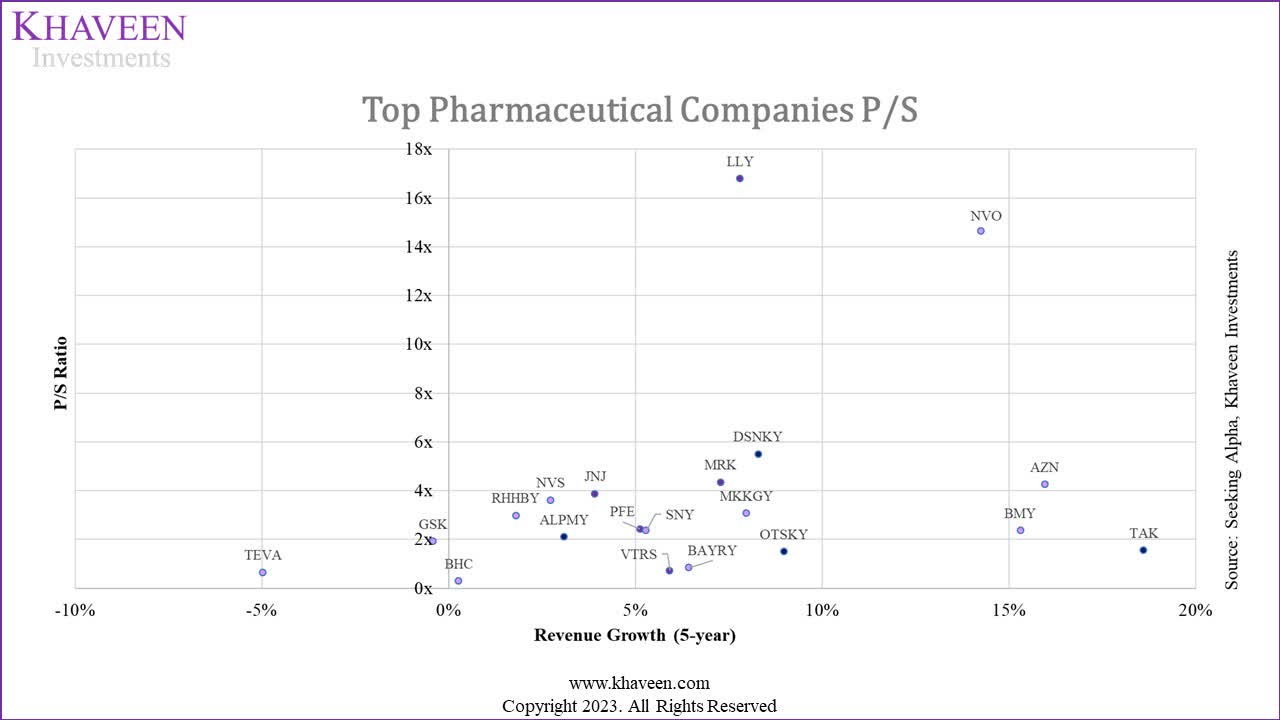
|
5-year Average Revenue Growth % |
Price / Sales (US Only) |
Price / Sales (Non-US Only) |
Price / Sales (‘All’) |
|
0 to 10% |
5.62x |
2.39x |
3.59x |
|
10 to 20% |
N/A |
5.70x |
5.70x |
|
Total |
5.62x |
3.17x |
3.78x |
|
Eli Lilly |
16.78x |
||
Source: Seeking Alpha, Khaveen Investments
Based on the chart, all of the top companies have a P/S ratio below 6x except for Eli Lilly and Novo Nordisk (NVO). The average P/S of companies with average growth of between 0% to 10% (3.59x) is lower compared to the average P/S of companies between 10% to 20% (5.7x). Within the 10% to 20% growth range, only Novo Nordisk has a relatively much higher P/S ratio of 14.7x while AstraZeneca (AZN), Bristol-Myers (BMY) and Takeda (TAK) have much lower ratios despite having higher average growth.
Furthermore, the P/S ratio for US companies with average revenue between 0 to 10% at 5.62x is higher compared to non-US companies at 3.17x primarily due to the high P/S ratio of Eli Lilly of 16.78x. For Eli Lilly, although it has had low historical growth of only 7.8%, it has the highest P/S in the industry among the top companies.
Industry Growth
|
Company |
3-year Average Growth |
5-year Average Growth |
|
Johnson & Johnson (JNJ) |
6.86% |
3.92% |
|
Roche Holding Ltd (OTCQX:RHHBY) |
0.41% |
1.81% |
|
Pfizer Inc. (PFE) |
28.46% |
5.13% |
|
Merck & Co., Inc. (MRK) |
11.81% |
7.29% |
|
Novartis Inc. (NVS) |
3.02% |
2.74% |
|
Bayer AG (OTCPK:BAYZF) |
4.26% |
6.43% |
|
Sanofi SA (SNY) |
6.67% |
5.29% |
|
AstraZeneca PLC |
20.26% |
15.97% |
|
Bristol-Myers Squibb Company |
4.48% |
15.32% |
|
GSK PLC (GSK) |
-4.70% |
-0.41% |
|
Eli Lilly And Company |
11.38% |
7.81% |
|
Novo Nordisk A/S |
19.02% |
14.27% |
|
Takeda Pharmaceutical Company Limited |
8.84% |
18.61% |
|
Merck KGaA (OTCPK:MKGAF) |
7.36% |
7.98% |
|
Viatris Inc. (VTRS) |
10.33% |
5.93% |
|
Teva Pharmaceutical Industries Limited (TEVA) |
-2.88% |
-4.96% |
|
Otsuka Holdings Co., Ltd. (OTCPK:OTSKF) |
10.80% |
8.98% |
|
Astellas Pharma Inc. (OTCPK:ALPMF) |
6.37% |
3.10% |
|
Daiichi Sankyo Company, Limited (OTCPK:DSKYF) |
12.45% |
8.30% |
|
Bausch Health Companies Inc. (BHC) |
2.05% |
0.28% |
|
Top Companies Average |
8.36% |
6.69% |
|
Industry Average |
5.10% |
5.50% |
Source: Seeking Alpha, IQVIA, Khaveen Investments
Based on the table above, the average revenue growth of the top companies has been 6.7% on a 5-year average and 5.5% for the total industry growth. No companies had more than 20% average growth with Takeda having the highest growth among the top companies at 18.3%. On a 3-year average, several companies such as Pfizer and AstraZeneca have high growth rates of 28% and 20% respectively mainly due to contributions from their Covid-related revenues. Overall, the industry’s growth has been stable and has a forecasted CAGR of 5.8%.
Company Growth
For Eli Illy, although it has had low historical growth of only 5.7%, it has the highest P/S in the industry among the top companies, which at first glance does not appear as if its valuation is justified.
Seeking Alpha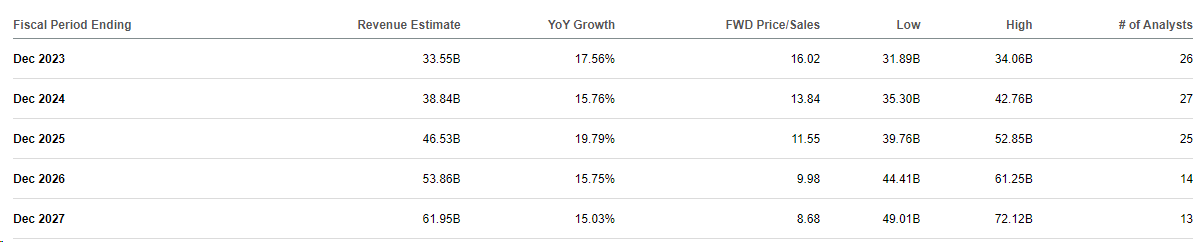
However, based on analysts’ revenue consensus, the company’s average 5-year forward growth is 16.8% and is almost 3 times higher than its past 5-year revenue growth rate (5.7%), thus indicating analysts have stronger growth expectations for the company.
|
Analysts’ Consensus Revenue Estimates |
2023F |
2024F |
2025F |
2026F |
2027F |
|
Revenue Growth % |
17.56% |
15.76% |
19.79% |
15.75% |
15.03% |
|
Revenue ($ mln) |
33,553 |
38,841 |
46,528 |
53,856 |
61,951 |
|
P/S |
17.28x |
14.93x |
12.46x |
10.77x |
9.36x |
Source: Seeking Alpha, Khaveen Investments
To examine whether the growth rate could be achievable, we analyzed the company’s pipeline below.
Pipeline
The pharmaceutical industry is one of the most R&D-intensive industries with an average R&D spending as % of sales of 21.4%. According to the company, drug development spans 4 key phases which are discovery, early development, late development and regulatory approval phase. The early development phase (Phases 1 and 2) is critical as only 10% of candidates that enter the early development phase proceed to the next phase which is the late development phase. During the late development phase, phase 3 trials are conducted and can take between 2 to 4 years to complete according to the company. The final regulatory approval phase varies between several months to years. According to N-Side, the average period for phase 3 is 3.3 years and 1.3 years for regulatory approval. Thus, the total average duration between phase 3 and the regulatory approval phase is around 4.6 years.
In the table below, we compiled the company’s product pipeline from its annual report based on its segment breakdown. Furthermore, we also included its pipeline in 2018 to compare the increase of its pipeline and estimate the revenue growth from the pipeline increase.
|
Company Pipeline |
Phase 2 |
Phase 3 |
Regulatory Approval |
Total |
|
Diabetes |
5 |
2 |
1 |
8 |
|
Immunology |
4 |
1 |
2 |
7 |
|
Neuroscience |
6 |
3 |
9 |
|
|
Oncology |
0 |
4 |
4 |
|
|
Total (2023) |
15 |
10 |
3 |
28 |
|
Total (2018) |
N/A |
7 |
2 |
9 |
Source: Company Data, Khaveen Investments
As seen above, the company has a total product development of 28 products in its pipeline. The majority of its products are in Phase 2 followed by Phase 3. In its recent earnings, it highlighted positive developments for its Neuroscience portfolio with Donanemab. In comparison with its pipeline in 2018, the company’s pipeline in 2023 is higher in phase 3 and the regulatory approval phase.
|
Revenue Growth Estimates from Pipeline Increase |
2018 |
2019 |
2020 |
2021 |
2022 |
|
Revenue Growth of the Corresponding Period |
7.61% |
3.84% |
9.95% |
15.40% |
0.79% |
|
Premium (Pipeline Increase) |
1.5 |
1.43 |
1.43 |
1.43 |
1.43 |
|
Period |
2023F |
2024F |
2025F |
2026F |
2027F |
|
Revenue Growth Forecast from Pipeline Increase |
11.4% |
5.5% |
14.2% |
22.0% |
1.1% |
Source: Company Data, Khaveen Investments
Based on the table, we estimated the company’s revenue growth in 2023 based on its 2018 revenue growth multiplied by the premium of its pipeline increase of 1.5x from its regulatory approval pipeline in 2023 compared to 2018, which gives a growth rate of 11.4% in 2023. For the 2024 to 2027 growth estimates, we multiplied the company’s growth between 2019 and 2022 with a premium of 1.43 based on the increase of its pipeline in phase 3 from 2018 to 2023. In total, we obtained an average growth rate of 10.8% in the period.
Overall, our estimation of the company’s growth through its pipeline increase shows a lower growth rate in all years compared to analyst growth consensus except 2026, with an average of 10.8% vs 16.8% for analyst consensus. Thus, we believe its pipeline increase does not fully support its growth expectations and could have an additional factor supporting the company’s growth outlook which we examine the following points below.
Summary
In summary, the company’s revenue growth in the past 10 years had not been high at an average of 4%, which is comparable with the industry average and had been driven by volume growth rather than pricing growth. Notwithstanding, the company’s share price had risen higher than its revenue growth in all years except in 2016 and which led to its increasing P/S. That said, the company has a stronger growth outlook based on analyst consensus with an average revenue growth of 16.8% which is over 3 times its past 5-year growth. We examined the company’s pipeline comparison between 2018 and 2023 and believe that the pipeline increase does not fully explain its higher growth expectations.
Based on its growth, we calculated its P/S ratio to decline to 9.4x by 2027, however, this is still much higher than the industry average P/S of 3.8x, we believe that the higher growth expectations are not the only factor that explains why the market values the company highly. In the next point, we examined its P/E ratio to determine whether margin growth could be another factor.
Margin Growth Expectations
Furthermore, besides stronger revenue growth expectations going forward, analyst consensus estimates for the company’s earnings growth are higher than revenue growth, indicating strong margin growth expectations. We also analyze the company’s P/E and compare it with competitors below.
Historical P/E
Macrotrends, Seeking Alpha, Khaveen Investments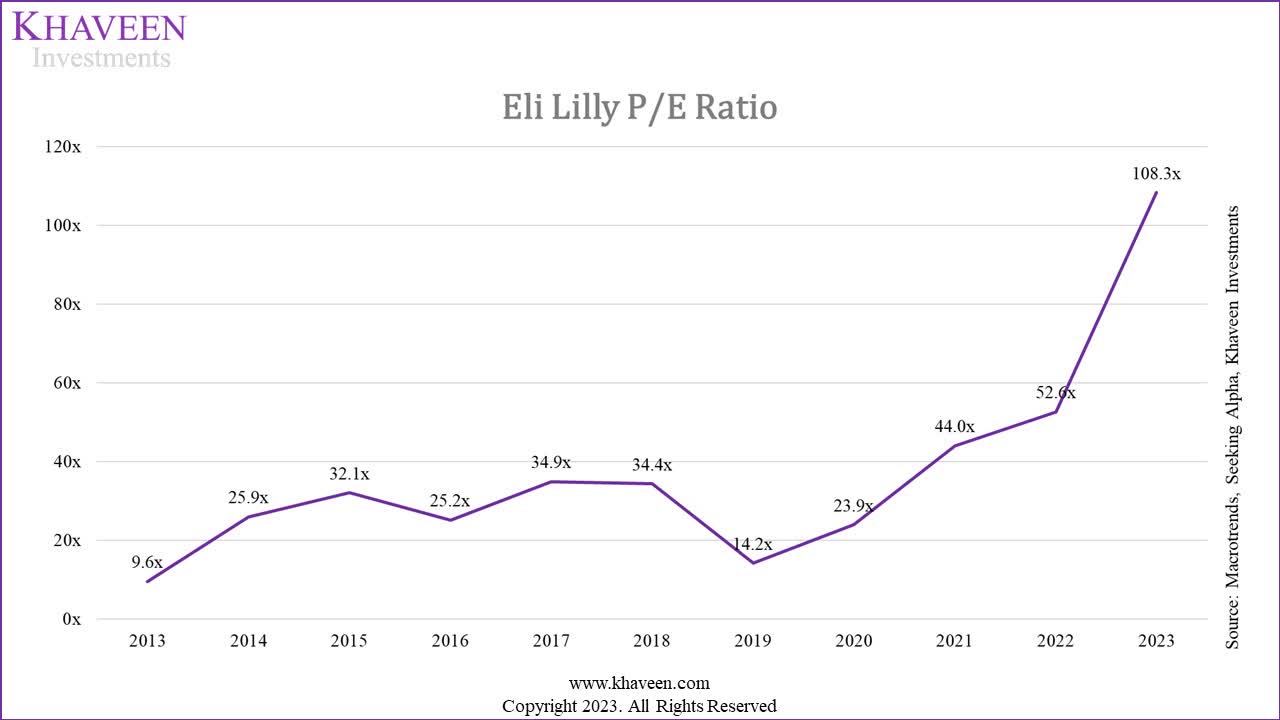
Based on the chart above, the company’s P/E ratio has also been rising in the past 10 years. The only years where its P/E ratio decreased were in 2016 and 2019. In 2016, this was when the company’s stock price declined by -12.5 % which was the only year of decline in the past 10 years as mentioned in the previous point. In 2019, the company’s net income grew by 157% due to tax adjustments of $3 bln. Following this, the company’s P/E ratio has been rising again strongly since 2020 to 108.3x currently. On the other hand, the company’s net margin decreased between 2020 and 2022 from 25.2% to 21.9% as the company incurred non-operating expenses of $1.8 bln and $1.6 bln in 2021 and 2020. Furthermore, in Q3 YTD 2023, the company’s earnings declined by 29% primarily due to “higher acquired in-process research and development (IPR&D) charges” which was $2.98 bln in Q3 2023.
Company Data, Khaveen Investments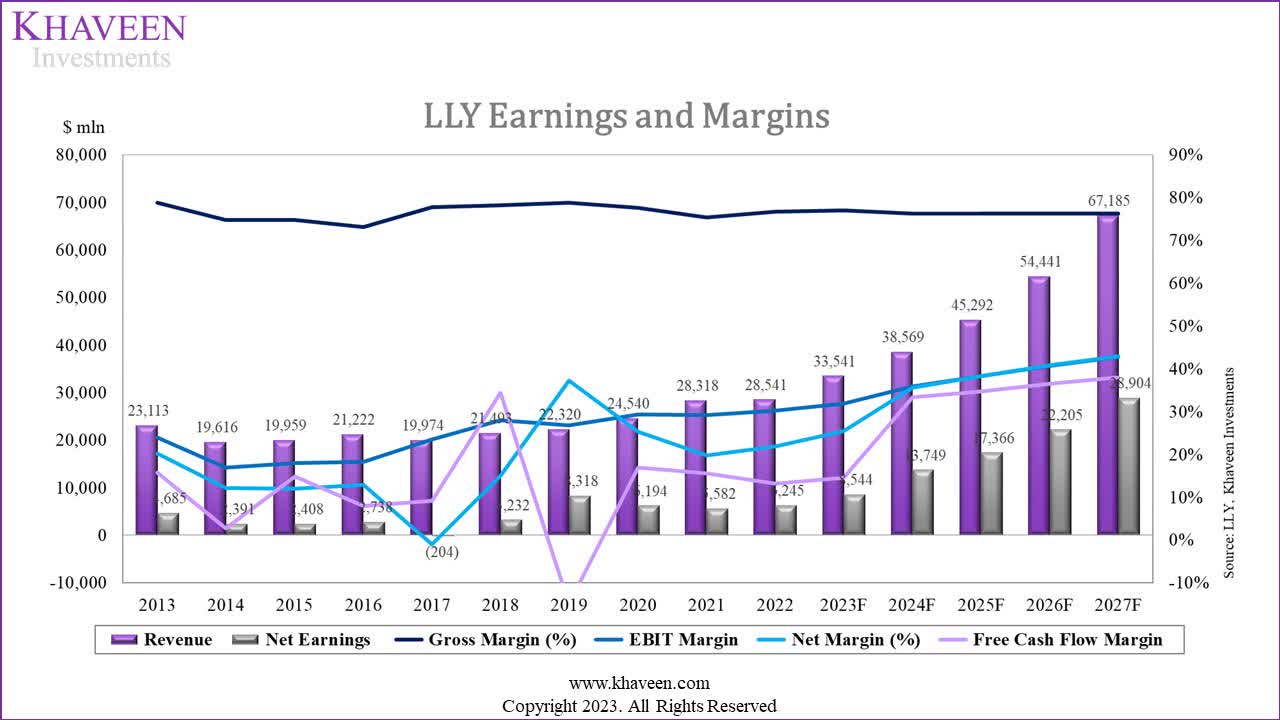
Furthermore, based on the table below, we compiled the company’s stock price return, earnings growth and P/E ratio since 2013.
|
Eli Lilly |
2013 |
2014 |
2015 |
2016 |
2017 |
2018 |
2019 |
2020 |
2021 |
2022 |
2023 |
Average |
|
Stock Return |
3.4% |
35.3% |
22.1% |
-12.7% |
14.8% |
37.0% |
13.6% |
28.5% |
63.6% |
32.5% |
67.4% |
27.8% |
|
Earnings Growth % |
14.6% |
-49.0% |
0.7% |
13.7% |
-107.5% |
-1683.5% |
157.4% |
-25.5% |
-9.9% |
11.9% |
-29.2% |
-155.1% |
|
P/E Ratio |
9.6x |
25.9x |
32.1x |
25.2x |
34.9x |
34.4x |
14.2x |
23.9x |
44.0x |
52.6x |
108.3x |
36.8x |
Source: Company Data, Khaveen Investments
As seen in the table, the company’s earnings growth fluctuated over the period. In 2018, the company’s earnings declined by -1,674% as it incurred tax expenses of $3 bln due to the impact of the Tax Cuts and Jobs Act. Excluding 2018, the company’s average earnings growth was -2.3%. Additionally, the company’s average stock return of 27.8% is higher compared to its average earnings growth, which resulted in its P/E increase over the period.
Industry P/E
|
Company |
P/E TTM |
|
Johnson & Johnson |
27.58x |
|
Roche Holding Ltd |
17.16x |
|
Pfizer Inc. |
16.08x |
|
Merck & Co., Inc. |
56.31x |
|
Novartis Inc. |
24.03x |
|
Sanofi SA |
11.93x |
|
AstraZeneca PLC |
32.64x |
|
Bristol-Myers Squibb Company |
12.84x |
|
GSK PLC |
9.46x |
|
Eli Lilly And Company |
108.25x |
|
Novo Nordisk A/S |
41.83x |
|
Takeda Pharmaceutical Company Limited |
33.69x |
|
Merck KGaA |
22.69x |
|
Viatris Inc. |
6.08x |
|
Otsuka Holdings Co., Ltd. |
15.74x |
|
Astellas Pharma Inc. |
94.22x |
|
Daiichi Sankyo Company, Limited |
51.92x |
|
Average |
34.26x |
Source: Khaveen Investments
Based on the table, the average P/E of the top companies in the industry is 34.26x with Eli Lilly’s P/E at 108.25x.
Margins
|
Top 10 Pharmaceuticals |
Gross Profit Margin |
EBIT Margin |
Net Income Margin |
FCF Margin |
|
Johnson & Johnson |
67.56% |
27.97% |
35.10% |
21.46% |
|
Roche Holding Ltd |
73.12% |
31.09% |
17.47% |
17.45% |
|
Pfizer Inc. |
54.63% |
11.45% |
15.29% |
-0.69% |
|
Merck & Co., Inc. |
73.09% |
15.57% |
7.77% |
9.57% |
|
Novartis Inc. |
71.27% |
29.83% |
14.45% |
41.30% |
|
Sanofi SA |
60.13% |
4.11% |
-7.68% |
0.33% |
|
AstraZeneca PLC |
69.54% |
21.99% |
19.84% |
19.13% |
|
Bristol-Myers Squibb Company |
89.17% |
31.22% |
13.10% |
28.17% |
|
GSK PLC |
77.01% |
18.85% |
18.44% |
27.85% |
|
Johnson & Johnson |
72.14% |
25.83% |
20.48% |
6.28% |
|
Average |
70.77% |
21.79% |
15.43% |
17.09% |
Source: Company Data, Khaveen Investments
In terms of margins, the top companies have strong profitability with impressive gross margins of above 70.8% on average. However, their average EBIT and net margins are considerably lower due to operating expenses such as R&D and SG&A. Notwithstanding, all companies have positive net margins with a wide range between the highest (JNJ) and lowest (Sanofi). Furthermore, all of the top companies except Pfizer have positive FCF margins which highlight their strong cash flow-generating abilities.
Based on analyst consensus, the company has a strong EPS growth outlook in the next 5 years with an average of 30.63% compared to the forward average revenue growth consensus of 16.8%. Additionally, the forward P/E ratio shows a declining trend to 23.77x by 2027 which is below the industry’s current average of 34.3x.
Seeking Alpha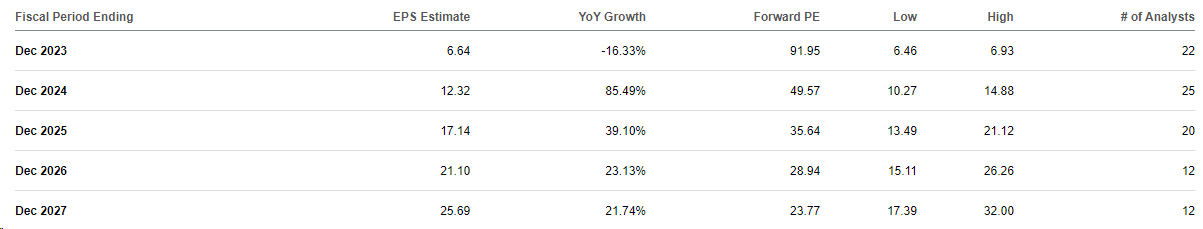
In the table below, we calculated the analyst consensus expected net margins for the company through 2027 based on their consensus revenue and earnings growth.
|
Analysts’ Consensus Earnings Estimates |
2023F |
2024F |
2025F |
2026F |
2027F |
|
Revenue Growth % |
17.56% |
15.76% |
19.79% |
15.75% |
15.03% |
|
Revenue |
33,553 |
38,841 |
46,528 |
53,856 |
61,951 |
|
Net Earnings |
5,225 |
9,692 |
13,481 |
16,600 |
20,208 |
|
Growth % |
-16.33% |
85.49% |
39.10% |
23.13% |
21.74% |
|
Analyst Consensus Expected Net Margins |
15.6% |
25.0% |
29.0% |
30.8% |
32.6% |
Source: Seeking Alpha, Company Data, Khaveen Investments
Based on analyst consensus, the expected net margins are expected to decline in 2023 due to the increase IPR&D charges but recover strongly in 2024 and rise each year through 2027 to 32.6% by 2027, which is a huge increase of 17%.
Company Data, Khaveen Investments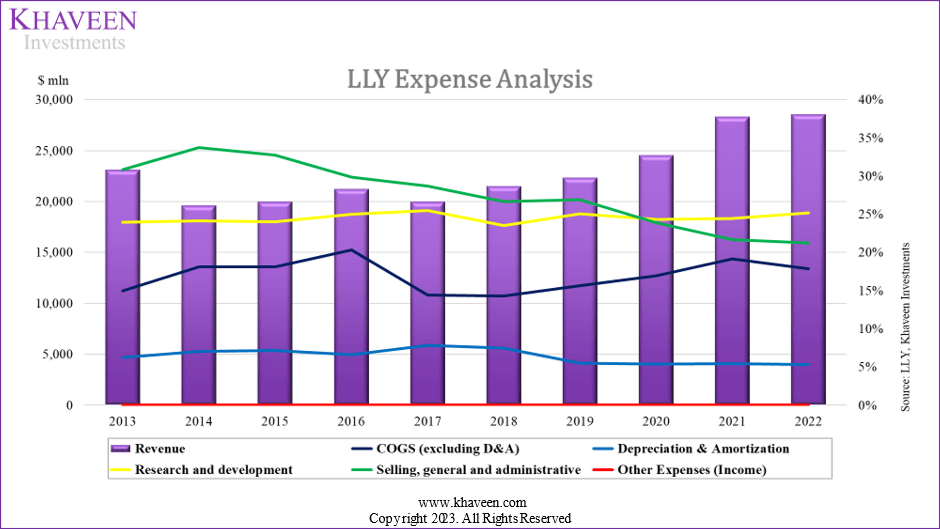
Based on an expense analysis of the company, the main expenses of the company include R&D, SG&A, COGS and depreciation.
- SG&A: Its SG&A expenses % of revenue had been trending downwards in the past 10 years and decreased by a total of 9.6%.
- R&D: Its R&D as a % of revenue has been very stable in the past 10 years at an average of 24.5%. We expect the company’s R&D spending % of revenue to remain stable going forward given its commitment to product development to support its pipeline.
- COGS: Its COGS as % of revenue was volatile as it increased until 2016 before declining in 2017 but had risen again through 2021 and moderated in 2022.
- Depreciation: The company’s depreciation expenses have declined slightly in the past 10 years.
Among its operating expenses, we believe SG&A is the most significant factor affecting the company’s profitability as it has decreased as a % of revenue the most in the past 10 years and is the second largest expense of the company behind R&D which had been highly stable, thus we examined it further below.
|
Eli Lilly ($ mln) |
2013 |
2014 |
2015 |
2016 |
2017 |
2018 |
2019 |
2020 |
2021 |
2022 |
Average |
|
SG&A Expenses |
7,126 |
6,621 |
6,533 |
6,330 |
5,733 |
5,735 |
6,004 |
5,869 |
6,142 |
6,068 |
|
|
Growth % |
-7.1% |
-1.3% |
-3.1% |
-9.4% |
0.0% |
4.7% |
-2.2% |
4.6% |
-1.2% |
-1.7% |
Source: Company Data, Khaveen Investments
As seen, its SG&A expenses growth had been flattish on average over the period, The year with the largest decrease in its SG&A was 2017 when the company had a restructuring exercise to streamline its business which included reducing its employees by 3,500 employees. In 2019, the company again restructured its business in Europe and cut 250 jobs. Its employee headcount had fluctuated in the past 10 years with an average growth rate of only 0.5% while its revenue growth grew slightly higher at 2.7%. According to Frost & Sulivan, the pharmaceutical industry’s “current business model is slowly transforming into a lean and focused business model built in the form of small localized R&D clusters”. Moreover, its top US competitors Pfizer and Merck also had stagnant headcount growth with an average of 0.7% and -0.1% respectively with fluctuating growth over the past 10 years.
Furthermore, the company has also refocused its area of focus such as in 2014 when it allowed its Neuroscience segment’s Cymbalta and Evista patents to expire. This led to a decrease in SG&A expenses with the reduction in marketing activities according to the company’s annual report. Also, the company had divested business segments such as its Elanco Animal Health Inc which was its animal health business in 2018.
Eli Lilly
Furthermore, according to Global Data, the company’s patent filings remained stable from 2017 to 2022 and have a CAGR of -0.5%. We expect the company’s patent filings to remain stable and forecast it based on its historical CAGR of -0.5%.
|
SG&A Projections ($ mln) |
2020 |
2021 |
2022 |
2023F |
2024F |
2025F |
2026F |
2027F |
|
Revenue |
24,540 |
28,319 |
28,541 |
33,541 |
38,569 |
45,292 |
54,441 |
67,185 |
|
Growth % |
9.9% |
15.4% |
0.8% |
17.5% |
15.0% |
17.4% |
20.2% |
23.4% |
|
SG&A |
5,869 |
6,142 |
6,068 |
5,966 |
5,866 |
5,768 |
5,672 |
5,577 |
|
Growth % |
-2.2% |
4.6% |
-1.2% |
-1.7% |
-1.7% |
-1.7% |
-1.7% |
-1.7% |
|
SG&A as % of Revenue |
23.9% |
21.7% |
21.3% |
17.8% |
15.2% |
12.7% |
10.4% |
8.3% |
Source: Company Data, Khaveen Investments
As a result, in the table above, we forecast the company’s SG&A expenses to remain stable going forward based on its past 10-year growth average of -1.2%, thus we see its SG&A % of revenue declining from 18.8% in 2023 to 9.1% by 2027.
Summary
Overall, we determined that the company’s high valuation is also contributed by expectations of margin expansion as reflected by analysts’ consensus. We calculated the company’s net margins are expected to rise to 32.6% by 2027 from 22% in 2022, an increase of 10%. We believe the company’s key margin growth driver is its declining SG&A expenses as a % of revenue and we forecasted it to continue decreasing as a % of revenue to 8.3% by 2027 based on its past average growth of -1.2% due to the company’s stagnant employee headcount as the Pharmaceutical industry become more focused and lean. Furthermore, management previously highlighted margin expansion opportunities for the long term.
Notwithstanding these long-term investments, we continue to expect our revenue will grow more rapidly than our expense base in the coming years and see significant opportunity for margin expansion. – David Ricks, Chairman, CEO & President
Diabetes Drug Present Significant Growth Opportunities
Between 2019 and 2023, we compiled several factors that are positive on Eli Lilly according to analysts and various new sources.
Seeking Alpha, Khaveen Investments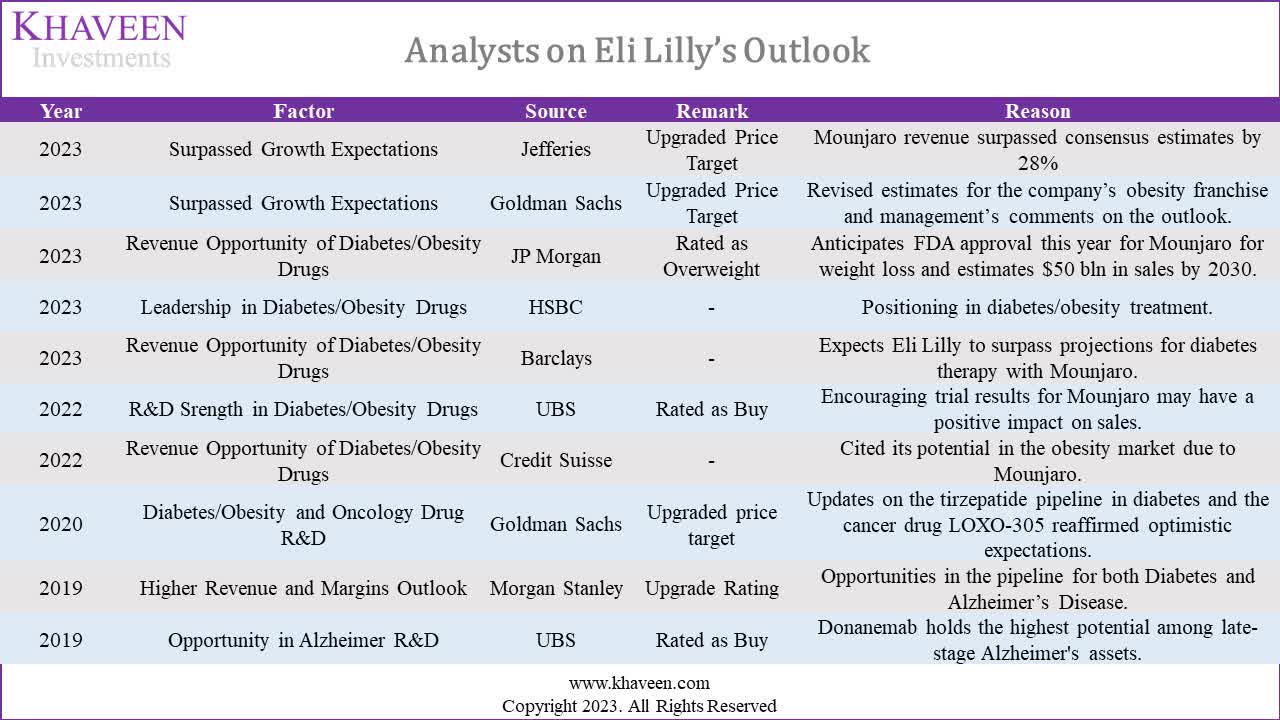
In the table above, we compiled the positive company factors that analysts are optimistic about the company. Notably, Jefferies and Goldman Sachs (GS) upgraded Eli Lilly’s price target due to the company exceeding growth expectations, particularly in Mounjaro revenue, surpassing consensus estimates. JPMorgan (JPM), Barclays (BCS) and Goldman Sachs emphasize higher revenue prospects from Diabetes/Obesity Drugs, especially Mounjaro, with JPMorgan projecting it to achieve revenues of $50 bln by 2030.
Furthermore, another factor is the company’s leadership and R&D in diabetes/obesity drugs. Leadership in diabetes/obesity drugs is recognized by HSBC (HSBC) and UBS (UBS) rates Eli Lilly for strength in diabetes and weight loss R&D.
Additionally, besides diabetes and oncology, the company’s opportunity with its Alzheimer R&D was also cited by Morgan Stanley (MS) and UBS in 2019. Nonetheless, in total, out of the 10 factors highlighted by analysts, the majority (9) of these factors are related to the company’s weight loss/diabetes drug Mounjaro which we believe highlights the company’s fundamental strength. Moreover, 2 out of the 10 factors were related to Alzheimer’s, which is the company’s Neurosciences segment and 1 of the 10 factors related to cancer drugs under its Oncology segment.
Furthermore, we then compiled factors by segment in the past 5 years from 29 news articles from Seeking Alpha.
|
Factor |
Segment |
2019 |
2020 |
2021 |
2022 |
2023 |
Total |
|
R&D Strength |
Diabetes/Obesity |
1 |
6 |
7 |
|||
|
Surpassed Growth Expectations |
Diabetes/Obesity |
1 |
1 |
||||
|
Revenue Opportunity |
Diabetes/Obesity |
1 |
1 |
2 |
|||
|
Acquisitions |
Diabetes/Obesity |
1 |
1 |
||||
|
Partnerships |
Diabetes/Obesity |
1 |
1 |
||||
|
R&D Strength |
Oncology |
1 |
1 |
1 |
1 |
4 |
|
|
Partnerships |
Oncology |
1 |
1 |
2 |
|||
|
R&D Strength |
Immunology |
1 |
1 |
2 |
1 |
5 |
|
|
Partnerships |
Immunology |
1 |
1 |
||||
|
R&D Strength |
Neuroscience |
1 |
1 |
2 |
|||
|
Acquisitions |
Neuroscience |
1 |
1 |
1 |
3 |
||
|
Total |
3 |
5 |
6 |
3 |
12 |
29 |
Source: Seeking Alpha, Khaveen Investments
Out of the total news articles, the Diabetes/Obesity segment had the most with 12 of the 29 news were related to this segment. For this segment, we identified factors such as R&D strength, surpassed growth expectations, revenue opportunity, acquisitions and partnerships. Its R&D strength is the top factor for the segment with a total of 7 followed by revenue opportunity. Most of these articles were from 2022 to 2023.
Its Oncology and Immunology segments were tied with the second most news sources (6 each). We identified the factors related to these segments were R&D strength and partnerships. The final segment is Neuroscience which mainly encompasses the company’s Alzheimer’s drug development and acquisitions.
Overall, for the factors for both analyst and new sources, we identified the most significant fundamental factor as diabetes/obesity. As seen in the chart below, the Diabetes segment is the main contributor to the company’s revenue (55%) in 2023.
Company Data, Khaveen Investments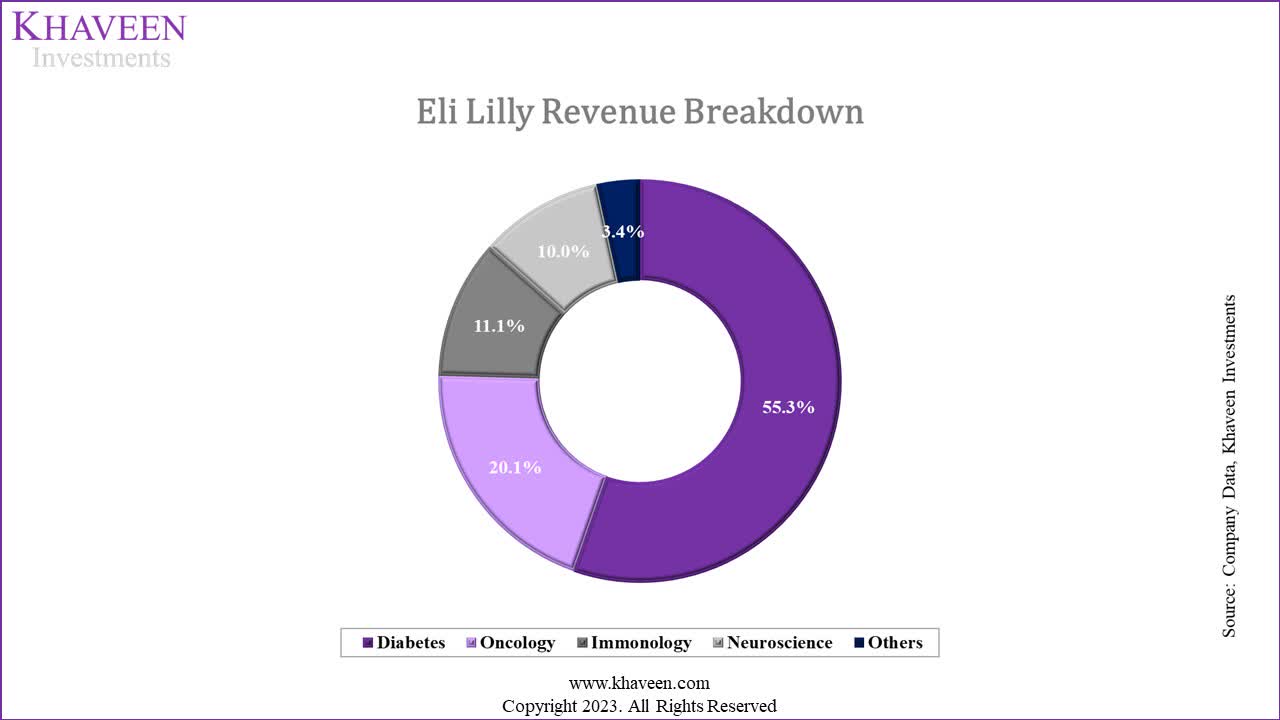
Diabetes/Obesity Factor
As we identified earlier, Novo Nordisk is another company with high P/S in the industry and we identified it as a competitor to Eli Lilly with its Wegovy drug and hence the similarity with Eli Lilly as both companies have drugs targeting diabetes/obesity. Thus, we believe the obesity drug is a reason for its premium to the industry’s P/S. Based on both companies’ differences between their P/S and industry average P/S, we calculated the average premium attributed to its obesity drug is 4.2x.
Diabetes/Obesity Drug Revenue Opportunity
In terms of the revenue opportunity for the company’s new diabetes/obesity drug (Mounjaro), JPMorgan forecasted the drug to reach a revenue of $50 bln by 2030 compared to its 2022 revenue of $0.5 bln, which represents a CAGR of 58.4%.
|
Eli Lilly Diabetes Segment Revenue ($ mln) |
2020 |
2021 |
2022 |
2023 (Annualized) |
Average |
|
Trulicity |
5,068 |
6,472 |
7,440 |
7,284 |
|
|
Growth % |
27.7% |
15.0% |
-2.1% |
13.5% |
|
|
Jardiance |
1,154 |
1,491 |
2,066 |
2,595 |
|
|
Growth % |
29.2% |
38.6% |
25.6% |
31.1% |
|
|
Humalog |
2,626 |
2,453 |
2,061 |
1,729 |
|
|
Growth % |
-6.6% |
-16.0% |
-16.1% |
-12.9% |
|
|
Humulin |
1,260 |
1,223 |
1,019 |
885 |
|
|
Growth % |
-2.9% |
-16.6% |
-13.2% |
-10.9% |
|
|
Basagla |
1,124 |
893 |
760 |
724 |
|
|
Growth % |
-20.6% |
-14.8% |
-4.8% |
-13.4% |
|
|
Mounjaro |
483 |
3,943 |
|||
|
Growth % |
717.3% |
717.3% |
|||
|
Other diabetes |
603 |
657 |
636 |
1,401 |
|
|
Growth % |
9.1% |
-3.2% |
120.1% |
42.0% |
|
|
Total Revenue |
11,834 |
13,188 |
14,465 |
18,403 |
|
|
Growth % |
11.4% |
9.7% |
27.2% |
16.1% |
Source: Company Data, Khaveen Investments
Based on the table above, the company’s Mounjaro drug which was launched in 2022 had recorded an annualized revenue of $3.9 bln which represents a strong growth of 717% compared to 2022 of $0.5 bln and represents 21% of the company’s Diabetes segment revenue.
The company has already obtained FDA approval for Mounjaro to be used for diabetes and expects to obtain FDA approval for obesity and weight in 2023. We believe this could be a driver for the market as nearly 1 in 3 adults in the US are overweight. According to a survey by KFF, almost half of US adults express a desire for weight-loss drugs, but the actual use remains low, with 87% having never taken prescription weight-loss medications.
In relation, concerns regarding insurance coverage and administration methods appear to influence interest levels. However, the US government has proposed a bill to expand Medicare coverage for weight loss drugs which we believe could further support demand for the product.
Leading Market Position in Diabetes/Obesity
According to HSBC, Eli Lilly and competitor Novo Nordisk have leading positions in the diabetes drug market. Furthermore, JPMorgan expects both of these companies to maintain their leading positions through 2030.
Eli Lilly’s Trulicity currently holds a dominant position in the US market with a substantial 44.7% share, while Novo’s Ozempic accounts for 27.9%. In 2014, Eli Lilly launched Trulicity, a once-weekly GLP-1 agonist drug, challenging Novo’s daily injection, Victoza. Novo responded by introducing Ozempic three years later and adding Rybelsus, an oral version, to its portfolio in 2019.
According to Medical News Today, a recent study found that tirzepatide (Mounjaro) exhibits greater effectiveness in treating diabetes and promoting weight loss when compared to semaglutide medications such as Ozempic and Wegovy. Furthermore, in July 2023, the company reported trial results that indicated up to 26% weight loss.
In a meta-analysis of 22 trials, researchers report that tirzepatide was superior to semaglutide for controlling blood sugar and weight loss. The findings will be presented at the European Association for the Study of Diabetes annual meeting in Germany in early October. – Medical News Today
Summary
To summarize, based on our analysis, we believe its Diabetes/obesity segment is the key fundamental factor supporting the outlook of the company and the segment accounted for 60% of the company’s revenue in 2023. Moreover, we believe the diabetes/obesity drug is a reason for its premium to the industry’s P/S and we calculated the average premium attributed to its obesity drug is 4.2x. We believe the revenue opportunity is reflected by the potential approval of its Mounjaro to be used for obesity and weight loss by the FDA. Additionally, we believe the company’s superior product capabilities are highlighted based on the study which could support its leading market position.
Risk: Competitors’ Obesity Drug Development
Although we believe the company’s positioning in the obesity drug market is strong with its Mounjaro product, the company faces competition in obesity drug development, with several other pharmaceutical companies actively pursuing treatments for weight loss and related conditions. Novo Nordisk, for instance, was among the pioneers in this area, launching weight loss treatments known as Wegovy and Ozempic. Additionally, we believe new entrants could be enticed by the high growth outlook of the obesity drug market compared to the overall industry growth forecast of only 5.8%, thus posing further competition to the company. For example, Pfizer was developing an obesity drug but canceled it in 2023 due to “safety concerns”.
Valuation
|
Revenue Projections ($ mln) |
2022 |
2023F |
2024F |
2025F |
2026F |
2027F |
|
Diabetes |
14,465 |
18,562 |
22,351 |
27,760 |
35,524 |
46,815 |
|
Growth % |
9.7% |
28.3% |
20.4% |
24.2% |
28.0% |
31.8% |
|
Oncology |
5,666 |
6,737 |
7,506 |
8,324 |
9,189 |
10,099 |
|
Growth % |
-1.3% |
18.9% |
11.4% |
10.90% |
10.40% |
9.90% |
|
Neuroscience |
1,546 |
3,351 |
3,537 |
3,730 |
3,930 |
4,137 |
|
Growth % |
-18.6% |
116.7% |
5.56% |
5.46% |
5.36% |
5.26% |
|
Immunology |
3,345 |
3,736 |
4,054 |
4,388 |
4,739 |
5,106 |
|
Growth % |
-0.5% |
11.7% |
8.50% |
8.25% |
8.00% |
7.75% |
|
Others |
3,520 |
1,155 |
1,122 |
1,090 |
1,059 |
1,028 |
|
Growth % |
-14.8% |
-67.2% |
-2.9% |
-2.9% |
-2.9% |
-2.9% |
|
Total |
28,541 |
33,541 |
38,569 |
45,292 |
54,441 |
67,185 |
|
Growth % |
0.8% |
17.5% |
15.0% |
17.4% |
20.2% |
23.4% |
Source: Company Data, Khaveen Investments
We projected the company’s growth by segments with 2023 based on annualized Q3 YTD growth rates. For Diabetes, we projected the segment based on its product breakdown with a historical 3-year average growth assumption for all products except for Mounjaro which we based on JPMorgan’s CAGR of 58.4%. Furthermore, we based our forecast for its Neuroscience, Oncology and Immunology on the neuroscience (5.56%), cancer drug market (11.4%) and immunology drug (8.5%) market forecast CAGR, tapered down beyond 2024. Finally, we projected its other revenue growth on its past 5-year growth rate. Overall, we derived a 5-year forward growth rate of 18.7% which is higher than its past growth but in line with analysts’ consensus estimates (16.8%).
Khaveen Investments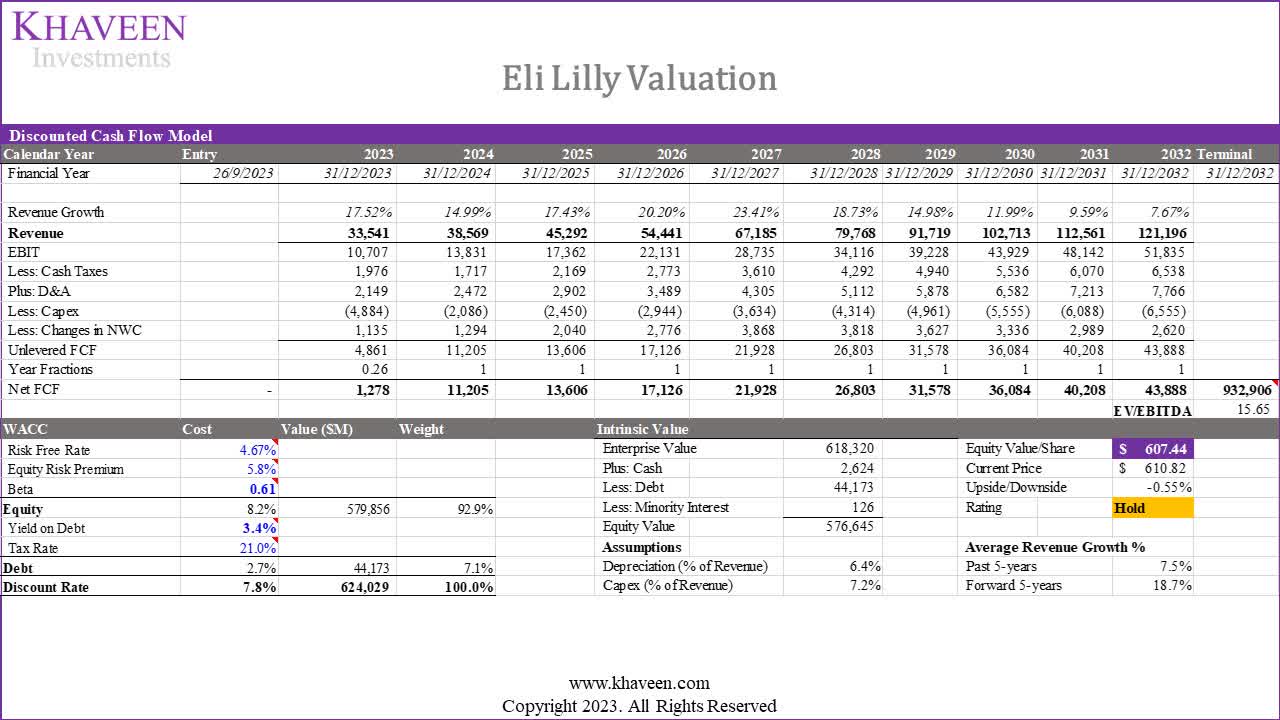
Based on a discount rate of 7.8% (company’s WACC) and terminal value based on the average EV/EBITDA of the top 12 Pharmaceutical companies of 15.65x, our model shows its shares are fairly valued.
Verdict
All in all, one of the key factors for the company’s high valuation is expectations of higher forward growth with a 5-year forward analysts’ consensus growth averaging 16.8% which is more than 3x higher than its historical growth. We see one of the factors supporting its growth outlook is its robust product pipeline in comparison to the past 5 years across various therapeutic areas such as Diabetes and Neuroscience. Though, we see its Diabetes business as its strongest driver of growth with a forecasted average growth of 26.5% due to the rise of its Mounjaro product for obesity treatments, supporting a 5-year forward average growth of 18.7%. Additionally, we determined better margin growth expectations as another driver of its high valuation. Based on our forecast, we see its net margins rising to 32.6% by 2027 from 22% in 2022, due to its stagnant employee headcount growth, increasing focus of the Pharmaceutical industry and stable patent growth trends. Despite these positive developments, based on our DCF valuation, our model shows its shares are perfectly priced, following a strong share price rally of 67% this year, thus we rate the company as a Hold.
Analyst’s Disclosure: I/we have a beneficial long position in the shares of LLY either through stock ownership, options, or other derivatives. I wrote this article myself, and it expresses my own opinions. I am not receiving compensation for it (other than from Seeking Alpha). I have no business relationship with any company whose stock is mentioned in this article.
No information in this publication is intended as investment, tax, accounting, or legal advice, or as an offer/solicitation to sell or buy. Material provided in this publication is for educational purposes only, and was prepared from sources and data believed to be reliable, but we do not guarantee its accuracy or completeness.
Seeking Alpha’s Disclosure: Past performance is no guarantee of future results. No recommendation or advice is being given as to whether any investment is suitable for a particular investor. Any views or opinions expressed above may not reflect those of Seeking Alpha as a whole. Seeking Alpha is not a licensed securities dealer, broker or US investment adviser or investment bank. Our analysts are third party authors that include both professional investors and individual investors who may not be licensed or certified by any institute or regulatory body.